Abstract
Objective
Evaluation of optic nerve sheath diameter (ONSD) is a suggested correlation of intracranial pressure (ICP) and potential predictor of outcome after neurologic injury. Studies have evaluated sonographic measurement of ONSD; however, clinical limitations to this approach persist. Evaluation of ONSD measurements via routine brain CT imaging is less studied but offers potential for detection of increased ICP in the absence of invasive monitoring. Previous studies have used cross-sectional approaches to ONSD measurements via CT scan among patients with traumatic brain injury (TBI). No studies have evaluated serial correlations between CT ONSD measurements and ICP throughout hospitalization and across diagnosis types. The objective of this study was to investigate correlations between ONSD via serial CT imaging, ICP, and outcome at discharge among patients with neurologic injury.
Methods
This is a retrospective cohort study of all adult patients admitted during a 12-month period with acute neurologic injury requiring ICP monitoring and critical care admission.
Results
N = 48. There was a strong, positive correlation between right/left ONSD across time points (r = 0.7–9, p < 0.001), suggesting a consistent bilateral response. Correlations were strongest between initial inpatient CT scan ONSD readings and ICP (r = 0.5, p < 0.05), but decreased over time. Patients with increased ICP across all diagnosis types experienced higher ONSD values on presentation to the emergency department (ED) and throughout hospitalization (range 5.7–6.4 mm, p < 0.05).
Conclusions
Findings contribute to the utility of CT ONSD measurements as a potential indicator of increased ICP. Measurement of ONSD during serial CT brain imaging may inform clinical decisions regarding need for more invasive monitoring after neurologic injury.

Patients who experience increased intracranial pressure (ICP) after acute neurologic injury often have increased morbidity and mortality. Clinical signs for increased ICP are often unreliable or manifest too late, delaying therapeutic treatment.1 The current standard for diagnosis of increased ICP is insertion of an intraventricular or intraparenchymal catheter into the cranial vault, which can result in complications such as hemorrhage and infection.2 Invasive ICP monitoring may not always be readily available because of lack of equipment or personnel, particularly in emergent situations. Research suggests some increases in ICP may be detected noninvasively via measurement of the optic nerve sheath diameter (ONSD).3
The optic nerve sheath is an anatomical extension of the dura mater and subarachnoid space; therefore, pressure increases within the intracranial compartment can impact the optic nerve head, resulting in bilateral optic disc swelling called papilledema.1 Although sonographic measurement of ONSD may emerge as a viable, noninvasive mechanism for detecting increases in ICP, there are limitations to this approach. Lack of trained personnel, bedside equipment, and discomfort for the patient limit widespread utilization of a sonographic approach as a noninvasive screening mechanism for increased ICP with sonography. However, CT scans are typically available across centers and performed on admission and routine intervals for patients with suspected intracranial pathology. Preliminary research suggests a correlation between ONSD obtained via CT at discrete time points among patients with traumatic brain injury (TBI).4,5 However, no research has examined serial measurement of ONSD via CT and correlation with ICP values across diagnosis types and throughout the duration of hospitalization. The primary objective of this study was to identify the correlation between serial ONSD measurements obtained via routine CT scans and ICP values among critically ill patients with neurologic injury. Secondary objectives were to identify the predictive value of ONSD via routine CT scans for increased ICP, patient mortality, and functional outcome.
Methods
Standard Protocol Approvals, Registrations, and Patient Consents
Ethical and scientific merit were considered before obtaining IRB approval.
Study Design
This was a retrospective descriptive design. Data were abstracted from the medical records of patients meeting inclusion criteria. Cases included adult patients (age 18 or older) admitted to a large, academic medical center with suspected intracranial pathology necessitating placement of an ICP monitor, critical care admission, and administration of a CT scan as standard of care between January 2018 and December 2018. Exclusion criteria were patients with known orbital trauma, and those patients where ONSD was unmeasurable because of imaging technique or quality. Subjects were identified via billing records for placement of ICP monitors, and inclusion criteria were verified by at least 2 investigators before data collection and measurement of ONSD. One study investigator remained blinded to ICP data and performed all ONSD readings from CT scans for included subjects. ONSD was measured on axial sequences at a distance of 3 mm behind the posterior wall of the optic globe. Clinical and demographic data were abstracted using a standardized abstraction tool. Study variables included: patient age, sex, admission diagnosis, Glasgow Coma Scale (GCS) on admission and immediately before each serial CT scan, ICP values immediately before (within 1 hour) each serial inpatient CT scan, right and left ONSD values for admission CT scan, and up to 3 consecutive serial inpatient CT scans, intensive care unit (ICU) and hospital length of stay, mortality at discharge, and functional status (modified Rankin score) at hospital discharge.
All data were abstracted from the electronic medical record and stored in Redcap. SPSS 21.0 were used for all analysis. Descriptive statistics were performed to determine measures of central tendency and distributions of data. Descriptive statistics included means, standard deviations, medians, and ranges for continuous variables and counts and percentages for categorical variables. Tests for normality were performed to ensure normal distribution of key data elements. Pearson's correlation coefficients were performed to determine relationship between ONSD values and ICP values. ICP values were then categorized into a binary endpoint (ICP ≥20; ICP <20) and summarized in a 2 × 2 cross tabulation using thresholds for ONSD values. Positive predictive and negative predictive values were calculated to determine sensitivity and specificity. Area under the curve (AUC) were calculated using receiver operating characteristics (ROC) curves to determine predictive ability of ONSD measurements on study outcomes. Multiple regression models were created to evaluate predictive ability of ONSD measurements on outcome at hospital discharge when controlling for confounding variables.
Data Availability
Anonymized data not published within this article can be made available by request from any qualified investigator.
Results
There were originally 52 subjects meeting inclusion criteria; however, one subject was excluded because of orbital trauma and 3 were excluded because the ONSD being unmeasurable. Complete data were available and recorded for 48 patients during the 12-month study period. The primary diagnosis type among the study sample included TBI (n = 16, 33%), aneurysmal subarachnoid hemorrhage (n = 14, 29%), intracranial hemorrhage (n = 9, 18%), cranial mass (n = 3, 6%), and other (n = 6, 12%). Table 1 displays demographic data for the study sample. The mean age was 52.0 years (SD 15.78, range 20–81), and mean GCS on admission was 7.85 (SD 4.90, range 3–20).
Table 1.
Demographic Characteristics of the Study Sample
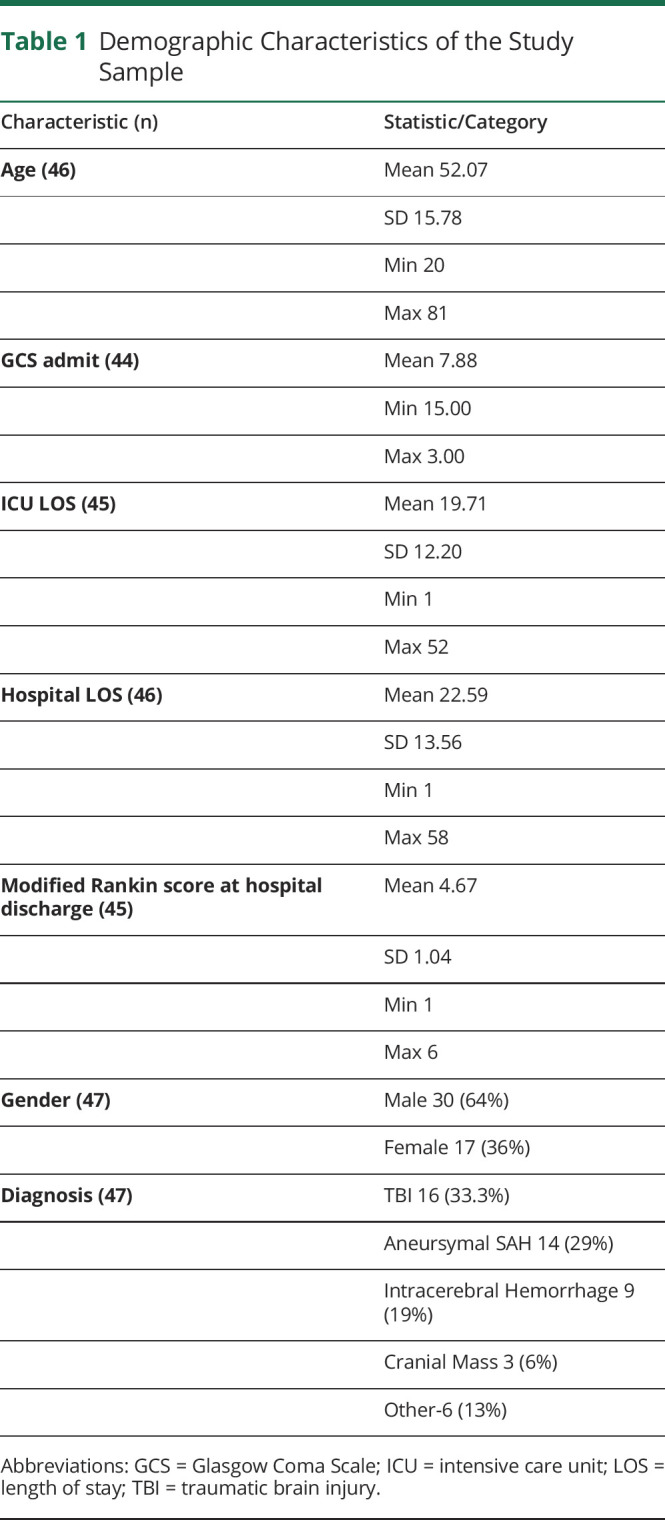
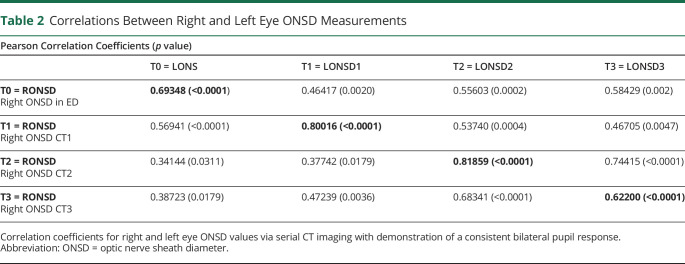
Table 2 displays the correlation coefficients for right eye and left eye ONSD values via serial CT imaging across all time points (where T0 = emergency department admission CT scan, T1 = first inpatient CT Scan within ±24 hours, T2 = second inpatient CT scan, and T3 = third inpatient CT scan). The timing of T2 and T3 scans was variable across the study sample but occurred within days 2–7 of admission. There was a strong, positive correlation between right/left ONSD values across all time points (r = 0.69–0.82, p < 0.001), suggesting a consistent bilateral response.
Table 2.
Correlations Between Right and Left Eye ONSD Measurements
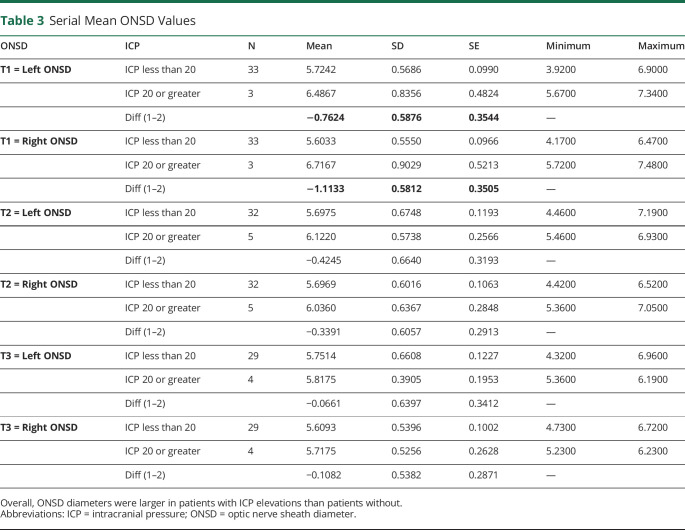
When examining the relationship between ONSD measurements and ICP at each time point, correlations were strongest between values for the initial inpatient CT scan (T1) ONSD readings and ICP (r = 0.54, p = 0.002), but the strength of these correlations decreased throughout the inpatient stay with subsequent CT scans (T2 correlation r = 0.54, T3 correlation r = 0.16, and T4 correlation r = 0.23). Among patients who experienced increased ICP (i.e., ICP ≥ 20 mm Hg), the ONSD values at all time points (T0–T3) were higher when compared with patients with no increases in ICP (range 5.7 mm–6.4 mm, p = 0.05) (table 3).
Table 3.
Serial Mean ONSD Values
ROC curves were calculated to determine the predictive value of ONSD for increases in ICP and patient mortality and functional status at hospital discharge. For evaluating predictive ability on ICP, the dependent variable was ICP (≥20 mm Hg vs <20 mm Hg), and predictors were serial ONSD measurements. To account for the correlation between a patient's repeated ICP and ONSD measurements, the model also included patient-level random effects. Overall, the AUC was 0.67, with a cutoff of 5.7 mm for ONSD ability to discriminate elevated ICP (≥20 vs <20 mm Hg) (95% confidence interval [CI] 0.56–0.78) with 71% sensitivity and 56% specificity (figure 1).
Figure 1. ONSD and ICP Value ROC.
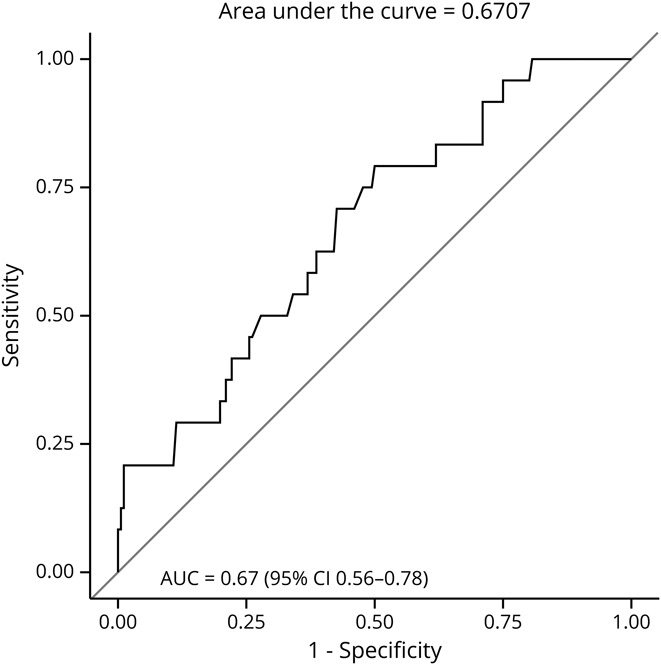
ROC curve demonstrating diagnostic ability of ONSD readings for ICP values. ICP = intracranial pressure; ONSD = optic nerve sheath diameter; ROC = receiver operating characteristic.
To evaluate the predictive ability of ONSD values and patient outcome at discharge, ROC curves were established first for mortality at hospital discharge. The AUC for T2 ONSD values were the strongest predictor of mortality with AUC = 0.91 (95% CI 0.84–0.98), with a cutoff value of 6.3 mm with 30% sensitivity and 80% specificity (figure 2). ROC curves were then calculated to evaluate predictive ability of ONSD with functional outcome at hospital discharge, as measured by dichotomized modified Rankin scores, where scores 4–5 indicated poor outcome and scores 0–3 indicated good outcome. In this model, the AUC for T2 ONSD measurements were again the strongest predictor, with AUC = 0.61 (95% CI 0.48–0.73), and the cutoff point at 5.1 mm with 95% sensitivity and 18% specificity.
Figure 2. ONSD and Mortality ROC.
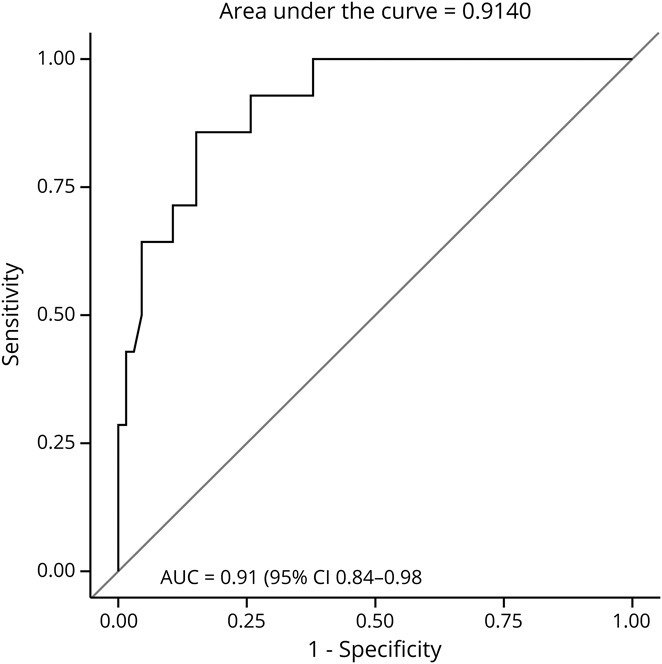
ROC curve demonstrating diagnostic ability of ONSD readings for mortality at hospital discharge. ONSD = optic nerve sheath diameter; ROC = receiver operating characteristic.
A multiple logistic regression model was constructed to further examine the influence of ONSD on discharge outcomes (mortality and functional outcome) while controlling for covariates (age, GCS score, and ICP value). Odds ratios and their 95% CIs were calculated. The significance of regression coefficients was tested using the Wald χ2 test. ONSD values at T2 were again predictive of mortality with a cutoff point of 6.3 mm (point estimate = 17.56, 95% CI = 3.69–83.55, p = 0.003). However, T2 ONSD values were less strong when predicting functional outcome (point estimate = 3.38, 95% CI = 0.58–19.6, p = 0.17).
Discussion
Findings from this study add to the growing body of literature on the relationship between ONSD obtained via CT imaging and invasive measures of ICP monitoring and patient outcomes. Previous studies evaluating correlations between CT ONSD values and invasive ICP monitoring have reported modest to strong correlations (r = 0.32–0.744–7). However, previous studies used cross-sectional designs, evaluating a single ONSD measurement from CT with ICP values. In addition, study samples were limited to patients with TBI, and time points for CT imaging were not consistently reported. Our study found modest correlations between CT ONSD measurements and ICP values, with strongest correlations occurring with at T1, which is the first inpatient CT scan, performed within 24 hours of hospital admission. Because invasive ICP monitoring was not in place when patients initially presented to the ED, it was not possible to evaluate correlations between admission CT scans in the ED (T0) and ICP values immediately before the scan. However, we did find correlations between the initial inpatient CT scan (T1) and ICP values. These correlations decreased with each subsequent CT scan (T2–3), which may be indicative of effectiveness of therapeutic interventions aimed at decreasing ICP during the hospital stay.
Our study also confirms that patients with increased ICP may experience increased ONSD measurements on CT imaging, which are present on initial scans (T0) and persist throughout inpatient treatment (T1–3). This finding is consistent among other studies investigating correlations between CT-derived ONSD measurements and ICP values using a cross-sectional, single time point of measurement. Among patients with TBI, Sonmez evaluated admission ED CT scans and reported those with intracranial pathology had higher ONSD readings when compared with healthy controls.8 Similarly, Lim reported that patients with TBI with confirmed intracranial pathology had higher ONSD readings (5.5 compared with 4.7) but did not report at what time point the CT scans were performed.9 Among preoperative patients with TBI \with confirmed intracranial pathology, those with ICP values >20 mm Hg had higher mean ONSD values via CT scans when compared with patients with TBI without elevated ICP (mean ONSD 5.8, 4.9, respectively), but the time from injury to preoperative measurement of ONSD values via CT imaging was not consistent across subjects.6
When examining the ability of CT ONSD scores to predict ICP, our study findings were also consistent with previous reports among patients with TBI using a single CT examination. The AUC for ability of ONSD values to predict increased ICP in previous studies ranged from 0.75 to 0.87,6,7,9 with cutoff values ranging from 5.3 to 6.3.4–7,9 However, these studies did not report specific time points for CT measurement. Our study found that ONSD measurements obtained with T2 CT scans were the strongest predictor of increased ICP. The AUC and sensitivity/specificity in our study for predicting ICP was lower than estimates reported in these previous studies. The heterogeneity of our study population could account for this finding, suggesting that cutoff points may be variable across different populations because previous work centered solely on patients with TBI. The time points for T2 CT scans in our study were variable and determined by clinical course, rather than the study protocol. Therefore, the extent of clinical interventions before the scan may have impacted findings, and identification of specific time points for optimal correlations was not established. Additional research is needed to further investigate ONSD trends across a larger sample and diverse populations and to better elucidate optimal measurement time points across studies.
When evaluating how well ONSD measurements obtained via CT imaging predicted mortality and functional outcome at hospital discharge, measurements obtained at T2 were again the strongest predictor of outcome. The AUC for mortality in our study was higher than previous estimates by Sonmez et al.8 (AUC = 0.91, 0.6, respectively), and cutoff points were lower (7.2 and 6.3 mm, respectively). Unfortunately, no other studies evaluated predictive ability of ONSD measurements obtained via CT imaging for functional outcome at discharge. Our study again found that measurements at T2 held the strongest predictive ability of ONSD readings with functional outcome at hospital discharge.
There is growing interest in the use of noninvasive ICP measurement to evaluate for ICP elevation, particularly the role of sonographic evaluation of ONSD. Multiple studies have demonstrated strong correlation between CT and ultrasound obtained ONSD.9–13 One literature review and meta-analysis compared ICP values via ventriculostomy with ultrasound-obtained ONSD and reported a pooled sensitivity of 90%. It was further suggested that although ONSD would not replace the need for invasive ICP monitoring, it is a valuable screening tool and should be used as a complementary mechanism to determine patients who may benefit from prompt medical management, transfer to higher level of care, or neurosurgical consultation.14 Another blinded observational study at a Level 1 Trauma Center included 27 patients who required ventriculostomy placement and ICP monitoring. ONSD was measured via ultrasound within 24 hours of external ventricular drain placement. ONSD was found to be 83.8% sensitive and 100% specific for diagnosing raised ICP when compared with invasive monitoring when a cutoff of ONSD ≥5.2 mm was used as an equivalent of 20 cm H2O.15 Although these studies contribute to the growing body of literature demonstrating utility of sonographic measurements, not all sites have expertise or equipment readily available to perform sonographic measurement. Evaluation of ONSD via radiographic imaging is less studied but may be a feasible option for ONSD measurement, considering that most sites have CT imaging routinely performed on patients after brain injury. Although ONSD monitoring does not replace the need for invasive monitoring, when used in patients with decreased level of consciousness without clear intracranial pathology, it can provide an objective measurement to guide emergent therapy or request invasive intracranial monitoring.
Limitations to this study include the single site and retrospective study design that limits generalization of findings. Measurements of CT-obtained ONSD values were recorded retrospectively by one study investigator and did not inform treatment decisions nor were they validated by a secondary observer. In addition, data on therapeutic interventions for elevated ICP were not gathered nor was the opening pressure among patients receiving external ventricular drains because this was beyond the scope of the current study aims. Future research investigating impact of treatment modalities on both ICP and ONSD values is warranted because this may inform why T2 scans were strongest predictors and impact of treatments on values. This could be particularly useful in determining the onset and duration of effect of intervention on ONSD in addition to invasive ICP. Additional research is also need to investigate correlations between location and type of lesion (compartmentalized and noncompartmentalized) and ipsilateral ONSD values because we did not address this on our study. Despite these limitations, findings were consistent with previous research of CT-obtained ONSD measurements among other patient populations and contribute to the growing body of literature on potential noninvasive mechanisms for detecting increased ICP.
Examining correlations between ONSD measurements obtained via routine CT scans and increases in ICP may provide preliminary information regarding severity of intracranial pathology or acute neurologic decline in the absence of invasive monitoring. Although invasive monitoring remains the standard for absolute detection of increased ICP, evaluation of indices with routine monitoring can contribute to clinical decision making regarding the need for more invasive monitoring. Routine measurement of ONSD is a cost-effective and low-risk intervention that can inform treatment decisions and potential outcomes at hospital discharge.
TAKE-HOME POINTS
→ ONSD measurement may be a good surrogate for ICP when CT head is available.
→ ONSD can easily and quickly be measured on CT scans.
→ Serial optic nerve sheath can be trended whether via CT scan or sonography.
Appendix. Authors

Study Funding
No targeted funding reported.
Disclosure
The authors report no disclosures relevant to the manuscript. Full disclosure form information provided by the authors is available with the full text of this article at Neurology.org/cp.
References
- 1.Chacko J. Optic nerve sheath diameter: an ultrasonographic window to view raised intracranial pressure? Indian J Crit Care Med 2014;18:707–708. [DOI] [PMC free article] [PubMed] [Google Scholar]
- 2.Wang L, Chen L, Chen C. Ultrasonography assessments of optic nerve sheath diameter as a noninvasive and dynamic method of detecting changes in intracranial pressure. JAMA Ophthalmol 2018;136:250–256. [DOI] [PMC free article] [PubMed] [Google Scholar]
- 3.Helmke K, Hansen HC. Fundamentals of transorbital sonographic evaluation of optic nerve sheath expansion under intracranial hypertension II. Patient study. Pediatr Radiol 1996;26:706–710. [DOI] [PubMed] [Google Scholar]
- 4.Sekhon M, Griesdale D, Robba C, et al. Optic nerve sheath diameter on computed tomography is correlated with simultaneously measured intracranial pressure in patients with severe traumatic brain injury. Intensive Care Med 2014;40:1267–1274. [DOI] [PubMed] [Google Scholar]
- 5.Sekhon MS, McBeth P, Zou J, et al. Association between optic nerve sheath diameter and mortality in patients with severe traumatic brain injury. Neurocrit Care 2014;21:245–252. [DOI] [PubMed] [Google Scholar]
- 6.Lee HC, Lee WJ, Dho YS, Cho W, Kim YH, Park HP. Optic nerve sheath diameter based on preoperative brain computed tomography and intracranial pressure are positively correlate in adults with hydrocephalus. Clin Neurol Neurosurg 2018;167:31–35. [DOI] [PubMed] [Google Scholar]
- 7.Turkin AM, Oshorov AV, Pogosbekyan EL, Smimov AS, Dmitrieva AS. Correlation of intracranial pressure and diameter of the sheath of the optic nerve by computed tomography in severe traumatic brain injury. Zh Vopr Neirokhir Im N N Burdenko 2017;81:81–88. [DOI] [PubMed] [Google Scholar]
- 8.Sonmez BM, Ternel E, Ischani MD, et al. Is initial optic nerve sheath diameter prognostic of specific head injury in emergency departments? J Natl Med Assoc 2019;111:210–217. [DOI] [PubMed] [Google Scholar]
- 9.Lim TK, Yu BC, Ma DS, et al. Correlation between optic nerve sheath diameter measured by computed tomography and elevated intracranial pressure in patients with traumatic brain injury. J Trauma Inj 2017;30:140–144. [Google Scholar]
- 10.Hansen HC, Helmke K. The subarachnoid space surrounding the optic nerves: and ultrasound study of the optic nerve sheath. Surg Radiol Anat 1996;18:323–328. [DOI] [PubMed] [Google Scholar]
- 11.Ohle R, McIsaac SM, Woo MY, Perry JJ. Sonography of the optic nerve sheath diameter for detection of raised intracranial pressure compared to computed tomography: a systematic review and meta-analysis. J Ultrasound Med 2015;34:1285–1294. [DOI] [PubMed] [Google Scholar]
- 12.Kalantari H, Jaiswal R, Bruck I, et al. Correlation of optic nerve sheath diameter measurements by computed tomography and magnetic resonance imaging. Am J Emerg Med 2013;31:1595–1597. [DOI] [PubMed] [Google Scholar]
- 13.Legrand A, Jeanjean P, Delanghe F, Peltier J, Lecat B, Dupont H. Estimation of optic nerve sheath diameter on an initial brain computed tomography scan can contribute prognostic information in traumatic brain injury patients. Crit Care 2013;17:0. [DOI] [PMC free article] [PubMed] [Google Scholar]
- 14.Dubourg J, Javouhey E, Geeraers T, et al. Ultrasonography of optic nerve sheath diameter for detection of raised intracranial pressure: a systematic review and meta-analysis. Intensive Care Med 2011;27:1059. [DOI] [PubMed] [Google Scholar]
- 15.Frumin E, Schlang J, Wiechmann W, et al. Prospective analysis of single operator sonographic optic nerve sheath diameter measurement for diagnosis of elevated intracranial pressure. West J Emerg Med 2014;15:217–220. [DOI] [PMC free article] [PubMed] [Google Scholar]
Associated Data
This section collects any data citations, data availability statements, or supplementary materials included in this article.
Data Availability Statement
Anonymized data not published within this article can be made available by request from any qualified investigator.


