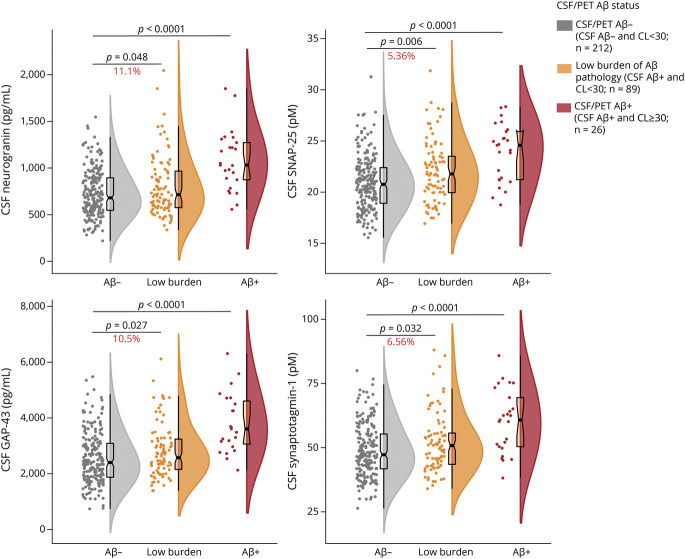
Figure 3. CSF Synaptic Biomarkers by CSF/PET Aβ Status.
Boxplots depicting the median (horizontal bar), interquartile range (IQR; hinges), and 1.5 IQR (whiskers). Group differences were assessed by a 1-way analysis of covariance adjusted by age and sex, followed by Dunnett-corrected post hoc pair-wise comparisons. The percentage of change between the low-burden group and the CSF/PET β-amyloid (Aβ)–negative group is shown. eTable 3 (doi.org/10.5061/dryad.vdncjsxv4) shows the demographics of the 3 groups compared. All p values are corrected for multiple comparisons with the false discovery rate approach. GAP-43 = growth-associated protein-43; SNAP-25 = synaptosomal-associated protein-25.

