Abstract
Introduction:
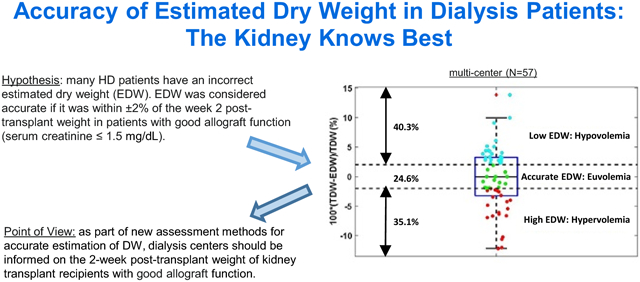
Estimated dry weight is used to guide fluid removal during outpatient hemodialysis sessions. Errors in estimated dry weight can result in intradialytic hypotension and interdialytic fluid overload. The goal of this study was to assess the accuracy of estimated dry weight by comparing it to the two-week post-transplant weight in two cohorts of hemodialysis patients.
Methods:
This observational, multi-center, retrospective cohort study included maintenance hemodialysis patients who underwent kidney transplantation at two medical centers in Massachusetts. The relationship between estimated dry weight pre-transplant and weight at week 2 post-transplant in patients with good allograft function (serum creatinine ≤ 1.5 mg/dL) was analyzed. Estimated dry weight was considered accurate if it was within ±2% of the week 2 post-transplant weight.
Results:
Fifty seven patients with good allograft function were identified: mean age 54±14 years, 32 (58%) from deceased donors, 22 (38.6%) females. 38 were Caucasian (66.7%), 11 Hispanic (19.3%), 3 black (5.3%), and 5 others (8.8%). 2-week mean post transplantation serum creatinine was 1.2±0.2 mg/dL. Mean (SD) estimated dry weight was 71.4±15.9. Before transplantation, only 14 (24.6%) patients were within ±2% of the 2-week post-transplant weight; 23 (40.3%) were above and 20 (35.1%) were below.
Conclusions:
Our point of view, based on the assumption that the weight of patients with good allograft function at 2 weeks post-transplant approaches their accurate dry weight, is that a majority of maintenance hemodialysis patients (75.4%) are hypervolemic or hypovolemic prior to renal transplantation. This highlights the importance of finding novel tools to achieve euvolemia in patients undertaking dialysis. Timely feedback regarding achieved weight 2 weeks post-transplant to treating nephrologists and dialysis centers may be a starting point for assessing accuracy of dry weight.
Keywords: maintenance hemodialysis, dry weight
Graphical Abstract

Introduction
The single most important variable in fluid management during hemodialysis (HD) is dry weight (DW), which is a patient’s ideal weight without any extra fluid in the body (euvolemia). Estimates of DW (EDW) that are incorrect result in hypovolemia or hypervolemia pre- and/or post-HD treatments and can result in increased risk of symptoms, hospitalization, morbidity, and mortality [1].
There is lack of consensus about the definition and assessment of DW in HD patients [1,2]. However, a correct EDW should achieve a series of targeted HD outcomes: optimization of systemic blood pressure (BP), avoidance of intradialytic hypotension, and prevention of peripheral and pulmonary edema. Longer (6-8 hours) or more frequent HD treatments have been shown to achieve better outcomes compared to standard thrice-weekly dialysis [3,4]. However, there is resistance on the part of patients to endure longer and/or more frequent HD, as well as logistical and financial limitations. Therefore, there is a need for studies concerned with achieving more accurate EDW for patients on a schedule of 3 to 4 hr dialysis sessions thrice weekly [5].
Various technologies have been used in attempts to achieve euvolemia and determine dry weight. Continuous monitoring of hematocrit as an indicator of relative blood volume (Crit-Line FMC Waltham, MA) has been used to evaluate change in blood volume due to ultrafiltration and assessment of refilling as a way to establish DW [6]. Other approaches including monitoring inferior vena cava (IVC) filling by ultrasound, use of bioimpedance technology to assess fluid status, and ultrafiltration using sodium modeling with and without biofeedback have been studied with mixed results [7-10].
In kidney transplant patients, serum creatinine (sCr) level of ≤ 1.5 mg/dL is associated with good allograft function, and we assumed that the kidney would be able to excrete a sodium load and bring the patient close to euvolemia. On average, a person with a solitary kidney is considered to have normal single kidney function at sCr of 1.5, also the approximately average value achieved by living donors at one month after nephrectomy [11]. Although imperfect, we felt a sCr of <1.5 on average reflects good function 2 weeks post-transplant, given that these patients are on tacrolimus. Therefore, when this occurs soon following transplantation – up to 2 weeks -- it is reasonable to consider that an accurate DW value lies within a small range of the new body weight. We investigated the hypothesis that many HD patients have incorrect EDW by comparing their pre-transplantation EDW with their weight at week 2 post-transplantation when there is good allograft function.
Methods
We retrospectively collected demographic data for patients who underwent kidney transplantation at Massachusetts General Hospital, Boston, MA during 2016-2017 and at Baystate Medical Center, Springfield, MA during 2018-2020. In addition, we collected most recent hemoglobin (Hgb), EDW, and patient weight from the last outpatient dialysis data record prior to transplantation, and Cr, Hgb, and weight at two weeks post transplantation. The institutional review boards at Baystate Medical Center and Massachusetts General Hospital approved the respective studies including informed consent waivers.
Two assumptions were made: first that a Cr of ≤ 1.5 mg/dL at week 2 post-transplantation indicates good allograft function and second, that changes in the patient weight up to week 2 are strongly associated with fluid volume changes brought about by the functioning allograft. We defined the patient weight at week 2 post-transplant as the “true” dry weight (TDW) or euvolemia. An EDW within a ±2% range of TDW was considered a “sufficiently accurate” estimate. This corresponds to ±1.5 kg in a 75 kg patient. As a sensitivity analysis, we also examined the data using ±3% threshold.
Pre-transplant weights were obtained at the dialysis units using standard floor scales at various times of the day corresponding to the start of the patients’ dialysis shifts. Most post-transplant weights were obtained between 7:45 and 9:00 am using a standing scale at the Transplant Clinics.
We analyzed the Pearson’s correlation between changes in patient weight and hemoconcentration (as estimated by Hgb change) between weeks 1 and 2 post-transplantation. P-values <0.05 were considered to be statistically significant. All analyses were done using Stata/MP 15.1 for Windows (StataCorp LLC, College Station, TX).
Results
All patients were undergoing maintenance in-center HD at different New England centers. 57 patients with good allograft function were identified: mean±SD age 54±14 years, 32 (58%) from deceased donors, 22 (38.6%) females. 38 were Caucasian (66.7%), 11 Hispanic (19.3%), 3 black (5.3%), and 5 others (8.8%). 24 (42.1%) were living donors. 2-week mean post transplantation creatinine was 1.2±0.2 mg/dL. Mean±SD Hgb at weeks 1 and 2 post transplantation were, 10.0±1.5 and 10.2±1.2 g/dL, respectively. Mean±SD of EDW, Last weight before transplantation, and weight at weeks 1 and 2 post transplantation were 71.4±15.9, 72.5±16.1, 72.6±16.2, and 71.4±15.9 kg, respectably.
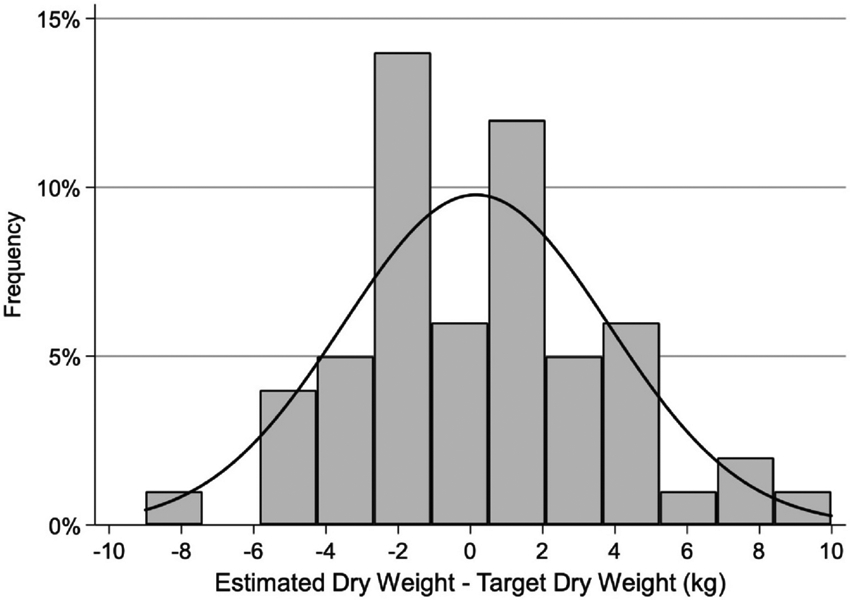
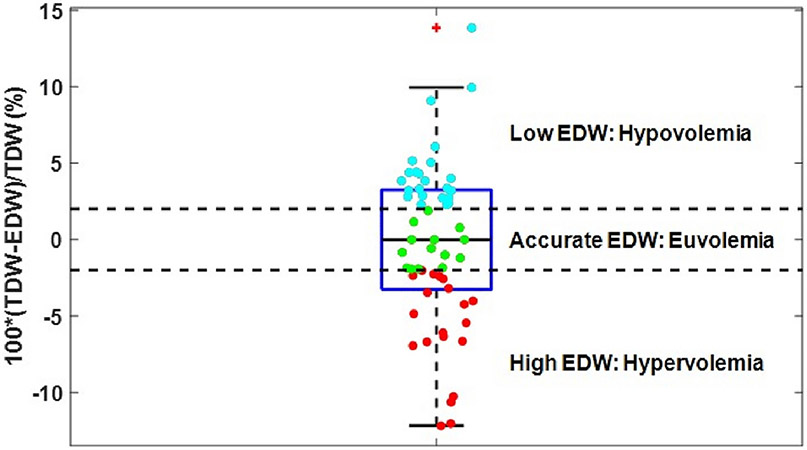
For the entire cohort, the mean weight before transplantation strongly correlated with mean EDW, r= 0.99 (p<0.001). The minimal difference between the means of EDW and TDW (2-week post-transplant weight) does not accurately reflect the large individual differences between EDW and TDW as shown in the histogram in Figure 1. The range of the differences is considerable and the distribution of the range is symmetrical suggesting the error in EDW was equally overestimating as underestimating TDW. Figure 2 shows a boxplot of EDW accurately reflecting TDW vs. those with discordant values. 23 (40.3), 14 (24.6), and 20 (35.1%) of patients had EDW above (hypovolemia), within (euvolemia), and below (hypervolemia) the ±2% range of TDW, respectively.
Figure 1.

Histogram of the difference in kg between estimated dry weight (EDW) and target dry weight (TDW: body weight at week 2 post transplantation). Minimal mean difference belies the large variability of the difference.
Figure 2.
Boxplot of dry weight estimates superimposed over ±2% relative range of TDW. Colored dots represent actual data points (cyan – above range, green – within range, red – below range).
Patient weight changes between weeks 1 and 2 post-transplantation were negatively correlated with hemoconcentration (Hgb changes) in the same period, r=−0.51 (p<0.001). This suggests that post transplantation patient weight changes were mostly due to changes in fluid volume.
Discussion
Our study suggests that a considerable number of HD patients who undertake renal transplantation have an EDW that is clinically different from the weight reached 2 weeks post-transplant, the assumed DW. The prescribed EDW can be incorrect for a number of reasons. Shorter treatment periods preferred by some patients, autonomic dysfunction leading to hypotension, antihypertensive medications, and the fact that “clinical” assessment of DW is flawed can result in EDW being incorrect.
Arguably, many dialysis patients are chronically volume overloaded which contributes to the high incidence of hypertension and may be a factor in the nearly universal incidence of left-ventricular hypertrophy [12]. Only 24.6% of our study group had EDW within a ±2% range of TDW (±1.5 kg in a 75 kg patient), while 35.1% of patients were likely chronically hypovolemic (EDW<TDW), and a significant number (40.3%) were likely chronically hypervolemic pre-transplant (EDW>TDW). An EDW lower than the TDW may contribute to the most common symptom of dialysis, which is post-dialysis fatigue [13]. Notably, even if we expand the target range of DW to ±3% about week 2 weight (±2.25 kg in a 75 kg patient), only 45.6% of the patients have EDW level within the TDW range.
In a study from Mexico of 193 dialysis patients who undertook kidney transplantation, 76 were more than 2 kg above EDW at 1-week post transplantation with serum creatinine of <1.5 mg/dl [14]. In a recent study of 50 HD patients from India using bioimpedance spectroscopy, 30% of patients were categorized as euvolemic, 38% hypovolemic and 32% hypervolemic [9]. Another study of 52 hemodialysis patients who undertook bioimpedance spectroscopy found that 25% were hypervolemic, 23% were hypovolemic and the remainder euvolemic.
Establishing an estimated EDW with a simple algorithm, as in the DRIP study [15], resulted in improved BP control and reduced fluid overload and hospitalizations, but at the expense of increased intra-dialytic symptoms and hypotension. Application of relative blood volume monitoring in the assessment of EDW has had mixed results [16]. In contrast, a single study showed the feasibility of EDW adjustment guided by measurement of the absolute blood volume to reduce intradialytic morbid events [17].
Recently, impedance cardiography technology was validated in a HD setting to provide continuous cardiac parameters and peripheral vascular resistance coupled with total body water assessment [18]. A contemporary study used impedance cardiography to assess individual hemodynamic responses to intradialytic hypotension [19]. Observed hemodynamic responses to ultrafiltration included inadequate vasoconstriction and depressed cardiac response. Hemodynamic monitoring together with assessment of hydration status show promise as ways to individualize DW assessment to decrease intra-dialytic symptoms and hypotension, and achieve an accurate EDW.
While our study has many strengths including the novelty of its design, it also has limitations. First, the assumption that the weight 2 weeks post-transplant reflects the accurate TDW may be incorrect. Patients may lose or gain weight post transplantation related to peri-operative fluid management, oral intake, gain or loss in non-fluid body weight, and diuretic usage. Steroids, often used pre-operatively may affect appetite, protein catabolic rate and influence sodium excretion. However, the both sites have a steroid-free protocol. Weights were obtained pre- and post-transplantation using different scales and at different times of the day, which would affect the absolute values of the weights, and could influence EDW. Immunosuppression medications may increase fluid retention leading to hemodilution and this was not adjusted for in our analysis.
In conclusion, our results suggest that EDW is often inaccurate in maintenance HD patients undertaking kidney transplantation when compared to the weight achieved with good allograft function two weeks post-transplant. It is imperative that new assessment methods for accurate estimation of DW be developed that could improve cardiovascular outcomes in HD patients. As an initial step, we suggest that dialysis centers and treating nephrologists be informed of the 2-week post-transplant weight of kidney transplant recipients with good graft function.
Supplementary Material
Acknowledgements
This work was supported in part by a grant from National Institutes of Health National Institute of Diabetes and Digestive and Kidney Diseases (K25 DK096006 to YC).
Footnotes
Disclosures MG is a consultant to Rockwell Medical, AstraZeneca, Horizon, and OPKO Health. RT is a consultant to Fresenius Medical Care North America, Bayer, Alnylam, Roche Diagnostics, and Thermo Fisher Diagnostics. BG, DW, KC, BN, SH, BC, and YC have nothing to disclose.
Data availability
Study data is available in the supplementary material.
References
- 1.Sinha AD, Agarwal R (2017) Setting the Dry Weight and Its Cardiovascular Implications. Semin Dial. 30(6): 481–488. 10.1111/sdi.12624 [DOI] [PMC free article] [PubMed] [Google Scholar]
- 2.Charra B, Laurent G, Chazot C, Calemard E, Terrat JC, Vanel T, Jean G, Ruffet M (1996) Clinical assessment of dry weight. Nephrol Dial Transplant 11(Suppl. 2): S16–9. 10.1093/ndt/11.supp2.16 [DOI] [PubMed] [Google Scholar]
- 3.Rocco MV, Lockridge RS Jr, Beck GJ, Eggers PW, Gassman JJ, Greene T, Larive B, Christopher T. Chan, Chertow GM, Copland M, Hoy CD, Lindsay RM, Levin NW, Ornt DB, Pierratos A, Pipkin MF, Rajagopalan S, Stokes JB, Unruh ML, Star RA, Kliger AS (2011) The effects of frequent nocturnal home hemodialysis: the Frequent Hemodialysis Network Nocturnal Trial. Kidney Int 80: 1080–1091. 10.1038/ki.2011.213 [DOI] [PMC free article] [PubMed] [Google Scholar]
- 4.Chazot C, Charra B, Laurent G, Didier C, Van CV, Terrat JC, Calemard E, Vanel T, Ruffet M (1995) Interdialysis blood pressure control by long haemodialysis sessions. Nephrol Dial Transplant 10: 831–837. 10.1093/oxfordjournals.ndt.a027292 [DOI] [PubMed] [Google Scholar]
- 5.Weiner DE, Brunelli SM, Hunt A, Schiller B, Glassock R, Maddux FW, Johnson D, Parker T, Nissenson A (2014) Improving clinical outcomes among hemodialysis patients: a proposal for a "volume first" approach from the chief medical officers of US dialysis providers. Am J Kidney Dis 64(5):685–95. 10.1053/j.ajkd.2014.07.003 [DOI] [PubMed] [Google Scholar]
- 6.Reddan DN, Szczech LA, Hasselblad V, Lowrie EG, Lindsay RM, Himmelfarb J, Toto RD, Stivelman J, Winchester JF, Zillman LA, Califf RM, Owen WF Jr (2005) Intradialytic blood volume monitoring in ambulatory hemodialysis patients a randomized trial. J Am Soc Nephrol 16(7): 2162–9. 10.1681/asn.2004121053 [DOI] [PubMed] [Google Scholar]
- 7.Machek P, Jirka T, Moissl U, Chamney P,Wabel P (2010) Guided optimization of fluid status in haemodialysis patients. Nephrol Dial Transplant 25(2): 538–44. 10.1093/ndt/gfp487 [DOI] [PMC free article] [PubMed] [Google Scholar]
- 8.Antlanger M, Josten P, Kammer M, Exner I, Lorenz-Turnheim K, Eigner M, Paul G, Klauser-Braun R, Sunder-Plassmann G, Säemann MD, Hecking M (2017) Blood volume-monitored regulation of ultrafiltration to decrease the dry weight in fluid-overloaded hemodialysis patients: a randomized controlled trial. BMC Nephrol 18(1): 238. 10.1186/s12882-017-0639-x [DOI] [PMC free article] [PubMed] [Google Scholar]
- 9.Patel HV, Annigeri RA, Kowdle PC, Rao BS, Seshadri R, Balasubramanian S, Vadamalai V (2019) Bioimpedance Spectroscopy-Guided Ultrafiltration Normalizes Hydration and Reduces Intradialytic Adverse Events in Hemodialysis Patients. Indian J Nephrol. 29(1): 1–7. 10.4103/ijn.IJN_150_18 [DOI] [PMC free article] [PubMed] [Google Scholar]
- 10.Leung KCW, Quinn RR, Ravani P, Duff H, MacRae JM (2017) Randomized Crossover Trial of Blood Volume Monitoring-Guided Ultrafiltration Biofeedback to Reduce Intradialytic Hypotensive Episodes with Hemodialysis. Clin J Am Soc Nephrol 12(11): 1831–1840. 10.2215/CJN.01030117 [DOI] [PMC free article] [PubMed] [Google Scholar]
- 11.Choi KH, Yang SC, Joo DJ, Kim MS, Kim YS, Kim SI, Han WK (2012) Clinical Assessment of Renal Function Stabilization After Living Donor Nephrectomy. Transplantation Procs 44: 2906–2909. 10.1016/j.transproceed.2012.05.086 [DOI] [PubMed] [Google Scholar]
- 12.Shami AR, Karembelka A, Yabes J, Yao Y, Miskulin D, Gassman J, Ploth D, Negrea L, Paine S, Rahman M, Kwong RY, Zager P, Jhamb M (2018) Association of Intradialytic Hypertension with Left Ventricular Mass in Hypertensive Hemodialysis Patients Enrolled in the Blood Pressure in Dialysis (BID) Study. Blood Press Res 43(3): 882–892. 10.1159/000490336 [DOI] [PMC free article] [PubMed] [Google Scholar]
- 13.Manisha J, Weisbord SD, Steel JL Unruh M (2008) Fatigue in Patients Receiving Maintenance Dialysis: A Review of Definitions, Measures, and Contributing Factors. Am J Kidney Dis 52(2): 353–365. 10.1053/j.ajkd.2008.05.005 [DOI] [PMC free article] [PubMed] [Google Scholar]
- 14.Rivera-González CS, Pérez-Grovas H, Madero M, Mora-Bravo F, Saavedra N, López-Rodriguez J, Lerma C (2013) Identification of Impeding Factors for Dry Weight Achievement in End-Stage Renal Disease After Appropriate Kidney Graft Function. Artificial Organs 38(2): 113–120. 10.1111/aor.12133 [DOI] [PubMed] [Google Scholar]
- 15.Agarwal R, Alborzi P, Satyan S, Light RP (2009) Dry-weight reduction in hypertensive hemodialysis patients (DRIP): a randomized, controlled trial. Hypertension 53(3): 500–7. 10.1161/HYPERTENSIONAHA.108.125674 [DOI] [PMC free article] [PubMed] [Google Scholar]
- 16.Schneditz D, Kron J, Hecking M (2018) Anything Goes? High Time for Smart Blood VolumeMonitors.ASAIO 64(6);697–700. 10.1097/MAT.0000000000000885 [DOI] [PubMed] [Google Scholar]
- 17.Kron S, Schneditz D , Czerny J, Leimbach T, Budde K, Kron J (2018) Adjustment of target weight based on absolute blood volume reduces the frequency of intradialytic morbid events. Hemodial Int 22(2): 254–260. 10.1111/hdi.12582 [DOI] [PubMed] [Google Scholar]
- 18.Germain MJ, Joubert J, O'Grady D, Nathanson BN, Chait Y, Levin NW (2018) Comparison of stroke volume measurements during hemodialysis using bioimpedance cardiographyandechocardiography.HemodialInt 22:201–208. 10.1111/hdi.12589 [DOI] [PMC free article] [PubMed] [Google Scholar]
- 19.Levin NW, de Abreu MHFG, Borges LE, de Abreu MHFG, Borges LE, Filho HAT, Sarwar R, Gupta S, Hafeez T, Lev S, Williams C (2018) Hemodynamic response to fluid removal during hemodialysis: categorization of causes of intradialytic hypotension. Nephrol Dial Transplant 33(9): 1643–1649. 10.1093/ndt/gfy048 [DOI] [PubMed] [Google Scholar]
Associated Data
This section collects any data citations, data availability statements, or supplementary materials included in this article.
Supplementary Materials
Data Availability Statement
Study data is available in the supplementary material.


