Abstract
Objective:
(1) To perform a prospective study using a new set of data to test the validity of a new soft tissue prediction method developed for Class II surgery patients and (2) to propose a better validation method that can be applied to a validation study.
Materials and Methods:
Subjects were composed of two subgroups: training subjects and validation subjects. Eighty Class II surgery patients provided the training data set that was used to build the prediction algorithm. The validation data set of 34 new patients was used for evaluating the prospective performance of the prediction algorithm. The validation was conducted using four validation methods: (1) simple validation and (2) fivefold, (3) 10-fold, and (4) leave-one-out cross-validation (LOO).
Results:
The characteristics between the training and validation subjects did not differ. The multivariate partial least squares regression returned more accurate prediction results than the conventional method did. During the prospective validation, all of the cross-validation methods (fivefold, 10-fold, and LOO) demonstrated fewer prediction errors and more stable results than the simple validation method did. No significant difference was noted among the three cross-validation methods themselves.
Conclusion:
After conducting a prospective study using a new data set, this new prediction method again performed well. In addition, a cross-validation technique may be considered a better option than simple validation when constructing a prediction algorithm.
Keywords: Soft tissue prediction algorithm, Prospective validation, Cross-validation
INTRODUCTION
When it comes to evaluating a new patient for a surgical correction of a severe malocclusion, how accurate are the prediction methods currently available for clinicians? Will the predicted profile for the patient match with the actual future postoperative profile? We understand that characteristics vary among individual human beings. Therefore, doubts about a method's prediction validity are natural for clinicians who are accustomed to encountering individual variations among their patients. Consequently, even though a particular method may have demonstrated reliable predictions within a particular study's selected and established data set, a prospective test of its validity with additional patients and a different data set are still needed to better validate or invalidate its accuracy.
Recently, a new postoperative soft tissue prediction method has been devised.1 This method was based on a multivariate partial least squares regression (PLS) that returned more accurate prediction results than conventional methods. For the validity of this new prediction method to be confirmed, its prediction errors should also be reliable for other types of patients and additional data sets. Therefore, some form of prospective study with a new set of data is needed. Several validation methods have been developed, including simple validation and multiple cross-validation methods.2–6 Choosing the best validation method is an additional challenge when building a prediction algorithm. Proper selection of the validation method is dependent on the characteristics of each data set.
The aim of this present study is twofold: (1) to prospectively test, using a new set of data, the validity of the aforementioned new soft tissue prediction method developed for Class II surgery patients and (2) to propose a better validation method that can be applied to a validation study. Differences among the validation methods and the steps of selecting the method are also discussed.
MATERIALS AND METHODS
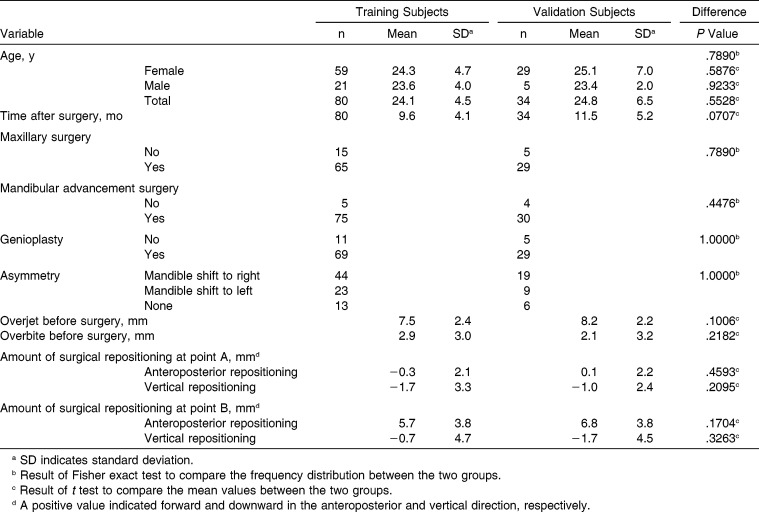
The validity of the prediction method was studied prospectively in 34 consecutive patients who had severe Class II malocclusion and underwent surgical correction. All subjects were composed of two subgroups: the prediction group and the validation group. Lee et al.1 previously suggested a multivariate prediction method for Class II surgery patients. In the study by Lee et al.,1 80 patients provided the training data set that was used to build the prediction algorithm. For this current study, 34 new patients were used to evaluate the prospective performance of the prediction algorithm. No patient included in this study had a cleft lip, cleft palate, an injury, or a severe asymmetry. No medically compromised patients were included. From July 2012 to June 2013, among a total of 53 new Class II surgery patients, 34 were selected as validation subjects according to the aforementioned criteria. The characteristics for both the training subjects and the new validation subjects are shown in Table 1. The institutional review board (IRB) for the protection of human subjects reviewed and approved the research protocol (Seoul National University School of Dentistry, IRB No. S-D20140020 and S-D20140021).
Table 1.
Features of the Training Subjects and the New Validation Subjects
A total of 226 input variables, also called predictor variables, were entered into the prediction equation. The predictor variables included the patient's age, sex, time after surgery, the amount of facial asymmetry, existence of bimaxillary surgery, existence of genioplasty, 78 presurgical skeletal measurements, 64 presurgical soft tissue measurements, and 78 variables with regard to the surgical skeletal repositioning in both the anteroposterior and vertical directions. The output variables, also called response variables, were the soft tissue responses at the 32 soft tissue landmarks, both in x- and y-axes, summing up 64 output variables. The prediction algorithm used in this study was based on the modified PLS method. The detailed PLS algorithm is available in previous publications.1,7
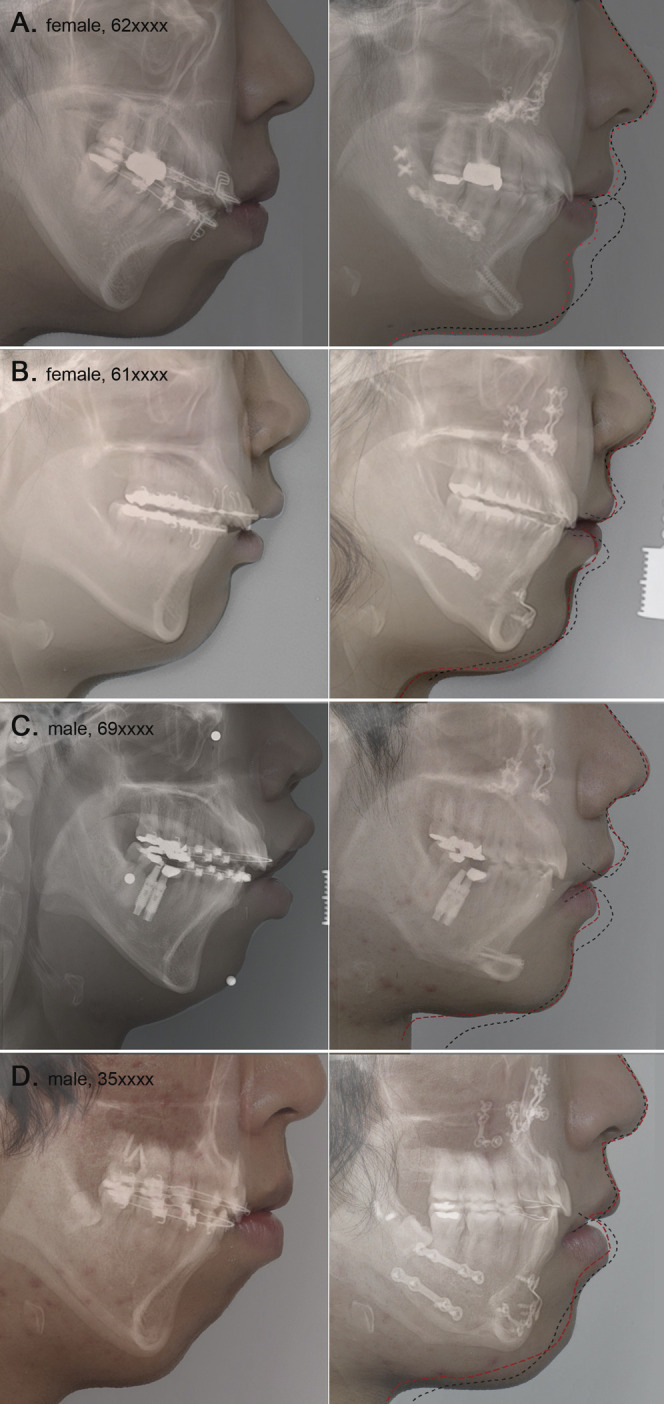
First, we compared real cases graphically to visualize the prediction results between a conventional method and the new method. Figure 1 depicts and compares four profiles: (1) the original profile, (2) the actual postoperative profile, (3) the predicted profile using the PLS algorithm (red dotted line), and (4) the predicted profile (black dashed line) that was produced from a current commercial software program using a conventional method (V-Ceph version 4.3, Osstem, Seoul, Korea). The Bezier spline function was used to connect the soft tissue landmarks to create a profile line with a gentle curving contour.
Figure 1.

A graphic comparison of real cases showing original profiles on the left-hand side and actual postoperative profiles on the right-hand side. In this study, accuracy of the actual resulting soft tissue response is considered to be the measure of prediction quality. Black dashed lines indicate the profile predicted using commercial software that applies a conventional prediction algorithm. Red dotted lines superimpose the predicted profile produced by our prediction method. Although discrepancies between predictions and actual treatment outcomes were evident, the results using our method had a better prediction quality. The red lines seem to have a more natural curvature and a more accurate prediction than the black lines that were produced by the commercial software. In cases of preoperative strained lower lip, lip incompetency, and adjunctive genioplasty, our method showed a significant improvement over the conventional method.
Second, in the training data set from which the PLS algorithm was derived, the training error was calculated as a measure of quality-of-fit of the PLS prediction method. Then, in the validation data set, the validation error was calculated as a measure of actual predictive performance. Prediction errors were defined as the difference between the actual result and the predicted position. Errors were expressed by absolute values to avoid plus and minus errors from canceling each other out.8,9
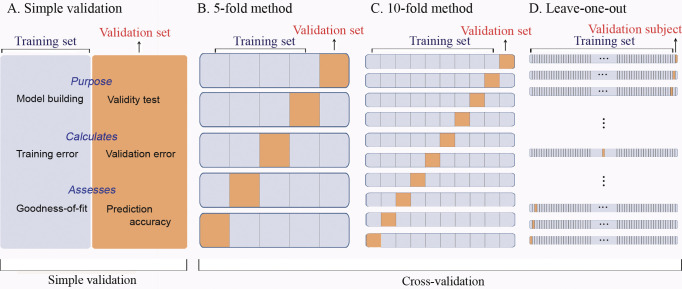
The traditional simple validation method of splitting the subjects into a training group and a separate validation group limits both the subjects available for formulating the prediction equation and its subsequent validation. Using cross-validation techniques in which these data sets are combined, the power of the prediction can be increased. Therefore, four different validation methods were used: (1) simple validation, (2) fivefold cross-validation, (3) 10-fold cross-validation, and (4) leave-one-out cross-validation (LOO). Figure 2 illustrates the validation methods applied in this study. As previously mentioned, simple validation (Figure 2A) uses separate training and validation data sets. In fivefold cross-validation (Figure 2B), the data set is divided into five portions. Each portion serves as a validation data set in each round. In 10-fold cross-validation (Figure 2C), the whole data set has 10 portions for each training and validation trial. In LOO (Figure 2D), the number of subjects for the prediction training group is maximized since every subject minus one serves in the training data set.
Figure 2.
Schematic diagrams illustrating the validation methods applied in this study. Simple validation (A) uses separate training and validation data sets. In fivefold cross-validation (B), the data set is divided into five portions. Each portion serves as a validation data set in each round. In 10-fold cross-validation (C), the whole data set has 10 portions for each training and validation trial. In leave-one-out cross-validation (D), each subject serves as a validation data set.
The free statistics software language R (Vienna, Austria) was used. It runs on a wide variety of UNIX platforms, Windows, and MacOS.10 The authors have no financial interest in any company or any of the products related or cited in this article. The whole data sets (without patient identification information) and detailed algorithms for prediction and validation steps written in language R are open to the public through general public licensure or by request to the authors.
RESULTS
Table 1 compares several features of the study's subjects. None of the investigated variables differ between the training and validation subjects.
With the original profiles on the left-hand side and the actual postoperative profiles on the right-hand side, Figure 1 illustrates a graphic comparison of several patients. Black dashed lines indicate the predicted profile from a conventional prediction algorithm used by the commercial software. Red dotted lines demarcate the superimposed predicted profile from our prediction results. Discrepancies between the predictions and the actual treatment outcomes were evident. However, the predictions using the PLS algorithm resulted in obviously better prediction quality than the conventional method. Furthermore, the PLS produced red lines that also appear to have a more natural curvature than the black lines produced by the commercial software. Especially in cases of a preoperative strained lower lip, considerable lip incompetency, and for adjunctive genioplasty patients, our newer method showed a significant improvement over the conventional method (Figure 1).
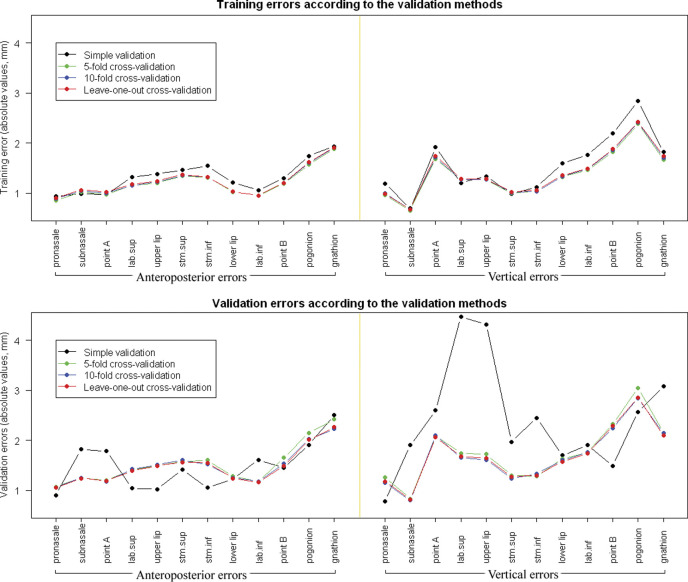
A comparison of the validation errors according to the different validation methods is demonstrated in Figure 3. The soft tissue landmarks we included in Figure 3 were selected to concisely describe the validity and accuracy of the soft tissue prediction algorithm. After applying the prediction algorithm to the validation subjects, the absolute error did not show a significant difference among the three cross-validation methods. However, for several soft tissue responses, the simple validation method showed larger absolute errors in the vertical direction than the cross-validation methods did (Figure 3).
Figure 3.
Training and validation errors in absolute values (mm). (Top) Training errors did not show a statistically significant difference according to the validation methods. (Bottom) In general, validation results produced by three cross-validation methods did not demonstrate a significant difference among them. However, the simple validation showed significantly larger absolute errors than the cross-validation methods did, especially for several soft tissue responses in the vertical direction.
DISCUSSION
The characteristics between the training and validation subjects did not differ. Consistent with previous literature,11,12 the surgical orthodontic patient group was composed of more than three times as many females than males. Also, more patients underwent bimaxillary surgery and adjunctive genioplasty than single jaw surgery. This is reflective of the patients' individual needs, especially in the vertical dimension. Consequently, because it affords the clinician greater control of both jaws and in more than one dimension, the use of bimaxillary surgeries to treat severe malocclusions often renders the results of the surgeries more favorable than a single jaw surgery does.
The definition of a particular presurgical soft tissue landmark may indicate a particular presurgical point, but the postsurgical resulting position of that original point is very unlikely to meet the same definition of the landmark being measured. For example, defining the pogonion landmark as the most anterior position of the chin would identify one particular point. However, because of the vertical effects of orthognathic surgery, if that point were exactly followed during and after surgery, it would become apparent that the previously identified point would likely no longer be the most anterior point of the chin, likely having moved somewhat superiorly or inferiorly. Consequently, a new point would be identified as the pogonion landmark. Thus, methods of testing prediction accuracies that use data comparing the differences in distance from presurgical to postsurgical landmarks are not actually measuring the resulting change of the original point. Perhaps, only a fixed tattoo study can really test a method's accuracy. For obvious ethical concerns, a tattoo study is unlikely.
In this respect, prediction errors at a specific landmark may not be as meaningful as those shown in the line drawings of Figure 1. When calculating prediction errors, if a predicted point was exactly located on the resulting profile line, the prediction was not considered erroneous. Figure 1 depicts the smooth profile curves resulting from the Bezier spline function connecting the soft tissue landmarks. These are multiple piecewise curved lines. A quantifying or a measuring methodology of the difference between the two spline line drawings remains a widely open theoretical question. This issue might not be totally incumbent upon orthodontic professionals but may be a future issue for research in mathematics or statistics.
It is not surprising that the greatest inaccuracy in the soft tissue prediction was the lower lip.13–16 The response of the lower lip in our study of Class II surgeries differed from the surgical response of the lower lip in our prediction study of Class III mandibular setback surgeries. In most Class II cases, we found that the lower lip unravels and rolls upward. It rarely moves in the opposite direction of the surgical movement. There are likely also to be significant decompensating vertical changes in most Class II cases. Although the results of the PLS predictions were not perfect in this study, the improved accuracy over the conventional method seems obvious (Figure 1). The improvement of the PLS method was especially apparent when the subject had a considerable interlabial gap and a genioplasty was performed. This may be due to the two most conspicuous advantages of the PLS prediction method. The internal algorithms of the PLS method are capable of simultaneously taking into account (1) the relationship between sagittal and vertical movements and (2) the neighboring soft tissue responses.1,7
In building and applying a prediction model, robust models are needed to achieve predictions with minimal errors. The relatively new analytical technique of the PLS method seems to have provided a more accurate prediction than conventional methods. The conventional method is based on ordinary least squares (OLS), which has been typical of the algorithms used in commercial computer programs. The OLS method may include a range of techniques, from primitive 1-to-1 ratio statistics and simple regressions, up to a complicated form of multivariate multiple linear regressions. Regardless of the complexity of the OLS method, this heretofore traditional method is effective only when the factors are few in number, variables are not significantly correlated, and the relationship to the responses is well understood.17 The improved prediction qualities resulting from applying the PLS method are derived from its capability of accounting for the complex correlation within and among predictor and response variables. Because of this, the application of the PLS method within scientific image analysis and bioinformatics is gaining popularity.18,19 Orthodontic data sets usually include highly correlated relationships among the teeth, dentition, jaw bone, and soft tissue. Consequently, overreliance on the old conventional method may impede the transition to a more sophisticated prediction method in orthodontics.
While comparing the PLS and OLS prediction methods, we also explored the characteristics of simple traditional validation and several cross-validation methods. Introduced in the early 1930s, the simple validation method was the first type of validation procedure used. It was also referred to as the hold-out validation method.2 To check their true significance, prediction models should ideally be tested on independent data. Training an algorithm and evaluating its predictive performance on the same data yields overly optimistic results. Unfortunately, in most real applications, only limited data sets are available; therefore, the simple validation method should not be used. Testing a prediction algorithm on new data, and not the same data from which it was developed, would be a proper evaluation of its performance. Consequently, the ideas of splitting the limited data set into subgroups and applying cross-validation methods were developed.2,6
In our study, Figure 3 demonstrates that when we tested the prediction methods, the various cross-validation methods produced similar error patterns. The simple validation method showed a relatively less accurate result and a different pattern.
Cross-validation is a widespread strategy because of its simplicity and its apparent universality in statistics. An important question is, which kind of cross-validation should be chosen? The K-fold cross-validation is the most popular cross-validation procedure. It is often reported that the optimal K is between 5 and 10.2,3 The K = 10 method is most commonly used in current statistical packages.20 However, with the advent of high-speed computing technology, a more complex cross-validation calculation is now possible these days, unlike decades ago.
The LOO method is one of the most classical cross-validation procedures. In this method, K equals the number of total subjects. During the LOO cross-validation, each subject serves as a validation data set. Each individual can play a role as a “new data set” without arbitrarily splitting the whole data set. After validation, therefore, the results of the LOO validation method can preserve each subject's information with regard to the prediction error or the individual pattern. This may be one of the most advantageous features of the LOO method. In this respect, the LOO method might be the best validation strategy in a clinical research framework.
CONCLUSIONS
In this prospective study with a new data set of 34 patients, we tested the validity of the soft tissue prediction method developed for Class II surgery patients. The multivariate PLS regression again returned more accurate prediction results than the conventional method did.
This study also set out to propose a better validation method for predicting the soft tissue response to Class II surgery. Based on our findings and for clinical research purposes, we propose that the LOO method may be considered the best validation method when building a prediction algorithm.
ACKNOWLEDGMENTS
The authors thank Dr Michael G. Woods who inspired and motivated this study. This work was partly supported by the Basic Science Research Program (NRF grant No. 2012-0007545) and partly supported by grant No. 02-2014-0003 from the SNUDH Research Fund.
REFERENCES
- 1.Lee HJ, Suh HY, Lee YS, et al. A better statistical method of predicting postsurgery soft tissue response in Class II patients. Angle Orthod. 2014;84:322–328. doi: 10.2319/050313-338.1. [DOI] [PMC free article] [PubMed] [Google Scholar]
- 2.Arlot S, Celisse A. A survey of cross-validation procedures for model selection. Stat Surveys. 2010;4:40–79. [Google Scholar]
- 3.Hastie T, Tibshirani R, Friedman J. The Elements of Statistical Learning Data Mining Inference and Prediction 2nd ed. New York, NY: Springer Verlag; 2009. [Google Scholar]
- 4.Shao J. Linear-model selection by cross-validation. J Am Stat Assoc. 1993;88:486–494. [Google Scholar]
- 5.Stone M. Cross-validatory choice and assessment of statistical predictions. J R Stat Soc B Stat Methodol. 1974;36:111–147. [Google Scholar]
- 6.Stone M, Brooks RJ. Continuum regression–cross-validated sequentially constructed prediction embracing ordinary least-squares, partial least-squares and principal components regression. J R Stat Soc B Met. 1990;52:237–269. [Google Scholar]
- 7.Suh HY, Lee SJ, Lee YS, et al. A more accurate method of predicting soft tissue changes after mandibular setback surgery. J Oral Maxillofac Surg. 2012;70:e553–e562. doi: 10.1016/j.joms.2012.06.187. [DOI] [PubMed] [Google Scholar]
- 8.Donatelli RE, Lee SJ. How to report reliability in orthodontic research: part 1. Am J Orthod Dentofacial Orthop. 2013;144:156–161. doi: 10.1016/j.ajodo.2013.03.014. [DOI] [PubMed] [Google Scholar]
- 9.Donatelli RE, Lee SJ. How to report reliability in orthodontic research: part 2. Am J Orthod Dentofacial Orthop. 2013;144:315–318. doi: 10.1016/j.ajodo.2013.03.023. [DOI] [PubMed] [Google Scholar]
- 10.R Development Core Team. R A Language and Environment for Statistical Computing. Vienna, Austria: R Foundation for Statistical Computing; 2014. [Google Scholar]
- 11.Burden D, Johnston C, Kennedy D, Harradine N, Stevenson M. A cephalometric study of Class II malocclusions treated with mandibular surgery. Am J Orthod Dentofacial Orthop. 2007;131:7e1–8. doi: 10.1016/j.ajodo.2006.05.027. [DOI] [PubMed] [Google Scholar]
- 12.Jung MH. Age, extraction rate and jaw surgery rate in Korean orthodontic clinics and small dental hospitals. Korean J Orthod. 2012;42:80–86. doi: 10.4041/kjod.2012.42.2.80. [DOI] [PMC free article] [PubMed] [Google Scholar]
- 13.Kaipatur NR, Flores-Mir C. Accuracy of computer programs in predicting orthognathic surgery soft tissue response. J Oral Maxillofac Surg. 2009;67:751–759. doi: 10.1016/j.joms.2008.11.006. [DOI] [PubMed] [Google Scholar]
- 14.Mobarak KA, Krogstad O, Espeland L, Lyberg T. Factors influencing the predictability of soft tissue profile changes following mandibular setback surgery. Angle Orthod. 2001;71:216–227. doi: 10.1043/0003-3219(2001)071<0216:FITPOS>2.0.CO;2. [DOI] [PubMed] [Google Scholar]
- 15.Sameshima GT, Kawakami RK, Kaminishi RM, Sinclair PM. Predicting soft tissue changes in maxillary impaction surgery: a comparison of two video imaging systems. Angle Orthod. 1997;67:347–354. doi: 10.1043/0003-3219(1997)067<0347:PSTCIM>2.3.CO;2. [DOI] [PubMed] [Google Scholar]
- 16.Yu YH, Kim YJ, Lee DY, Lim YK. The predictability of dentoskeletal factors for soft-tissue chin strain during lip closure. Korean J Orthod. 2013;43:279–287. doi: 10.4041/kjod.2013.43.6.279. [DOI] [PMC free article] [PubMed] [Google Scholar]
- 17.Tobias RD. An Introduction to Partial Least Squares TS509. Cary, NC: SAS Institute Inc; 2006. [Google Scholar]
- 18.Krishnan A, Williams LJ, McIntosh AR, Abdi H. Partial least squares (PLS) methods for neuroimaging: a tutorial and review. Neuroimage. 2011;56:455–475. doi: 10.1016/j.neuroimage.2010.07.034. [DOI] [PubMed] [Google Scholar]
- 19.Wehrens R. Chemometric With R Multivariate Data Analysis in the Natural Sciences and Life Sciences 1st ed. Heidelberg, Germany: Springer; 2011. [Google Scholar]
- 20.McLachlan GJ, Do KA, Ambroise C. Analyzing Microarray Gene Expression Data. Hoboken, NJ, USA: Wiley-Interscience; 2004. [Google Scholar]


