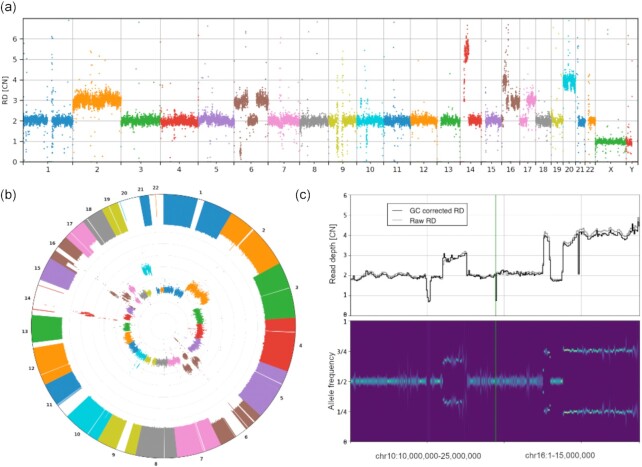
Figure 4:
Novel features of visualization using data for HepG2 cell line. Genome-wide visualizations can be useful in some cases, including cancer studies and clinical applications such as screening for chromosomal abnormalities. They also can be useful for quick insight in sequencing or single-cell amplification quality. To demonstrate genome-wide plot types, HapG2 immortal cell line sample is used. (a) Manhattan and (b) circular style plot of RD signal. Large CNVs and chromosome copy number changes are apparent. One can also judge the dispersion of the RD signal. The inner circle in (b) shows RD signal while the outer one shows minor allele frequency (MAF). Regions where we can see loss of MAF signal with normal RD, e.g., chromosome 14 or 22, are chromosomal CNN-LOH. (c) Examples of smaller CNVs not apparent in the global view. Each CNV is ∼15 Mb. The displayed regions with multiple CNVs (that are possibly complex events) were hardly visible on the circular plot.

