Abstract
Objective:
To examine the effects of a soft diet and a low-calcium diet on the craniofacial growth and bone architectures of the maxilla and mandible.
Materials and Methods:
Male rats (n = 20, 3 weeks old) were divided into four groups. Ten rats were given a normal-calcium diet, and the other rats were given a low-calcium diet. Each group was then divided into two subgroups, which were fed a hard or a soft diet. After 4 weeks, craniofacial growth and architecture in maxillary and mandibular bone were analyzed using cephalometry, micro-computed tomography, and histopathology.
Results:
The low-calcium diet had no effect on serum calcium levels. The low-calcium diet had the greatest effect on craniofacial bone growth, while the soft diet affected the growth of several bone sites that are attached to the masseter muscle. A low-calcium diet resulted in the deterioration of the connectivity of the trabeculae in the furcation region of the maxillary and mandibular first molar, while a soft diet resulted in the diffuse disappearance of trabeculae in the central part of the furcation regions. In the midpalatal suture, a low-calcium diet resulted in inhibition of cartilaginous ossification, although the midpalatal suture had a normal cartilaginous structure. A soft diet resulted in narrower cartilage cell layers in the midpalatal suture.
Conclusions:
We demonstrated that a low-calcium diet and a soft diet resulted in a deterioration of bone structures in both the maxilla and in the mandible; however, the mechanisms underlying these effects differed between diets.
Keywords: Low-calcium diet, Soft diet, Alveolar bone, Midpalatal suture, Micro-CT
INTRODUCTION
Over recent decades, the eating habits of children and adolescents have undergone many changes due to diversification of lifestyles.1,2 Yanagisawa et al.2 reported that masticatory frequencies and eating times have decreased because of the appearance of soft modern foods, such as processed foods, that can be swallowed and digested quickly. Several animal studies have shown that a reduction in masticatory function inhibits the linear growth of the craniofacial bones and, in particular, that of the mandible.3,4 Thus, clinicians are concerned about an increasing number of children in whom malocclusion and malalignment could develop because of a “soft” diet. However, there is little evidence on this, and the details of the jawbone structures potentially affected by a soft diet remain unidentified.
In Japan, the National Health and Nutrition Survey reported that the mean calcium intakes of infant and pubertal males were 439 and 550 mg/d in 2012,5 compared with the estimated average requirements of 500 and 650 mg/d, respectively.6 Thus, we hypothesized that these individuals may have problems with jawbone health. It is known that an adequate calcium intake during growth is necessary for increased bone mass and the prevention of bone fractures.7 However, the changes in bone architectures, including the pathogenic mechanisms of the maxilla and mandible, affected by a low-calcium diet during growth have not been determined. In the present study, we investigated the effects of a low-calcium diet and a soft diet, as well as their interaction, on craniofacial growth and the bone architecture of the maxilla and mandible.
MATERIALS AND METHODS
Animal Care
Twenty 3-week-old male rats were purchased from Charles River Japan (Kanagawa, Japan). The animals were housed individually under a 12-hour/12-hour light-dark cycle, at a constant temperature of 22 ± 1°C and humidity of 50 ± 5%. The rats were divided randomly into four groups (n = 5 each). Ten rats were given a normal calcium diet containing 510 mg/100 g calcium (AIN-93G),8 and the other rats were given a low-calcium diet containing 144 mg/100 g calcium.9 Moreover, they were divided into two subgroups given a hard or a soft diet. “Hard” diet groups were given the diet in pellet form, while the “soft” diet groups were given powders. All diets were purchased from Oriental Yeast Co (Tokyo, Japan). Rats had ad libitum access to food and tap water throughout the study. Body weight was recorded every week. After 4 weeks, all rats were euthanized using pentobarbital sodium, and the maxillae and mandibles were harvested and cleaned of adherent tissue. All animal procedures were approved by the Committee for Care and Use of Laboratory Animals of Kyushu Dental University (13-020).
Serum Analyses
Blood was obtained from rats under anesthesia. Serum was isolated by centrifugation (3000 rpm, 15 min) and stored at −80°C. Serum calcium and phosphorus levels were quantified using routine laboratory methods (Nagahama Life Science Laboratory, Shiga, Japan).
Cephalometric Analyses
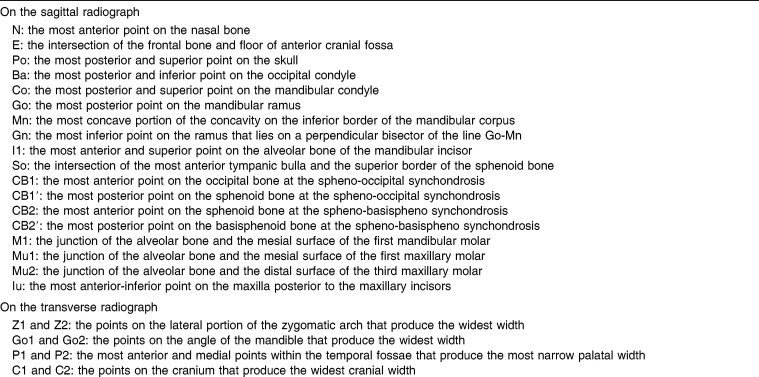
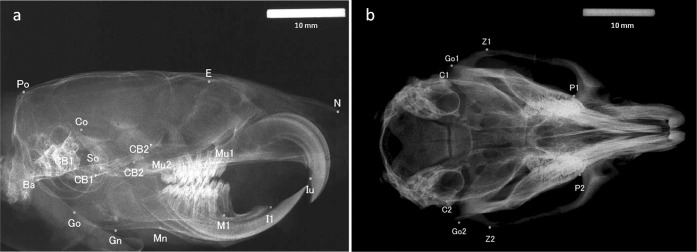
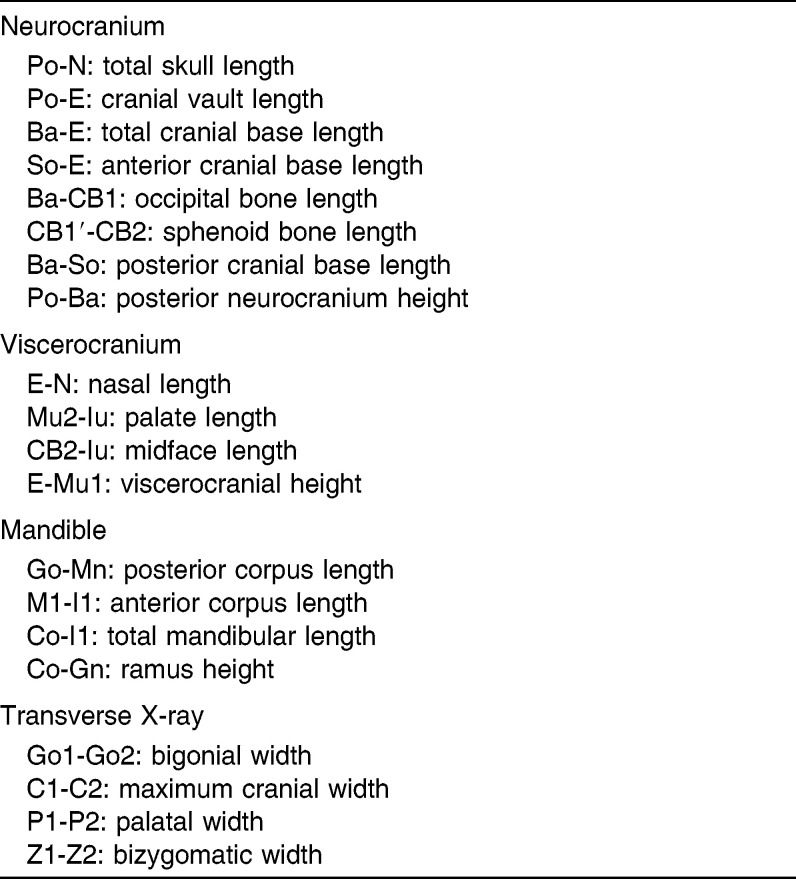
In all groups, craniofacial growth was evaluated by lateral and dorsoventral cephalometric radiographs using a soft X-ray machine (SOFTEX ESM-2, SOFTEX Co Ltd, Tokyo, Japan) at 28 kVp, 6 mA, 30 seconds exposure, and a focus-to-film (New Instant Film, Hanshin Technical Lab, Ltd, Nishinomiya, Japan) distance of 60 cm.10,11 A 10-mm steel calibration rod was used as an index of length, established on the film with the jawbone, and photographed. The cephalometric landmarks (Table 1; Figure 1a,b) were derived from previous studies on rodents.10–13 Using imaging software (ImageJ, available from the National Institutes of Health Web site), the 26 cephalometric landmarks were digitized. Selected linear measurements were then obtained (Table 2).
Table 1.
Definitions of Radiographic Points
Figure 1.
Cephalometric landmarks on radiographs. (a) Sagittal. (b) Transverse.
Table 2.
Measurements of Craniofacial Skeleton
Micro–Computed Tomography
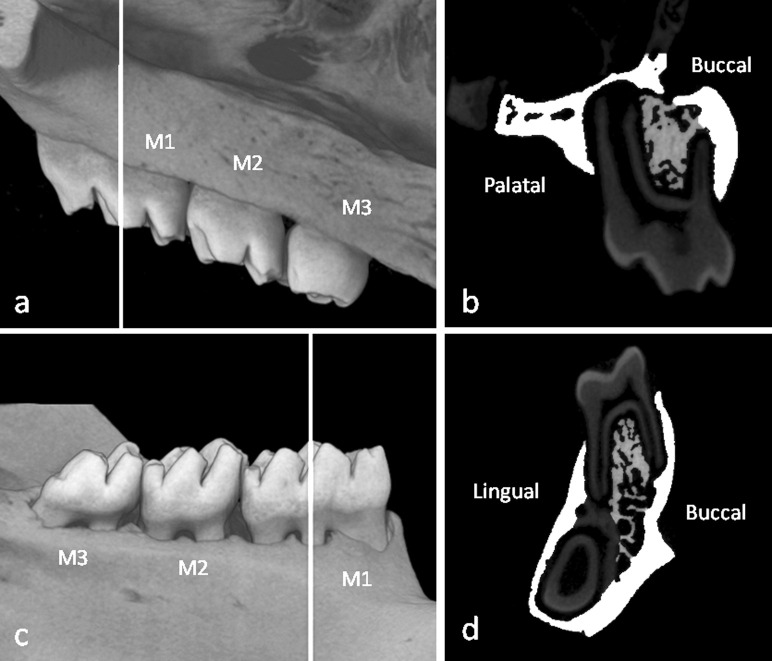
A Scan Xmate-L090 (Comscantecno Co, Kanagawa, Japan) micro–computed tomography (micro-CT) instrument was used to prepare representative left maxilla and mandible images in all rats. The measurement sites were selected as a buccal-lingual cross-slice of the first maxillary molar region that connected the centers of the intermediate buccal root and the mesial-palatine root, including the midpalatal suture (Figure 2a). For the mandibles, the measurement sites were selected as a buccal-lingual cross-slice of the first mandibular molar region that connected the centers of the intermediate buccal root and the intermediate lingual root (Figure 2c). Samples were scanned at 10-µm resolution, and the total tissue area in the alveolar bone except for cortical bone region was defined as total tissue volume (TV; mm2) manually. To distinguish cortical bone and bone marrow in the analysis, the adaptive threshold was adjusted in the three-dimensional image analysis TRI/3D-BON software (Ratoc System Engineering, Tokyo, Japan). Trabecular bone volume (BV; mm2) was also defined by adjusting the adaptive threshold in the TRI/3D-BON software and removing dental roots and bone marrow areas from TV (Figure 2b,d). The trabecular bone volume fraction (BV/TV, %), trabecular thickness (Tb.Th, µm), trabecular number (Tb.N, 1/mm), and trabecular separation (Tb.Sp, µm) were calculated. Regarding the cortical bone, cortical bone area (Ct.Ar, mm2) and marrow area (Ma.Ar, mm2) were measured directly. The total cross-sectional area inside the periosteal envelope (Tt.Ar = Ct.Ar + Ma.Ar, mm2), cortical bone area fraction (Ct.Ar/Tt.Ar, %) and average cortical thickness (Ct.Th, µm) were also calculated.14
Figure 2.
Three-dimensional micro–computed tomography images of the upper and lower first molar regions. White lines indicate the portions of the images used for the analysis of the maxillary and mandibular first molars (a, c). The white areas indicate the cortical bone areas, and the gray areas indicate trabecular bone areas (b, d). M1 indicates the first molar; M2, the second molar; M3, the third molar.
Histology
After micro-CT analysis, maxillae and mandibles were fixed in 10% neutral-buffered formalin, decalcified for 3 weeks with 10% EDTA (pH 7.4), dehydrated with increasing concentrations of ethanol, and embedded in paraffin wax. Paraffin wax blocks sections were cut into frontal sections 3-µm thick. These sections were stained with hematoxylin and eosin. Images were obtained using an Eclipse E200 microscope camera system (Nikon, Tokyo, Japan).
Method Error
To ensure the reproducibility of the measurements, the data were digitized twice at an interval of 2 weeks. Two measures were replicated to assess method error.15 Two replicated cases have been described as the number required to acquire an estimate of method error. Random error was calculated according to Dahlberg's formula16:
where Se is the standard deviation, d is the difference between pairs of replicate measurements, and n is the number of cases. The range of error variance of cephalometric measurements was 0.01–0.05 mm. The error variances of the micro-CT analysis values were between 0.002 and 0.062 mm2 (TV, BV, Ct.Ar, and Ma.Ar) and 4.3 µm (Ct.Th).
Statistical Analysis
All data are presented as means and standard deviations. A two-way analysis of variance was used to investigate the main effects of both experimental factors (low-calcium diet and soft diet) as well as any interaction. A result was considered statistically significant at P < .05.
RESULTS
Body Weight and Serum Calcium and Phosphorus Levels
At the end of the experiment, the low-calcium diet had affected body weight gain significantly (Table 3). The low-calcium diet resulted in significantly higher levels of serum phosphorus (Table 3).
Table 3.
Main Effects and Interactions of Low-Calcium and Soft Diet on Body Weight and Serum Parametersa
Cephalometric Evaluations of the Craniofacial Skeleton
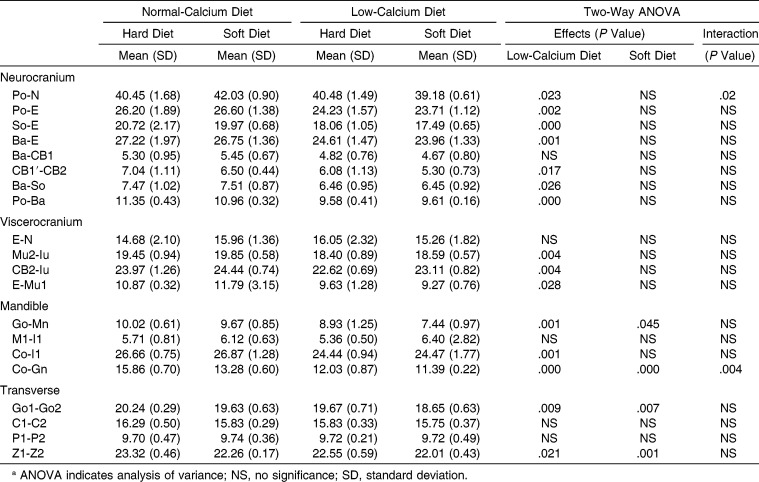
The low-calcium diet affected significantly all values measured, with the exception of occipital bone length (Ba-CB1), nasal length (E-N), anterior corpus length (Ml-Il), maximum cranial width (C1-C2), and palatal width (P1-P2; Table 4). The soft diet affected posterior corpus length (Go-Mn), ramus height (Co-Gn), bigonial width (Go1-Go2), and bizygomatic width (Z1-Z2) significantly. A significant interaction and synergistic effect between a low-calcium diet and a soft diet was found to affect Co-Gn (Table 4).
Table 4.
Main Effects and Interaction of Low-Calcium Diet and Soft Diet on Cephalometric Parametersa
Micro-Tomographic Histomorphometry
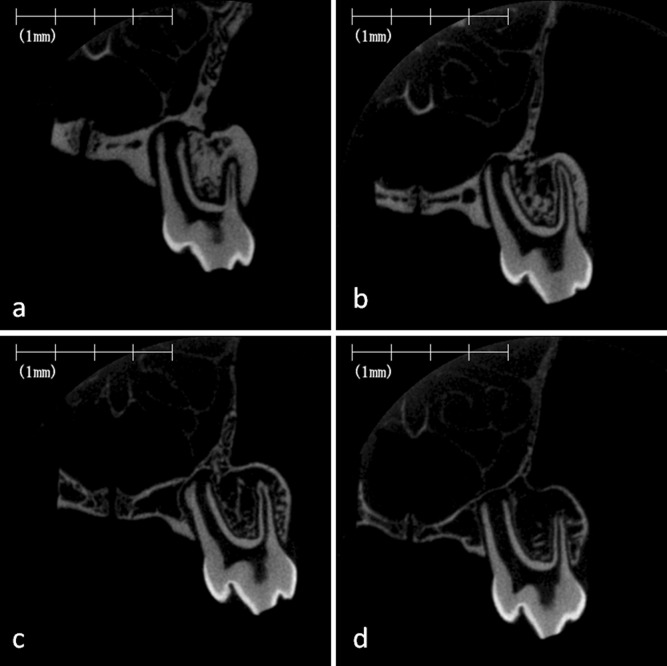
In the cortical bone of the maxilla, the low-calcium diet and the soft diet affected Ct.Ar/Tt.Ar and Ct.Th significantly. A significant interaction and synergistic effect between the low-calcium diet and the soft diet were found to affect those parameters (Table 5; Figure 3). In trabecular bone, the low-calcium diet resulted in a significant deterioration of BV/TV, Tb.Th, and Tb.Sp. The soft diet significantly worsened all measured parameters. A significant interaction was found between the low-calcium diet and the soft diet concerning Tb.N and Tb.Sp; the low-calcium diet led to a deterioration of Tb.N only in those fed the soft diet, and a synergistic effect was found between a low-calcium diet and a soft diet with regard to Tb.Sp (Table 5; Figure 3).
Table 5.
Main Effects and Interaction of Low-Calcium and Soft Diet on Maxillary Alveolar and Palatal Bones Micro-CT Histomorphometric Parametersa
Figure 3.
Micro–computed tomography images of rat maxillary alveolar bone and hard plate. Representative images of frontal cross-section of the hard plate in the maxillary first molar region of the rat fed on the normal-calcium (a, hard; b, soft) and low-calcium (c, hard; d, soft) diets.
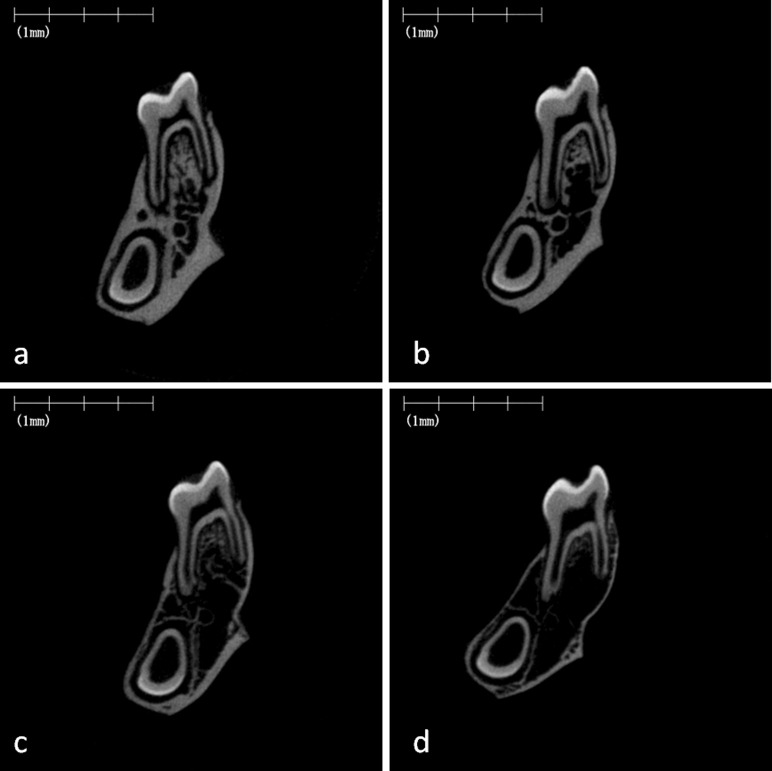
In the cortical bone of the mandible, the low-calcium diet and the soft diet affected Ct.Ar/Tt.Ar and Ct.Th significantly (Table 6; Figure 4). In trabecular bone, the low-calcium diet and the soft diet resulted in significant deterioration in all values measured. A significant interaction and synergistic effect were found between the low-calcium diet and the soft diet for Tb.Th, Tb.N, and Tb.Sp (Table 6; Figure 4).
Table 6.
Main Effects and Interaction of Low-Calcium and Soft Diet on Mandibular Alveolar Bone Micro-CT Histomorphometric Parameters
Figure 4.
Micro–computed tomography images of rat mandibular alveolar bone. Representative images of the frontal cross-section of the furcation region of the mandibular first molar in the rat fed on the normal-calcium (a, hard; b, soft) and low-calcium (c, hard; d, soft) diets.
Histological Evaluation
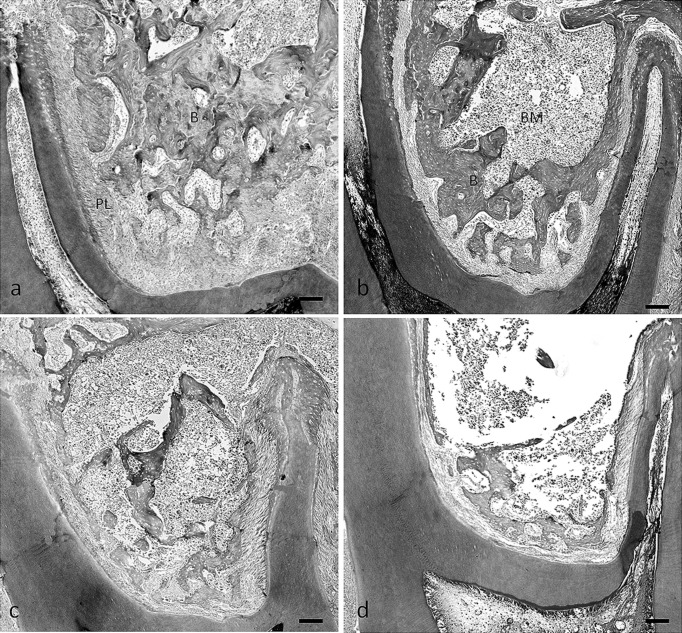
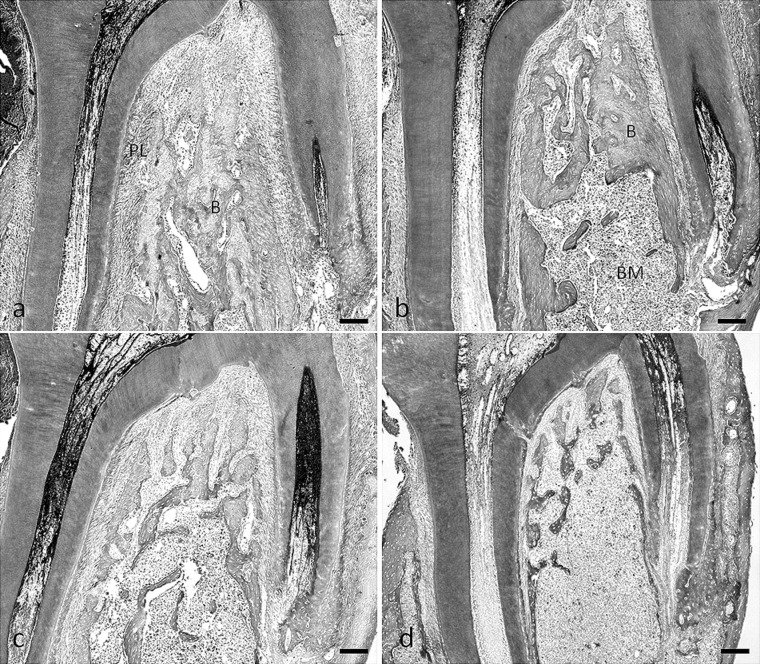
Thinning of the bony trabeculae, with obvious enlargement of the marrow cavities and a deterioration of architecture of trabecular bone, was seen in rats fed the low-calcium diet and the soft diet (Figure 5b–d). Sections of the bones from rats fed the normal calcium and soft diet exhibited a diffuse disappearance of trabeculae, especially in the central part of the furcation tissue area of the maxillary first molar. Trabeculae that attached to the periodontal ligament remained (Figure 5b). However, we found that the low-calcium diet resulted in a loss of trabecular bone volume in the total tissue area of the furcation region (Figure 5c). The patterns of trabecular bone loss due to the low-calcium diet and the soft diet in the mandible were very similar to those in the maxilla (Figures 6a–d).
Figure 5.
Photomicrographs of tissue stained with hematoxylin and eosin, illustrating the furcation region of the maxillary first molar in rats fed the normal-calcium (a, hard; b, soft) and low-calcium (c, hard; d, soft) diets. B indicates bone; BM, bone marrow; PL, periodontal ligament area. Bar = 100 µm.
Figure 6.
Photomicrographs of tissue stained with hematoxylin and eosin illustrating the furcation region of the mandibular first molar in the rats fed the normal-calcium (a, hard; b, soft) and low-calcium (c, hard; d, soft) diets. B indicates bone; BM, bone marrow; PL, periodontal ligament area. Bar = 100 µm.
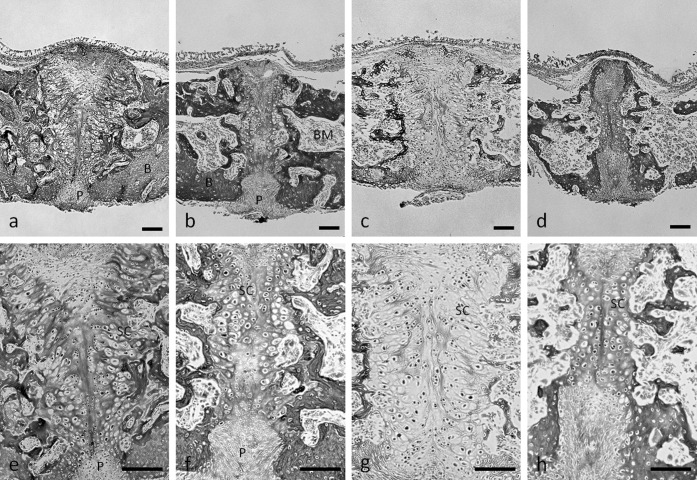
In the central area between the two cartilaginous tissues, precartilaginous cells were arranged along the midline suture in part of all sections (Figure 7). In the sections of the rats fed the hard diet, there was typical cartilaginous ossification, such as a growth plate structure, showing cell multiplication, hypertrophy, and matrix calcification (Figure 7a,c). In the sections in the rats fed the soft diet, the palatal suture cartilaginous areas were much narrower than those in the rats fed the hard diet (Figure 7b,d). In particular, the cartilaginous cell layer and ossification disappeared close to the oral cavity in the palatal bone of the rats fed the normal calcium and soft diet (Figure 7b).
Figure 7.
Midpalatal suture bone and cartilage. Hematoxylin and eosin staining of frontal sections of midpalatal sutures of rats fed the normal-calcium (a, hard; b, soft) and low-calcium (c, hard; d, soft) diets. e–h are higher magnification of a–d, respectively. P indicates periosteum within the oral region of the midpalatal suture; B, bone; BM, bone marrow; SC, suture cartilage. Bar = 100 µm.
DISCUSSION
Dietary calcium deficiency reduced body weight gain and inhibited linear growth of the craniofacial area in growing rats. Consistent with our findings, previous study has indicated that a low-calcium diet resulted in reduced body weight gain and skeletal bone growth in rats.17 These findings suggest that dietary calcium deficiency resulted in inhibiting bone growth in the skeletal as well as the craniofacial region. In the micro-CT and histological findings, dietary calcium deficiency resulted in the loss of trabecular bone volume, with a reduction in cortical bone cross-sectional area and cortical thickness and an increase in trabecular separation, which means the deterioration of the connectivity of the trabeculae in maxilla and mandible, suggesting that abnormal alternations in calcium metabolism induced osteoporosis in jaw bones. However, dietary calcium deficiency had no effect on serum calcium levels. Generally, the calcium concentration in the blood is controlled within a very narrow range, and if the calcium concentration decreases, parathyroid hormone stimulates the resorption of calcium from the bone.18 Thus, we consider that dietary calcium deficiency resulted in an increase in bone resorption to maintain the serum calcium concentration at a normal level. Increasing resorption of bone mineral releases calcium and phosphate into blood. As consequence, serum phosphorus levels may increase significantly.
In the present results, the soft diet suppressed growth in the buccal direction in the zygomatic arch, growth in the posterior direction in the corpus, growth in the superior direction in the ramus, and growth in the buccal direction in the gonial angle. These regions are all attachment points of the masseter muscle. It is generally accepted that a decrease in mastication forces affects the structure of bones and muscles.13 Kawai et al.19 reported that a soft diet resulted in a decrease in the cross-sectional area of fibers and alternation of the fiber type composition of the superficial masseter muscle in growing rats. We believe that a decrease in activity, a decrease in the amount of masseter muscle fibers, or both, is involved in the inhibition of bone growth in rats fed a soft diet.
In micro-CT analyses, the soft diet resulted in a reduction in cortical bone cross-sectional area and cortical thickness and a deterioration of trabecular bone architecture in both the maxilla and the mandible. In addition, histological findings showed trabecular bone loss and enlargement of the bone marrow cavity; however, trabeculae attached to the periodontal ligament remained in the rats fed the normal calcium and soft diet. Shimizu et al.20 indicated that alveolar trabecular bone loss induced by occlusal hypofunction caused a reduction in its volume to the minimum necessary in the absence of forces stimulating the alveolar bone in growing rats. These findings indicated that the sites of remaining trabeculae (not resorbed) with the soft diet were associated with the loading direction of occlusal force in the maxilla as well as the mandible in growing rats.
Cephalometric analyses showed that the low-calcium diet and the soft diet had no effect on rat palatal width. However, histological findings in the midpalatal suture showed that the low-calcium and soft diet significantly affected cartilaginous ossification. Dietary calcium deficiency induced not only an increase in bone resorption but also weaker reactivity for eosin in cartilaginous tissues, although the plate bone adjacent to the midpalatal suture was composed of an apparently normal cartilaginous structure. These findings may be due to inhibition of the synthesis of extracellular matrix, including type II and X collagens, in mature and hypertrophic chondrocyte cell layers, and inhibition of cartilaginous calcification. Thus, we suggest that dietary calcium deficiency induced a synthetic abnormality in extracellular matrix essential for cartilage metabolism, especially in mature and hypertrophic chondrocyte cell layers, which resulted in inhibition of cartilaginous ossification in the midpalatal suture.
On the other hand, the soft diet resulted in narrower cartilage cell layers and the disappearance of the cartilaginous cell layers close to the oral cavity in the midpalatal suture, suggesting that the soft diet induced inhibition of the differentiation of undifferentiated mesenchymal cells into chondrocytes and inhibition of chondrocytic development and maturity in the midpalatal suture region.
CONCLUSIONS
The low-calcium diet and the soft diet induced the deterioration in bone structure in both the maxilla and the mandible.
Moreover, synergistic effects were found between the low-calcium diet and the soft diet in the deterioration of internal bone structures.
However, the mechanisms underlying deterioration of the bone structure differed between the diets.
ACKNOWLEDGMENT
This work was supported by Grants-in-Aid from the Ministry of Education, Culture, Sports, Science and Technology, Japan.
REFERENCES
- 1.Bauer KW, Larson NI, Nelson MC, Story M, Neumark-Sztainer D. Fast food intake among adolescents: secular and longitudinal trends from 1999 to 2004. Prev Med. 2009;48:284–287. doi: 10.1016/j.ypmed.2008.12.021. [DOI] [PubMed] [Google Scholar]
- 2.Yanagisawa Y, Tamura A, Akasaka M, Teramoto Y. Physical properties of food and eating functions. 1: an objective method for the measurement of the physical properties of foods, and classification of foods [in Japanese] Shoni Shikagaku Zasshi. 1985;23:962–983. [PubMed] [Google Scholar]
- 3.Enomoto A, Watahiki J, Yamaguchi T, Irie T, Tachikawa T, Maki K. Effects of mastication on mandibular growth evaluated by microcomputed tomography. Eur J Orthod. 2010;32:66–70. doi: 10.1093/ejo/cjp060. [DOI] [PubMed] [Google Scholar]
- 4.Hichijo N, Kawai N, Mori H, et al. Effects of the masticatory demand on the rat mandibular development. J Oral Rehabil. 2014;41:581–587. doi: 10.1111/joor.12171. [DOI] [PubMed] [Google Scholar]
- 5.The Ministry of Health Labour and Welfare. National Health and Nutrition Survey. December 2013. http://www.mhlw.go.jp/bunya/kenkou/eiyou/dl/h24-houkoku-04.pdf Accessed September 25, 2014. [Google Scholar]
- 6.The Ministry of Health Labour and Welfare. Dietary reference intakes for Japanese 2015. March 28, 2014. http://www.mhlw.go.jp/file/04-Houdouhappyou-10904750-Kenkoukyoku-Gantaisakukenkouzoushinka/0000041955.pdf Accessed September 25, 2014. [Google Scholar]
- 7.Weaver CM. Calcium bioavailability and its relation to osteoporosis. Proc Soc Exp Biol Med. 1992;200:157–160. doi: 10.3181/00379727-200-43409. [DOI] [PubMed] [Google Scholar]
- 8.Reeves PG, Nielsen FH, Fahey GC., Jr AIN-93 purified diets for laboratory rodents: final report of the American Institute of Nutrition ad hoc writing committee on the reformulation of the AIN-76A rodent diet. J Nnutr. 1993;123:1939–1951. doi: 10.1093/jn/123.11.1939. [DOI] [PubMed] [Google Scholar]
- 9.Watanabe K, Imamura H, Uchikanbori S, Fujita Y, Maki K. Effects of restricted calcium intake on bone and maxillofacial growth. Angle Orthod. 2008;78:445–452. doi: 10.2319/101106-417.1. [DOI] [PubMed] [Google Scholar]
- 10.Abbassy MA, Watari I, Soma K. Effect of experimental diabetes on craniofacial growth in rats. Arch Oral Biol. 2008;53:819–825. doi: 10.1016/j.archoralbio.2008.02.008. [DOI] [PubMed] [Google Scholar]
- 11.Singleton DA, Buschang PH, Behrents RG, Hinton RJ. Craniofacial growth in growth hormone-deficient rats after growth hormone supplementation. Am J Orthod Dentofacial Orthop. 2006;130:69–82. doi: 10.1016/j.ajodo.2005.02.016. [DOI] [PubMed] [Google Scholar]
- 12.VandeBerg JR, Buschang PH, Hinton RJ. Absolute and relative growth of the rat craniofacial skeleton. Arch Oral Biol. 2004;49:477–484. doi: 10.1016/j.archoralbio.2003.12.007. [DOI] [PubMed] [Google Scholar]
- 13.Kiliaridis S, Engstrom C, Thilander B. The relationship between masticatory function and craniofacial morphology. I. A cephalometric longitudinal analysis in the growing rat fed a soft diet. Eur J Orthod. 1985;7:273–283. doi: 10.1093/ejo/7.4.273. [DOI] [PubMed] [Google Scholar]
- 14.Bouxsein ML, Boyd SK, Christiansen BA, Guldberg RE, Jepsen KJ, Muller R. Guidelines for assessment of bone microstructure in rodents using micro-computed tomography. J Bone Miner Res. 2010;25:1468–1486. doi: 10.1002/jbmr.141. [DOI] [PubMed] [Google Scholar]
- 15.Denes BJ, Mavropoulos A, Bresin A, Kiliaridis S. Influence of masticatory hypofunction on the alveolar bone and the molar periodontal ligament space in the rat maxilla. Eur J Oral Sci. 2013;121:532–537. doi: 10.1111/eos.12092. [DOI] [PubMed] [Google Scholar]
- 16.Dahlberg G. Statistical Methods for Medical and Biological Students. London, UK: G Allen & Unwin Ltd; 1940. [Google Scholar]
- 17.Morimoto Y, Tanaka T, Kito S, et al. Quantitative radiographic changes in the mandible and the tibia in systemically loaded rats fed a low-calcium diet. Oral Dis. 2000;6:310–317. doi: 10.1111/j.1601-0825.2000.tb00144.x. [DOI] [PubMed] [Google Scholar]
- 18.Weaver CM. Present Knowledge in Nutrition. 9th ed. Vol. 1. Washington, DC: ILSI Press; 2006. Calcium. Vol. [Google Scholar]
- 19.Kawai N, Sano R, Korfage JA, et al. Adaptation of rat jaw muscle fibers in postnatal development with a different food consistency: an immunohistochemical and electromyographic study. J Anat. 2010;216:717–723. doi: 10.1111/j.1469-7580.2010.01235.x. [DOI] [PMC free article] [PubMed] [Google Scholar]
- 20.Shimizu Y, Hosomichi J, Kaneko S, Shibutani N, Ono T. Effect of sympathetic nervous activity on alveolar bone loss induced by occlusal hypofunction in rats. Arch Oral Biol. 2011;56:1404–1411. doi: 10.1016/j.archoralbio.2011.05.004. [DOI] [PubMed] [Google Scholar]


