Visual Abstract
Keywords: radioembolization, dose–response relationship, 90Y PET, colorectal liver metastases, total lesion glycolysis
Abstract
Radioembolization based on personalized treatment planning requires established dose–response and dose–toxicity relationships. The aim of this study was to investigate dose–response and dose–toxicity relationships in patients with colorectal liver metastases (CRLMs) treated with glass 90Y-microspheres. Methods: All CRLM patients treated with glass 90Y-microspheres in our institution were retrospectively analyzed. The tumor-absorbed dose was calculated for each measurable metastasis (i.e.,18F-FDG–positive and more than a 5-cm3 tumor volume) on posttreatment 90Y PET. Metabolic tumor response was determined on 18F-FDG PET/CT by measuring the total lesion glycolysis at baseline and at 3 mo after treatment. The relationship between tumor-absorbed dose and metabolic response was determined on a per-lesion and per-patient basis using a linear mixed-effects regression model. Clinical toxicity and laboratory toxicity were correlated with healthy liver–absorbed dose. Results: Thirty-one patients were included. The median tumor-absorbed dose of 85 measurable metastases was 133 Gy (range, 20–1001 Gy). Per response category, this was 196 Gy for complete response (CR), 177 Gy for partial response (PR), 72 Gy for stable disease, and 95 Gy for progressive disease (PD). A significant dose–response relationship was found on a tumor level, with a significantly higher tumor-absorbed dose in metastases with CR (+94%) and PR (+74%) than in metastases with PD (P < 0.001). A similar relationship was found on a patient level, with PR having a higher tumor-absorbed dose than did PD (+58%, P = 0.044). A tumor-absorbed dose of more than 139 Gy predicted a 3-mo metabolic response with the greatest accuracy (89% specificity and 77% sensitivity), whereas a tumor-absorbed dose of more than 189 Gy predicted response with 97% specificity and 45% sensitivity. The median healthy liver–absorbed dose was 63 Gy (range, 24–113 Gy). Toxicity was limited mostly to grades 1 and 2, with 1 case of radioembolization-induced liver disease in a patient who received the highest healthy liver–absorbed dose. A positive trend was seen for most laboratory parameters in our dose–toxicity analysis. Conclusion: A significant relationship was observed between dose and response in CRLM patients treated with glass 90Y radioembolization.
Radioembolization is an established treatment option for patients with unresectable primary and secondary liver tumors (1). Microspheres containing 90Y or 166Ho are injected intraarterially to deliver a high radiation dose to the tumors. In hepatocellular carcinoma (HCC), the treatment effect was shown to be dependent on the tumor-absorbed dose, with higher doses achieving a better response (2,3). However, increasing the tumor-absorbed dose by administering higher activities also increases the healthy liver–absorbed dose. The relative distribution of microspheres between healthy liver tissue and tumor tissue, which varies greatly between different patients and tumor types, can be predicted by performing a simulation procedure before the treatment itself. This distribution can be used to perform compartment-model dose planning, allowing for high tumor-absorbed doses while staying within the safety limits of the healthy liver–absorbed dose. This is especially important in patients with colorectal liver metastases (CRLMs), who tend to have less favorable tumor–to–healthy liver distributions than do patients with other tumor types. In 1 study, CRLM patients had a mean tumor-to-nontumor uptake ratio of 1.7, compared with 7.2 in HCC (4). Furthermore, CRLM patients may have received hepatotoxic systemic treatment, hepatic surgery, or local ablative procedures, limiting the tolerable healthy liver–absorbed dose.
A strong dose–response relationship in CRLM patients was found for radioembolization using resin 90Y-microspheres and 166Ho-microspheres but has not been demonstrated for glass 90Y-microspheres (5,6). The dose–response relationship for glass 90Y-microspheres is not equal to the relationship for resin 90Y- or 166Ho-microspheres because of important differences in the characteristics of these products (e.g., number of microspheres, distribution, specific activity, radioisotope, and density).
The aim of this study was to investigate the dose–response and dose–toxicity relationships of glass 90Y-microsphere radioembolization in CRLM patients.
MATERIALS AND METHODS
Study Design and Patient Selection
All CRLM patients treated with glass 90Y-microspheres between January 2012 and December 2019 at our institute were screened for inclusion. This study was approved by our ethical research committee, and the need for informed consent was waived.
Reasons for exclusion from this study were that 18F-FDG PET had not been performed or had been performed more than 10 wk before treatment, the patient had undergone previous whole-liver radioembolization, image registration was poor, and 90Y PET had not been performed after treatment. To qualify for the dose–response evaluation, patients were required to have undergone follow-up 18F-FDG PET/CT within 2–4 mo after treatment and to have 18F-FDG–positive tumors larger than 5 cm3 at baseline. For the dose–toxicity evaluation, patients who received sequential whole-liver treatments (i.e., right, and left lobes treated separately) for less than 3 mo were excluded because of time-interval bias and inaccuracy of the healthy liver–absorbed dose measurement.
Treatment Procedures
Candidates for 90Y radioembolization treatment underwent a work-up with 18F-FDG PET/CT and multiphasic CT of the liver and were discussed by a multidisciplinary tumor board. All patients had to be in acceptable clinical condition (World Health Organization performance score of 0–2) and have adequate organ function. One to 2 wk before treatment, eligible patients underwent preparatory angiography, in which a surrogate dose (±150 MBq) of 99mTc-macroaggregated albumin (99mTc-MAA) was administered to simulate the intra- and extrahepatic distribution of microspheres. This distribution was then visualized using 99mTc-MAA SPECT/CT imaging.
Patients were treated palliatively in lobar and (sequential) whole-liver fashion or as a bridge to a resection through radiation lobectomy or segmentectomy. Treatment was planned using 1-compartment modeling according to the MIRD method, aiming for an average absorbed dose of 80–150 Gy (>200 Gy in radiation segmentectomy) in the treated volume (7). Posttreatment distribution was assessed using 90Y PET/CT imaging the morning after treatment. 18F-FDG PET/CT and multiphasic CT of the liver were performed at 3 mo after treatment for response assessment.
Dose–Response Evaluation
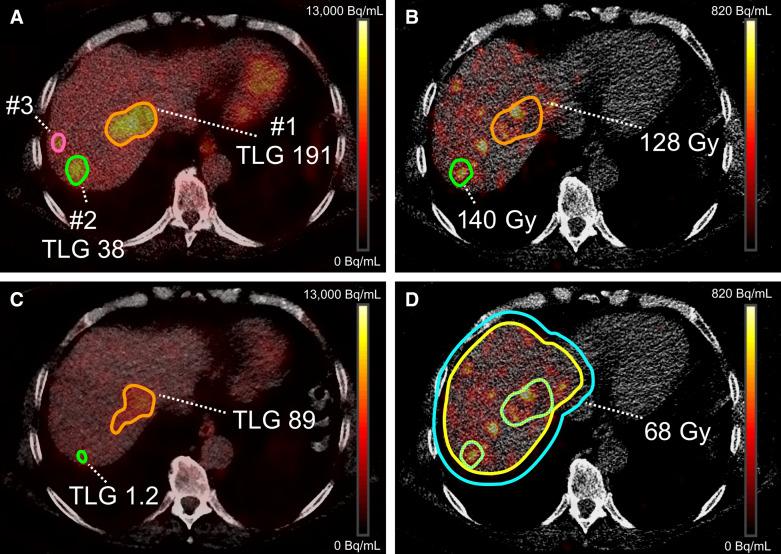
Tumor-absorbed dose and metabolic tumor response were assessed using 90Y PET/CT and 18F-FDG PET/CT, respectively. This assessment was performed on a per-tumor basis and on a per-patient basis (using a weighted average of all measured tumors within a liver). All tumor delineations and image registrations were performed using Simplicit90Y software (Mirada Medical Ltd.). Tumor volumes of interest (VOIs) were defined as previously reported (5,8). In short, tumors were delineated using baseline 18F-FDG PET/CT with a threshold for metabolic activity concentration as defined by PERCIST (Fig. 1) (9). A volume restriction of at least 5 cm3 was applied to solitary tumors. Merged tumors on follow-up were separated visually using contrast-enhanced CT imaging; if this separation could not be achieved, the merged tumors would be considered as 1 tumor at baseline for calculation of metabolic activity and absorbed dose. Total lesion glycolysis was calculated for each lesion at baseline and at the 3-mo follow-up to determine the metabolic response. Metabolic tumor response was categorized as follows. A change in metabolic activity of −100% was considered a metabolic complete response (CR), −45% to −99% was considered a metabolic partial response (PR), +75% to −44% was considered stable disease (StD), and +75% was considered metabolic progressive disease (PD). The categories were subsequently grouped into objective response (CR + PR) and nonresponse (StD + PD). The occurrence of new lesions after radioembolization was reported but not regarded as PD in the analysis, as the goal was to demonstrate a dose–response relationship.
FIGURE 1.
Example of absorbed dose and total lesion glycolysis (TLG) calculation. (A) Threshold-based mask on baseline 18F-FDG PET to delineate 3 lesions and determine baseline TLG; lesion 3 had volume < 5 cm3 and was excluded. (B) VOIs registered to posttreatment 90Y PET/CT to determine individual tumor-absorbed dose. Dose distribution was more heterogeneous in lesion 1. (C) TLG measurement on 3-mo follow-up 18F-FDG PET. Lesion 2 had decrease in metabolic activity of 96% (PR), whereas lesion 1 had only 53% decrease (PR). (D) Healthy liver–absorbed dose as measured on posttreatment 90Y PET/CT. Liver contour was manually delineated; this VOI was subsequently expanded by 10 mm in all directions to include all hepatic activity. Healthy liver VOI was achieved by subtracting all lesion VOIs.
18F-FDG PET images were coregistered to the 90Y PET images, using the low-dose CT scans. To improve measurement accuracy, the 90Y PET dose map was used to register each tumor VOI individually. Only rigid transformations were used. Tumor-absorbed doses were calculated using the local deposition method, with the following formula:
where Dtumor is the tumor-absorbed dose in grays, Atumor is the mean activity in the tumor VOI in gigabecquerels, 50 is the absorbed energy in joules from the decay of 1 GBq of 90Y, Vtumor is the tumor VOI in liters, and 1.03 kg/L is the assumed density of liver tissue.
Dose–Toxicity Evaluation
The standard clinical protocol included a clinical and laboratory evaluation at baseline, 2 wk, 1 mo, and 3 mo after treatment. Laboratory markers collected for analysis included serum albumin, total bilirubin, alkaline phosphatase, γ-glutamyltransferase, aspartate aminotransferase, and alanine transaminase. All events were recorded using the Common Terminology Criteria for Adverse Events (CTCAE), version 5. Preexisting toxicities were excluded unless they were exacerbated after treatment.
The whole-liver VOIs were manually delineated on low-dose CT scans and were subsequently expanded along the original contours by 10 mm to correct for errors due to motion and scanner resolution. All tumor VOIs that were at least 5.0 cm3 on baseline 18F-FDG PET were then subtracted from the original and the expanded whole-liver VOIs. The healthy liver–absorbed doses were calculated using activity measured within the expanded VOI and the volume of the original VOI.
Scanner Equipment, Acquisition, and Image Reconstructions
PET images were acquired on a Biograph mCT time-of-flight PET/CT scanner with TrueV (Siemens Medical Solutions USA, Inc.).
90Y PET was acquired at 2 bed positions, with an acquisition time of 15 min per bed position. To reconstruct the images, an iterative algorithm (4 iterations and 21 subsets) including scatter correction, resolution recovery, and CT-based attenuation correction (40 mAs, 100–120 kV) was used. A gaussian postreconstruction filter of 5 mm was applied, and a 200 × 200 matrix was used, resulting in a pixel size of 4 × 4 × 3 mm.
18F-FDG PET imaging was performed 1 h after injection of a 2.0 MBq/kg dose of 18F-FDG. Images were reconstructed using a European Association of Nuclear Medicine Research Ltd.–accredited protocol (10,11).
Statistical Analysis
The relationship between tumor-absorbed dose (log-transformed) and response was analyzed using a linear mixed-effects regression model, to account for correlation of tumors within patients. Nested models were compared using the Akaike information criterion. A trend test was performed to test for an ordered relationship across the response categories; in this model, response was used as a continuous variable. The dose–effect relationship was best explained using a random intercept per patient without random slopes. Analyses were adjusted for the following possible confounders: tumor volume, specific activity, dose heterogeneity (SD of activity concentration within a tumor), primary tumor location, extrahepatic disease, and number of prior systemic treatment lines. A receiver-operating-characteristic analysis, accounting for clustered data, was performed to determine the discriminatory power of tumor-absorbed dose in response estimation (10).
The strength of the association between CTCAE toxicity grade and healthy liver–absorbed dose was assessed using linear regression models, with CTCAE grade in categories as the dependent continuous variable and healthy liver–absorbed dose as the independent continuous variable. Simple linear regression models were used to assess the association between relative changes in laboratory parameters and healthy liver–absorbed dose. All toxicity analyses were adjusted for response to therapy (binary-coded as response or nonresponse), mean tumor-absorbed dose (continuous variable), and hepatic reserve as possible confounders.
Overall survival was defined as the interval between radioembolization and death from any cause. Cox regression models were made using the Firth correction for small sample bias (11). Analyses were adjusted for age and presence of extrahepatic disease at baseline. Inspection of Schoenfeld residuals showed that the proportionality of the hazard assumption was not violated. Analyses were performed using R statistical software, version 3.6.2, for Microsoft Windows. We report effect estimates with associated 95%CIs and corresponding 2-sided P values.
RESULTS
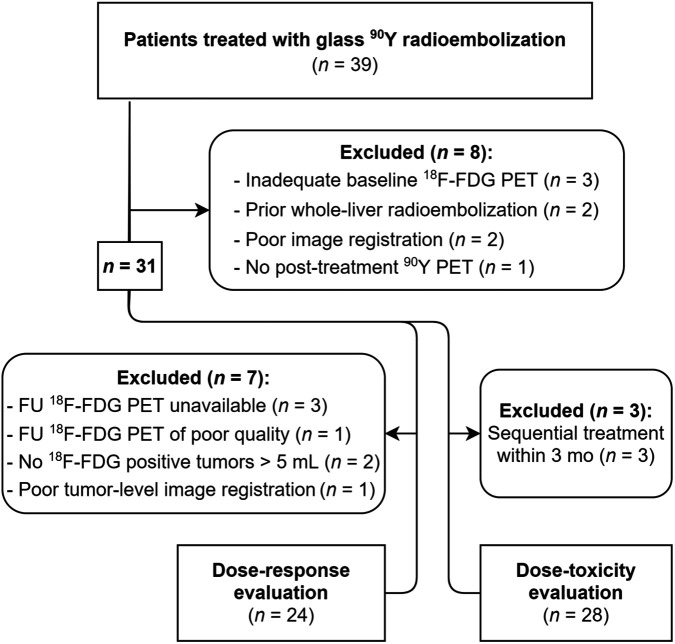
In total, 39 patients were treated with glass 90Y radioembolization for CRLM, 31 of whom were included in this study (Table 1); 24 (77%) of these 31 patients were included in the dose–response evaluation, and 28 (90%) were included in the dose–toxicity evaluation (Fig. 2).
TABLE 1.
Baseline and Treatment Characteristics (n = 31)
| Characteristic | Data |
|---|---|
| Sex | |
| Male | 25 (81%) |
| Female | 6 (19%) |
| Age (y) | 66 (45–82) |
| World Health Organization performance score | |
| 0 | 21 (68%) |
| 1 | 9 (29%) |
| 2 | 1 (3%) |
| Received prior therapy | |
| Locoregional therapy* | 16 (52%) |
| Systemic treatment | 29 (94%) |
| Chemotherapy lines | 2 (1–4) |
| Bevacizumab | 16 (52%) |
| Extrahepatic disease at baseline | 12 (39%) |
| Lymph node | 8 (26%) |
| Lung | 4 (13%) |
| Other† | 2 (6%) |
| Liver volume (cm3) | 1,890 (821–3,030) |
| Metabolic tumor volume (cm3)‡ | 136 (11–679) |
| Tumors per patient | 3 (1–8) |
| Administered activity (MBq) | 2,925 (1,193–5,994) |
| Treated volume (cm3) | 1,613 (154–3,000) |
| Treated fraction | 0.84 (0.14–1.00) |
| Average treated volume-absorbed dose (Gy) | 120 (60–220) |
| Radioembolization treatment | |
| Whole liver | 16 (52%) |
| Lobar§ | 15 (48%) |
| Synchronous metastasis | 13 (42%) |
| Primary tumor location | |
| Left-sided | 20 (65%) |
| Right-sided | 3 (10%) |
| Rectum | 7 (22%) |
| Location unknown | 1 (3%) |
| Primary tumor status | |
| In situ | 10 (32%) |
| Removed or chemoirradiated | 21 (68%) |
Includes ablative procedures (i.e., radiofrequency ablation [n = 4], microwave ablation [n = 1], hepatic surgery [i.e., metastasectomy (n = 8), segmentectomy (n = 1), and hemihepatectomy (n = 1)], and portal vein embolization [n = 1]).
One lung metastasis and 1 bone metastasis.
As per PERCIST.
Includes radiation lobectomy (n = 4) and radiation segmentectomy (n = 2).
Qualitative data are number and percentage; continuous data are median and range.
FIGURE 2.
Flowchart of patient inclusion and exclusion. FU = follow-up.
Dose–Response Evaluation
In total, 85 tumors larger than 5 cm3 were identified in 24 patients and included in the analysis. The median time from baseline 18F-FDG PET to radioembolization was 31 d (range, 8–70 d), and the median time from radioembolization to follow-up 18F-FDG PET was 89 d (range, 59–112 d). The median delay between the reference time (date of dose calibration) and microsphere injection was 4 d (range, 1–11 d). Ten patients developed new lesions after radioembolization, 3 of whom had PR based on the treated lesions. All 3 patients received unilobar or segmental radioembolization and developed new lesions in untreated parts of the liver.
Per-Lesion Analysis
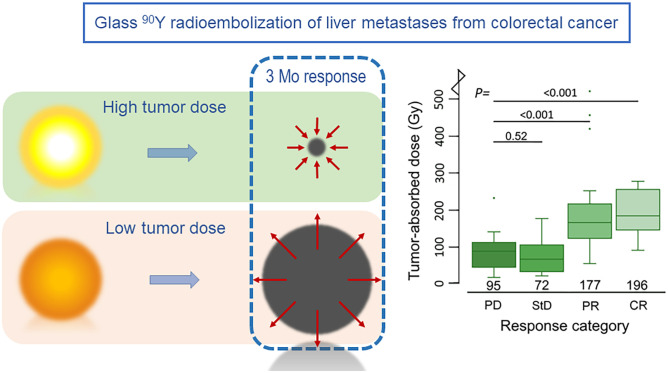
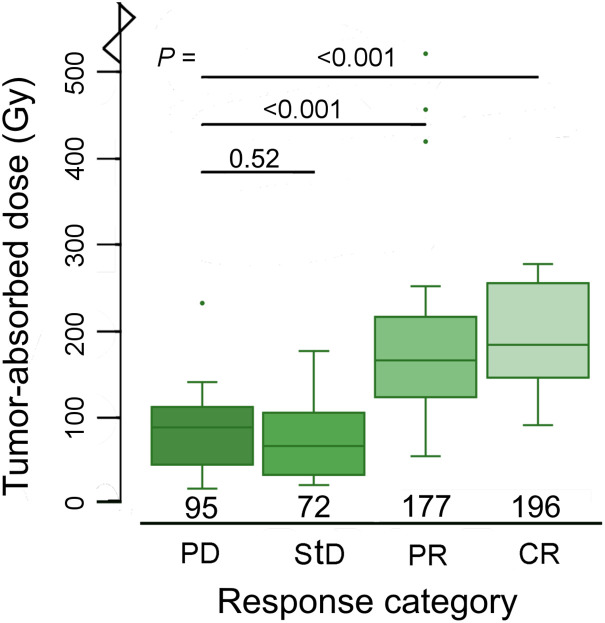
The median tumor-absorbed dose was 133 Gy (range, 20–1,001 Gy). The metabolic response in individual tumors at the 3-mo follow-up was CR in 10 tumors (12%), PR in 37 tumors (44%), StD in 20 tumors (23%), and PD in 18 tumors (21%). The median tumor-absorbed dose per response category was 196 Gy (98–1001 Gy) for CR, 177 Gy (59–551 Gy) for PR, 72 Gy (24–189 Gy) for StD, and 95 Gy (20–246 Gy) for PD (Fig. 3).
FIGURE 3.
Box plots demonstrating relationship between tumor-absorbed dose on tumor level and metabolic response at 3-mo follow-up. One outlier in complete CR category (1,001 Gy) is not depicted.
The mean tumor-absorbed dose was 94% higher in CR than in PD (95%CI, 47%–157%), 74% higher in PR than in PD (95%CI, 42%–112%), and 2% higher in StD than in PD (95%CI, −16%–25%) (P trend < 0.0001) (Table 2).
TABLE 2.
Percentage Change in Mean Absorbed Dose per Response Category
| Parameter | PD | StD | PR | CR | Trend in P |
|---|---|---|---|---|---|
| Patient level | |||||
| n | 4 | 7 | 12 | 1 | |
| Unadjusted | Reference | 13.6 (−39–112) | 111 (17–281) | — | 0.0087 |
| Adjusted* | Reference | 29 (−19–103) | 58 (5–131) | 0.044 | |
| Tumor level | |||||
| n | 18 | 20 | 37 | 10 | |
| Unadjusted | Reference | −3.5 (−29–31) | 90 (40–161) | 159 (62–286) | <0.001 |
| Adjusted† | Reference | 2 (−16–25) | 74 (42–112) | 94 (47–157) | <0.001 |
Adjusted for total tumor volume at baseline (per patient), specific activity and tumor dose heterogeneity, primary tumor location, extrahepatic disease, and number of prior systemic treatment lines.
Adjusted for tumor volume at baseline, specific activity, and tumor dose heterogeneity.
Data are in grays, with 95%CIs in parentheses.
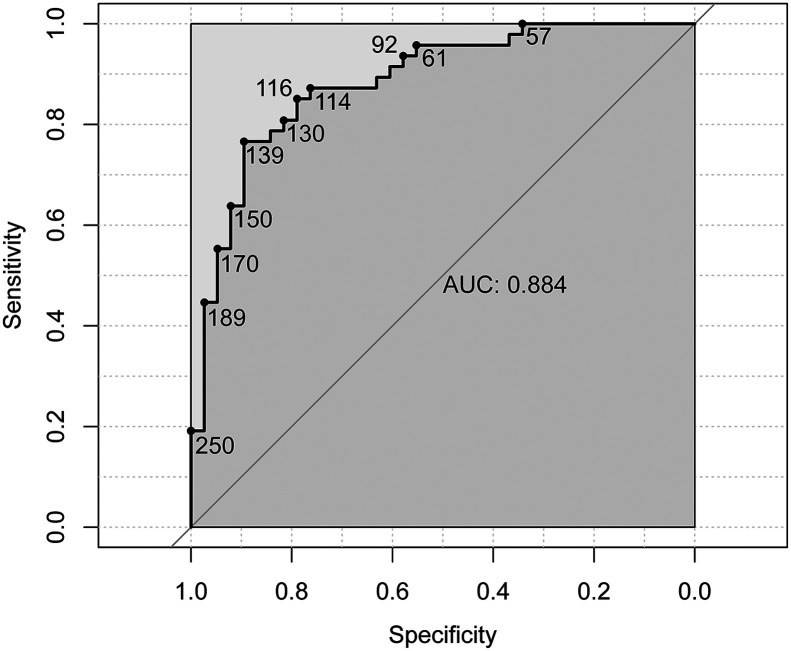
Tumor-absorbed dose was found to be a good predictor of objective response based on receiver-operating-characteristic analysis, with an area under the curve of 0.88 (95%CI, 0.79–0.98) (Fig. 4). A tumor-absorbed dose of more than 139 Gy predicted a 3-mo metabolic response with the greatest accuracy (89% specificity and 77% sensitivity), whereas a tumor-absorbed dose of more than 189 Gy predicted response with 97% specificity and 45% sensitivity.
FIGURE 4.
Receiver-operating-characteristic curve demonstrating predictive value of tumor-absorbed dose for metabolic response (CR + PR), on tumor level. Area under curve (AUC) is based on analysis of clustered data, whereas receiver-operating-characteristic curve is not. Receiver-operating-characteristic curve is marked with corresponding tumor-absorbed dose in Gy.
Per-Patient Analysis
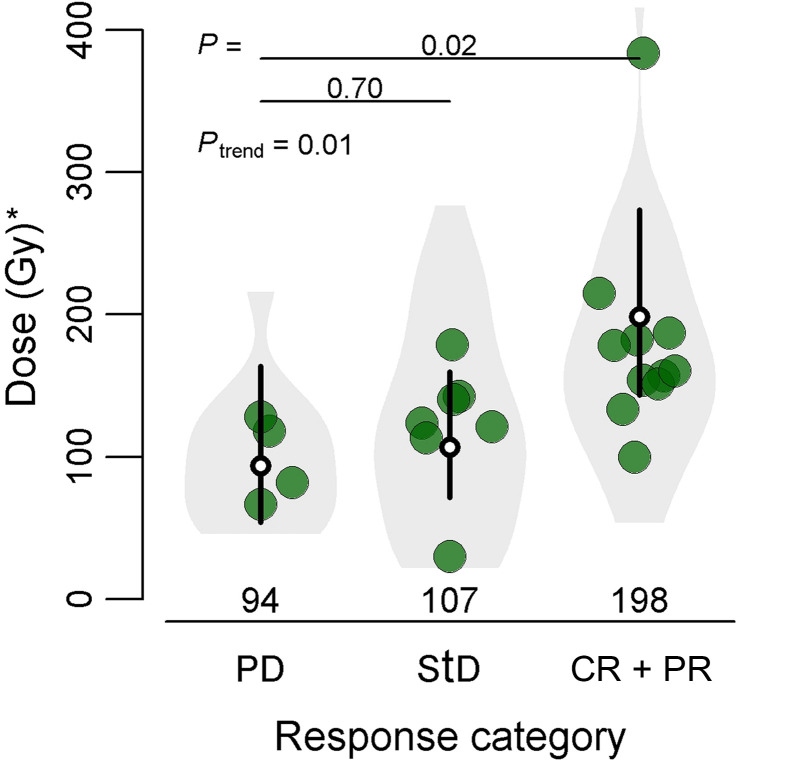
There was a significant difference in mean tumor-absorbed dose between response categories on a per-patient basis. The geometric mean tumor-absorbed dose for the range of all measured tumors was 198 Gy in responders (CR + PR), 107 Gy in StD, and 94 Gy in PD (Fig. 5). The mean dose in responders was 58% higher than in patients with PD (5%–131%, P trend = 0.044) (Table 2).
FIGURE 5.
Relationship between tumor-absorbed dose on patient level and metabolic tumor response at 3-mo follow-up. White dots represent mean tumor-absorbed dose per response category, and 95% CIs are represented by black lines. Large bullets depict mean tumor-absorbed dose per patient. On patient level, only 1 patient had CR; thus, categories CR and PR were analyzed together. *Geometric mean of tumor-absorbed dose.
Dose–Toxicity Analysis
The absorbed dose to healthy liver tissue was measured in 28 patients. Fourteen lesions smaller than 5 cm3 (median, 2.2 cm3) were found in 8 patients. These lesions could not be reliably subtracted from the healthy liver VOI. However, the total volumes of lesions included in the healthy liver were no more than 0.6% of the VOI in all patients. The median absorbed dose to the entire healthy liver was 63 Gy (range, 24–113 Gy). Median follow-up was 91 d (range, 14–110 d). Clinical data or at least 1 laboratory data point was missing for 2 patients at the 1-mo follow-up and 4 patients at the 3-mo follow-up.
In total, 95 adverse events were recorded in 24 (86%) of 28 patients and consisted of 47 laboratory toxicities and 48 clinical toxicities (Table 3). Three serious adverse events were observed (i.e., ≥grade 3). One patient received an absorbed dose of 113 Gy to the healthy liver in a whole-liver treatment, using microspheres 9 d after calibration. This patient initially presented with mild symptoms of nausea, fatigue, and abdominal pain. Six weeks after treatment, the patient developed ascites (grade 2). At 3 mo after treatment, grade 3 γ-glutamyltransferase toxicity, grade 2 hyperbilirubinemia, and elevations in alkaline phosphatase, aspartate aminotransferase, and alanine transaminase developed, confirming the diagnosis of radioembolization-induced liver disease. Symptomatic treatment was continued by the referring oncologist. The patient had a PR to the treatment, with a mean tumor-absorbed dose of 172 Gy, and died 11 mo after treatment.
TABLE 3.
CTCAE Grading of New Clinical and Laboratory Toxicity per Patient for 3 Months After Treatment
| CTCAE grade | |||
|---|---|---|---|
| Parameter | 1 | 2 | 3 |
| Clinical toxicity | |||
| Abdominal pain | 9 | 1 | |
| Nausea | 6 | 2 | |
| Fatigue | 16 | 3 | |
| Anorexia | 4 | 2 | |
| Fever | 2 | ||
| Constipation | 1 | ||
| Ascites | 1 | 1 | |
| Any clinical toxicity* | 15 | 7 | |
| Laboratory toxicity | |||
| Albumin | 3 | 3 | |
| Bilirubin | 1 | 2 | |
| Alkaline phosphatase | 7 | 2 | 1 |
| γ-glutamyltransferase | 4 | 2 | 2 |
| Aspartate aminotransferase | 8 | 1 | |
| Alanine transaminase | 10 | 1 | |
| Any lab toxicity* | 11 | 6 | 2 |
Highest grade per patient.
The 2 remaining serious adverse events occurred in 1 patient, who experienced grade 3 γ-glutamyltransferase and alkaline phosphatase toxicity and an elevation in bilirubin at 3 mo after treatment, accompanied by mild abdominal pain, fatigue, and anorexia (all grade 1). The healthy liver–absorbed dose was 63 Gy. A CT scan revealed the likely cause to be a central biliary obstruction due to disease progression.
The highest healthy liver–absorbed dose without radioembolization-induced liver disease was 88 Gy. Most toxicities were mild, that is, CTCAE grade 1 or 2 (n = 71 and n = 21, respectively). The most frequently occurring clinical toxicities were fatigue, abdominal pain, and nausea, which were expected and generally resolved without intervention.
Linear regression analysis showed no significant relationship between healthy liver–absorbed dose and any clinical toxicity grade (Supplemental Table 1; supplemental materials are available at http://jnm.snmjournals.org). However, healthy liver–absorbed dose was related to laboratory toxicity grade (Supplemental Table 2; Supplemental Fig. 1) and to relative changes in laboratory parameters (Supplemental Table 3).
Survival
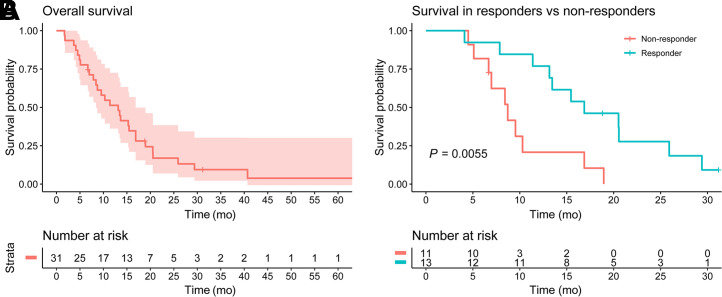
The median overall survival in our sample was 13.2 mo (95%CI, 8.4–18.9 mo). The median overall survival of responders was significantly higher than that of nonresponders, at 16.9 mo versus 8.7 mo (Fig. 6). The hazard ratio for responders was 0.27 (95%CI, 0.09–0.72; P = 0.0091). A mean tumor dose of at least 189 Gy resulted in a higher overall survival, but the difference was not statistically significant.
FIGURE 6.
Kaplan–Meier curve of overall survival in all patients (A), and curves for patients with and without metabolic tumor response at 3 mo (B).
DISCUSSION
To our knowledge, this study was the first to report a dose–response relationship in patients with CRLMs treated with glass 90Y-microspheres. Our results show that higher tumor-absorbed doses result in a better metabolic response at the 3-mo follow-up, as well as improved survival. This relationship was demonstrated both on an individual tumor level and on a patient level. Furthermore, a tumor-absorbed dose of more than 189 Gy was found to be a good predictor of metabolic response after 3 mo.
Currently, the best-established dose–response relationships are those for the treatment of HCC. In a prospective study of 35 HCC patients, the median tumor-absorbed dose in responders (mRECIST 1.1) was 225 Gy, compared with 83 Gy in nonresponders (12). All tumors with a tumor-absorbed dose of more than 200 Gy had a good response. A retrospective study on radiation segmentectomy in 33 HCC patients found that 14 of 17 tumors with complete pathologic necrosis received an absorbed dose of more than 190 Gy (P = 0.03) to the treated segment (13). A recent consensus panel of experts therefore recommended a tumor-absorbed dose of more than 200 Gy to achieve response (14). The findings of the present study appear to be within the same range, albeit in a different tumor type.
Although a dose–toxicity relationship was not established, the results indicate that the treatment is well tolerated. Serious toxicity occurred in 1 whole-liver treatment that resulted in a very high healthy liver–absorbed dose of 110 Gy. Apart from this outlier, treatments were well tolerated with doses of up to 88 Gy. These results are in line with preliminary healthy liver–absorbed dose thresholds in HCC. A study on unilobar treatment of HCC identified bilirubin to be a significant risk factor for toxicity and determined safety thresholds based on its baseline value. A healthy liver–absorbed dose of 90 Gy poses a 15% risk of liver decompensation in patients with a low baseline level of bilirubin (i.e., <1.1 mg/dL). The threshold for a baseline bilirubin level of more than 1.1 mg/dL was found to be 50 Gy (15). Other authors identified a combination of a healthy liver–absorbed dose of at least 120 Gy and less than 30% nonirradiated liver volume to be a significant factor for toxicity (16). Interestingly, a perfused-volume healthy liver–absorbed dose of 120 Gy constitutes a whole-liver healthy liver–absorbed dose of around 84 Gy, considering a 30% nonirradiated liver volume, which is also comparable to the findings of the present study.
Our group conducted 2 similar studies in CRLMs using resin 90Y-microspheres and 166Ho-microspheres (5,6). These studies used the same methods for dosimetry (i.e., 18F-FDG PET–based tumor delineation, posttreatment dosimetry, and 18F-FDG PET–based response assessment). The study on resin 90Y-microspheres estimated that a tumor-absorbed dose of 40–60 Gy was required to achieve a substantial metabolic tumor response (i.e., a total lesion glycolysis decrease of ≥50%) at the 1-mo follow-up. This amount is much lower than the absorbed dose thresholds found in the present study. The other study focusing on the dose–response relationship in 166Ho-radioembolization of CRLMs found a mean tumor-absorbed dose of 173 Gy in responders (i.e., CR or PR), which is more in line with the 193 Gy found in responders in the present study (6). When comparing these studies, there are many factors that should be considered, such as important differences in specific activity, number of injected microspheres, dosimetry technique, and treated populations. These differences between microspheres warrant further research.
The dose thresholds identified in this study were based on posttreatment 90Y distribution instead of pretreatment 99mTc-MAA distribution. In clinical practice, 99mTc-MAA distribution is used for determining the 90Y activity to be injected. We chose to study 90Y distribution instead of 99mTc-MAA distribution since the known mismatch between 90Y and 99mTc-MAA would add another factor diluting the observed dose–response relationship. The mismatch between 99mTc-MAA and 90Y is unpredictable (17). Thus, caution is advised when using 90Y-based thresholds for 99mTc-MAA–based treatment planning.
The current study had several limitations. First, because of our limited sample size, we could not establish absorbed dose thresholds for healthy liver tissue. This problem is common in studies on radioembolization because of the low incidence of serious toxicity. Second, a follow-up period of 3 mo might be considered too short; however, in our experience, radioembolization-induced liver disease usually occurs within 2 mo of treatment. Third, this cohort consisted mostly of heavily pretreated, chemorefractory CRLM patients; therefore, the results may not apply to patients in earlier lines of treatment. Additionally, there were large ranges in the timing of baseline and follow-up scans, limiting the precision of the reported results. The automated VOI delineation method used in this study decreases interoperator variability compared with manual delineation and resulted in a more reproducible delineation result. Furthermore, the subsequent registration with 90Y PET images based on individual tumor VOIs produced superior tumor-absorbed dose measurements. However, our measurements will likely differ from those acquired with routinely used methods based on CT or MRI. Finally, metabolic response using total lesion glycolysis differs from the more widely used RECIST method. Nonetheless, metabolic response using total lesion glycolysis was used to combine volume changes and metabolic changes into a single response metric (18,19).
As we shift toward a personalized treatment approach in radioembolization, the demonstration of a dose–response relationship in CRLMs with glass 90Y-microspheres brings us a step closer toward this goal. On the basis of our data, we recommend a tumor-absorbed dose of more than 189 Gy to achieve response; however, this dose should be considered a target and not as an absolute threshold for patient selection, as sufficient response has been achieved with lower absorbed doses.
CONCLUSION
A significant dose–response relationship for the treatment of CRLM patients with glass 90Y-microspheres was found. Patients who received higher tumor-absorbed doses showed better response rates.
DISCLOSURE
Marnix Lam is a consultant for Boston Scientific and Terumo. Maarten Smits and Arthur Braat have served as speakers for SirTex, BTG, and Terumo. Ahmed Alsultan has served as a speaker for BTG. Miriam Koopman has received research grants from SirTex. The Department of Radiology and Nuclear Medicine of the UMC Utrecht receives royalties from Quirem Medical. Medical and research support was received from Terumo, Quirem Medical, and BTG. No other potential conflict of interest relevant to this article was reported.
KEY POINTS
QUESTION: Is there a relationship between dose and effect in glass 90Y radioembolization of CRLMs?
PERTINENT FINDINGS: This retrospective cohort study demonstrated a significant dose–response relationship. A tumor-absorbed dose of more than 189 Gy predicted response with great specificity (97%).
IMPLICATIONS FOR PATIENT CARE: Our findings could be used to implement personalized dosimetry.
REFERENCES
- 1. Reinders MTM, Mees E, Powerski MJ, et al. Radioembolisation in Europe: a survey amongst CIRSE members. Cardiovasc Intervent Radiol. 2018;41:1579–1589. [DOI] [PMC free article] [PubMed] [Google Scholar]
- 2. Garin E, Tselikas L, Guiu B, et al. Personalised versus standard dosimetry approach of selective internal radiation therapy in patients with locally advanced hepatocellular carcinoma (DOSISPHERE-01): a randomised, multicentre, open-label phase 2 trial. Lancet Gastroenterol Hepatol. 202;6:17–29. [DOI] [PubMed] [Google Scholar]
- 3. Hermann A-L, Dieudonné A, Ronot M, et al. Relationship of tumor radiation-absorbed dose to survival and response in hepatocellular carcinoma treated with transarterial radioembolization with 90Y in the SARAH study. Radiology. 2020;296:673–684. [DOI] [PubMed] [Google Scholar]
- 4. Garin E, Rolland Y, Laffont S, Edeline J. Clinical impact of 99mTc-MAA SPECT/CT-based dosimetry in the radioembolization of liver malignancies with 90Y-loaded microspheres. Eur J Nucl Med Mol Imaging. 2016;43:559–575. [DOI] [PMC free article] [PubMed] [Google Scholar]
- 5. van den Hoven AF, Rosenbaum CENM, Elias SG, et al. Insights into the dose-response relationship of radioembolization with resin 90Y-microspheres: a prospective cohort study in patients with colorectal cancer liver metastases. J Nucl Med. 2016;57:1014–1019. [DOI] [PubMed] [Google Scholar]
- 6. van Roekel C, Bastiaannet R, Smits MLJ, et al. Dose-effect relationships of 166Ho radioembolization in colorectal cancer. J Nucl Med. 2021;62:272–279. [DOI] [PubMed] [Google Scholar]
- 7. TheraSphere yttrium-90 glass microspheres. Package insert. Biocompatibles UK Ltd.; 2020. [Google Scholar]
- 8. Bastiaannet R, van Roekel C, Smits MLJ, et al. first evidence for a dose-response relationship in patients treated with 166Ho radioembolization: a prospective study. J Nucl Med. 2020;61:608–612. [DOI] [PubMed] [Google Scholar]
- 9. O JH, Lodge MA, Wahl RL. Practical PERCIST: a simplified guide to PET response criteria in solid tumors 1.0. Radiology. 2016;280:576–584. [DOI] [PMC free article] [PubMed] [Google Scholar]
- 10. Obuchowski NA. Nonparametric analysis of clustered receiver-operating-characteristic curve data. Biometrics. 1997;53:567–578. [PubMed] [Google Scholar]
- 11. Heinze G, Dunkler D. Avoiding infinite estimates of time-dependent effects in small-sample survival studies. Stat Med. 2008;27:6455–6469. [DOI] [PubMed] [Google Scholar]
- 12. Chan KT, Alessio AM, Johnson GE, et al. Prospective trial using internal pair-production positron emission tomography to establish the yttrium-90 radioembolization dose required for response of hepatocellular carcinoma. Int J Radiat Oncol Biol Phys. 2018;101:358–365. [DOI] [PubMed] [Google Scholar]
- 13. Vouche M, Habib A, Ward TJ, et al. Unresectable solitary hepatocellular carcinoma not amenable to radiofrequency ablation: multicenter radiology-pathology correlation and survival of radiation segmentectomy. Hepatology. 2014;60:192–201. [DOI] [PubMed] [Google Scholar]
- 14. Salem R, Gabr A, Riaz A, et al. Institutional decision to adopt Y90 as primary treatment for hepatocellular carcinoma informed by a 1,000‐patient 15‐year experience. Hepatology. 2018;68:1429–1440. [DOI] [PubMed] [Google Scholar]
- 15. Chiesa C, Mira M, Bhoori S, et al. Radioembolization of hepatocarcinoma with 90Y glass microspheres: treatment optimization using the dose-toxicity relationship. Eur J Nucl Med Mol Imaging. 2020;47:3018–3032. [DOI] [PubMed] [Google Scholar]
- 16. Garin E, Rolland Y, Pracht M, et al. High impact of macroaggregated albumin-based tumour dose on response and overall survival in hepatocellular carcinoma patients treated with 90Y-loaded glass microsphere radioembolization. Liver Int. 2017;37:101–110. [DOI] [PMC free article] [PubMed] [Google Scholar]
- 17. Wondergem M, Smits MLJ, Elschot M, et al. 99mTc-macroaggregated albumin poorly predicts the intrahepatic distribution of 90Y resin microspheres in hepatic radioembolization. J Nucl Med. 2013;54:1294–1301. [DOI] [PubMed] [Google Scholar]
- 18. Shady W, Kishore S, Gavane S, et al. Metabolic tumor volume and total lesion glycolysis on FDG-PET/CT can predict overall survival after 90Y radioembolization of colorectal liver metastases: a comparison with SUVmax, SUVpeak, and RECIST 1.0. Eur J Radiol. 2016;85:1224–1231. [DOI] [PMC free article] [PubMed] [Google Scholar]
- 19. Woff E, Hendlisz A, Ameye L, et al. Validation of metabolically active tumor volume and total lesion glycolysis as 18F-FDG PET/CT–derived prognostic biomarkers in chemorefractory metastatic colorectal cancer. J Nucl Med. 2019;60:178–184. [DOI] [PubMed] [Google Scholar]


