Abstract
Multiple inositol polyphosphate phosphatase (Minpp1) metabolizes inositol 1,3,4,5,6-pentakisphosphate (InsP5) and inositol hexakisphosphate (InsP6) with high affinity in vitro. However, Minpp1 is compartmentalized in the endoplasmic reticulum (ER) lumen, where access of enzyme to these predominantly cytosolic substrates in vivo has not previously been demonstrated. To gain insight into the physiological activity of Minpp1, Minpp1-deficient mice were generated by homologous recombination. Tissue extracts from Minpp1-deficient mice lacked detectable Minpp1 mRNA expression and Minpp1 enzyme activity. Unexpectedly, Minpp1-deficient mice were viable, fertile, and without obvious defects. Although Minpp1 expression is upregulated during chondrocyte hypertrophy, normal chondrocyte differentiation and bone development were observed in Minpp1-deficient mice. Biochemical analyses demonstrate that InsP5 and InsP6 are in vivo substrates for ER-based Minpp1, as levels of these polyphosphates in Minpp1-deficient embryonic fibroblasts were 30 to 45% higher than in wild-type cells. This increase was reversed by reintroducing exogenous Minpp1 into the ER. Thus, ER-based Minpp1 plays a significant role in the maintenance of steady-state levels of InsP5 and InsP6. These polyphosphates could be reduced below their natural levels by aberrant expression in the cytosol of a truncated Minpp1 lacking its ER-targeting N terminus. This was accompanied by slowed cellular proliferation, indicating that maintenance of cellular InsP5 and InsP6 is essential to normal cell growth. Yet, depletion of cellular inositol polyphosphates during erythropoiesis emerges as an additional physiological activity of Minpp1; loss of this enzyme activity in erythrocytes from Minpp1-deficient mice was accompanied by upregulation of a novel, substitutive inositol polyphosphate phosphatase.
Inositol 1,4,5-trisphosphate [Ins(1,4,5)P3], a second messenger for mobilization of intracellular Ca2+ stores, is produced by receptor-activated, phospholipase C-directed hydrolysis of membrane phosphoinositide (4). Ins(1,4,5)P3 is further metabolized to more phosphorylated inositols, of which the two most abundant are inositol 1,3,4,5,6-pentakisphosphate (InsP5) and inositol hexakisphosphate (InsP6) (18, 30). Maintenance of the cell's metabolic reservoirs of InsP5 and InsP6 is an important physiological activity. First, these polyphosphates are precursors for other biologically active inositol phosphates. For example, receptor-mediated activation of phospholipase C is coupled to an increased rate of metabolism of InsP5 to inositol 3,4,5,6-tetrakisphosphate, which blocks the activity of Ca2+-dependent Cl− channels in a number of cell types (31). InsP5 and InsP6 also are precursors for the diphosphorylated inositol phosphates, which are high-energy candidate molecular switches that may regulate vesicle trafficking (27). Second, InsP6 itself has been proposed to have a number of signaling roles, by regulating L-type Ca2+ channel activity, insulin exocytosis, and nuclear mRNA export (10, 16, 28, 37). Cellular signaling by inositol polyphosphates cannot be fully understood until we have identified the nature of the enzymes responsible for their metabolism. The favored candidate enzyme for controlling the size of the metabolic pools of InsP5 and InsP6 is multiple inositol polyphosphate phosphatase (Minpp1) (The rat and chick homologs of Minpp1 were originally named MIPP [multiple-inositol polyphosphate phosphatase] and HiPER1 [histidine phosphatase of the endoplasmic reticulum {ER} 1].) (1, 5, 7–9, 23, 26).
Minpp1 genes are conserved; homologous sequences have been identified in mammals, chicks, fruit flies, and plants. Minpp1 enzymes also share distant homology with yeast phytases (InsP6 phosphatases) (5, 7, 9, 26). The chick and rat forms of Minpp1 (HiPER1 and MIPP) are highly expressed in growth plate chondrocytes transiting from proliferation to hypertrophy, indicating a potential role for the inositol polyphosphates in chondrocyte differentiation (5, 25, 26). Chondrocyte differentiation in the growth plate involves a series of phenotypic changes reflected in the alterations in the cell cycle and matrix synthesis, and it is the basis for longitudinal bone growth (6, 14).
There is a problem that has impeded our understanding of Minpp1 activity in vivo. Minpp1 is compartmentalized in the lumen of the ER (1, 26), thereby limiting the accessibility of this enzyme to the predominantly cytosolic pools of inositol polyphosphates (34). Indeed, there has been no prior demonstration that changes in Minpp1 expression have any impact on the cellular levels of inositol phosphates. This situation has raised concerns as to the physiological activity of Minpp1. We sought new information to resolve this problem by using two complementary approaches; the effects on cellular inositol phosphate levels were analyzed following either elimination of Minpp1 activity by targeted deletion or increased Minpp1 activity by retrovirus-mediated overexpression.
Another issue addressed in this study is the relationship between ER-based Minpp1 and an inositol polyphosphate phosphatase activity localized to the plasma membrane in erythrocytes (11). The identity of the latter enzyme is unknown, but it exhibits several similarities to the ER-based Minpp1: the two enzymes have epitopes in common, and both can cleave the 3-phosphate from inositol 1,3,4,5-tetrakisphosphate [Ins(1,3,4,5)P4] in vitro (8, 11). In this study, we examined the impact of the Minpp1 gene deletion on this erythrocyte phosphatase activity, and we report that this particular enzyme activity is also encoded by the Minpp1 gene.
The results from this study represent the first demonstration that Minpp1 plays a role in regulating the cellular levels of InsP5 and InsP6 in vivo and also provide an understanding of the importance of restricting the access of Minpp1 to these substrates. We also describe analysis of Minpp1 expression during mouse development and characterization of the phenotypes of Minpp1-deficient mice. Surprisingly, Minpp1 deletion has no overt effects on mouse development or chondrocyte differentiation.
MATERIALS AND METHODS
Generation of mice with a targeted deletion of Minpp1.
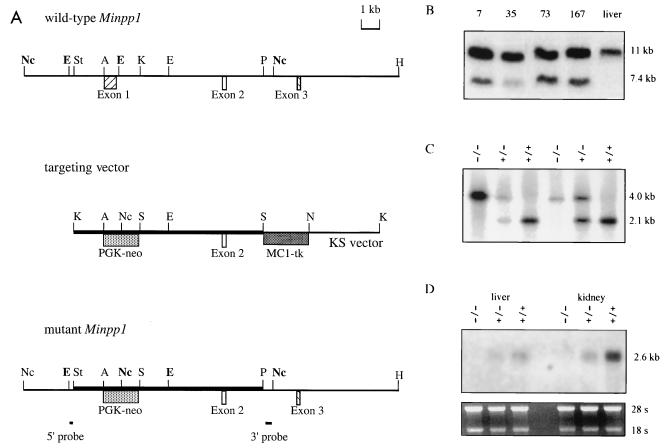
Approximately 7 kb of Minpp1 genomic DNA from mouse strain 129/Sv (7) was used to construct a gene replacement vector in pBlueScript KS (Stratagene, La Jolla, Calif.). The targeting vector contained a neomycin resistance gene (neo) cassette (PGK-neo, with the mouse PGK-1 promoter upstream of neo) for positive selection and a thymidine kinase gene (tk) cassette (MC1-tk, with the MC1 promoter upstream of herpes simplex virus tk) for negative selection. For construction of the targeting vector, a 1.1-kb StyI-ApaI fragment 5′ to Minpp1 exon 1 was converted to a KpnI-ApaI fragment by linker addition and cloned upstream of the 1.6-kb PGK-neo fragment. Then MC1-tk was cloned as a 2.0-kb SalI-NotI fragment downstream of the 1.1-kb Minpp1 sequence and PGK-neo. Last, a 5.5-kb KpnI-PstI fragment 3′ to Minpp1 exon 1 was converted to a 5.5-kb SalI-SalI fragment by linker addition, and this fragment was cloned into the plasmid between PGK-neo and MC1-tk. Thus, the targeting vector contained, in order, 1.1-kb Minpp1 sequence 5′ to exon 1, PGK-neo, 5.5-kb Minpp1 sequence 3′ to exon 1, and MC1-tk. The targeting vector was linearized at the unique KpnI site upstream of the 5′ Minpp1 sequence (see Fig. 2A).
FIG. 2.
Targeted deletion of Minpp1 by homologous recombination. (A) Targeting strategy. Homologous recombination between the Minpp1 wild-type allele (top) and the targeting vector (middle) substitutes neo for a 2-kb endogenous sequence containing all of the coding sequence of exon 1 and part of intron 1 (bottom). Two probes for screening ES cells and genotyping mice are also shown: 5′ probe, a 0.18-kb EcoRI-StyI fragment; 3′ probe, a 0.4-kb PstI-NcoI fragment. Boldface EcoRI and NcoI sites mark the sizes of the hybridized fragments on Southern blots. Nc, NcoI; E, EcoRI; St, StyI; A, ApaI; K, KpnI; P, PstI; H, HindIII; S, SalI; N, NotI. (B) Southern blot analysis of ES cell clones. DNA was digested with NcoI and hybridized to the 3′ probe. The wild-type allele is 11.0 kb in length, and the mutant allele is 7.4 kb. Shown are four targeted ES cell clones and control liver DNA from a wild-type mouse. (C) Southern blot analysis of EcoRI-digested mouse tail DNA. The 5′ probe detected a 2.1-kb fragment from the wild-type allele and a 4.0-kb fragment from the mutant allele. Mice of all genotypes were identified from the Minpp1 heterozygous crosses. +/+, wild type; +/−, heterozygous mutant; −/−, homozygous mutant. (D) Northern blot analysis of liver and kidney RNA from Minpp1+/+, Minpp1+/−, and Minpp1−/− mice with a Minpp1 cDNA probe containing all of the protein coding sequence. Minpp1 message was undetectable in the Minpp1−/− tissues (top). rRNAs stained with ethidium bromide were used as loading controls (bottom).
The targeting vector was electroporated into embryonic day 14.1 (E14.1) embryonic stem (ES) cells, and G418- and ganciclovir-resistant colonies were selected and maintained as described elsewhere (33). Initial screening for homologous recombinants was performed by EcoRI digestion of genomic DNA and hybridization with a 0.18-kb EcoRI-StyI fragment (5′ probe), which is 5′ to the Minpp1 genomic sequence contained in the targeting vector. The candidate ES cell clones were expanded and analyzed by additional Southern blotting to verify the success of the targeting event. A 0.4-kb PstI-NcoI fragment (3′ probe), 3′ to the genomic sequence contained in the targeting vector, was used to probe NcoI digests of genomic DNA from candidate cell lines. The absence of additional random integration of the targeting vector was verified by Southern blot analysis using an internal neo probe.
Four independent ES cell clones were used to generate the chimeric mice. Germ line chimeras were identified by the presence of ES cell-derived agouti color in their offspring after test mating with Swiss black or CD1 mice. Two germ line male chimeras were produced by microinjection of ES cell clones 73 and 35 into C57BL/6 blastocysts and B6D2F1 morulas, respectively. They were mated with 129/ReJ and C57BL/6 females, and mice heterozygous for the Minpp1 allele were identified by Southern blot analysis using the 5′ probe. Mice homozygous for Minpp1 mutation were obtained by crossing the heterozygotes. Also, PCR was routinely used to genotype the F2 mice (data not shown).
Total RNA from mouse tissues was isolated using RNAzol reagent (Tel-Test) and analyzed by Northern blotting as described elsewhere (25).
Purification of Minpp1 and enzyme activity assay.
Perfused brains (0.45 g) from Minpp1+/+ or Minpp1−/− mice were minced with a pair of scissors and homogenized in 1.5 ml of buffer containing 1 mM EDTA, 1 mM EGTA, 0.25 M sucrose, 0.5% (wt/vol) CHAPS {3-[(3-cholamidopropyl)-dimethylammonio]-1-propanesulfonate}, and 10 mM HEPES (pH 7.4). The homogenate was diluted with 8 ml of buffer A (10 mM triethylamine plus 0.5% [wt/vol] CHAPS [pH 7.4]) and centrifuged at 30,000 × g for 30 min. The resultant supernatant was filtered (0.45-μm-pore-size filter) and loaded (1 ml/min) on to a heparin-agarose IIs column (1.6 by 12 cm), which was then washed with 60 ml of buffer A. Fractions of 8 ml from the loading and washing volumes were collected. The bound protein was eluted (1 ml/min) with 60 ml of a 0 to 0.5 M NaCl salt gradient generated by mixing of buffer A and buffer B (buffer A plus 1 M NaCl), and 4-ml fractions were collected. The fractions from load and wash were pooled, applied to a MonoQ column (0.5 by 5 ml), and washed with 15 ml of buffer C (10 mM Tris-HCl [pH 7.2]) at a constant flow rate of 0.5 ml/min; 6-ml fractions were collected. The bound protein was eluted with 6 ml of a 0 to 0.3 M NaCl gradient, and 0.4-ml fractions were collected.
Erythrocytes were isolated from peripheral blood of Minpp1+/+ or Minpp1−/− mice using Lymphoprep (Nycomed Pharma AS, Oslo, Norway) and solubilized for 1 h at 4°C in an equal volume of buffer comprising 10 mM Bis-Tris (pH 7.4), 1 mM EDTA, 4% (wt/vol) CHAPS, 1 μg of leupeptin/ml, and 0.1 μg of aprotinin/ml. A 6-ml aliquot of erythrocyte extracts was diluted in 24 ml of buffer A and applied to a heparin-agarose IIs column (2 by 12 cm). The column was washed with 100 ml of buffer A. Eleven 12-ml fractions were collected from the column flowthrough and wash. Bound protein was eluted with an NaCl gradient as described above, and 4-ml fractions were collected. The fractions from load and wash were pooled and loaded onto the MonoQ column (see above); 12-ml fractions were collected. The bound protein was eluted with 6 ml of a 0 to 0.3 M NaCl gradient, and 0.4-ml fractions were collected.
Aliquots of the column-purified fractions were incubated with approximately 10,000 dpm of either [3H]Ins(1,3,4,5)P4 (NEN, Boston, Mass.) or [3H]Ins(1,3,4,5,6)P5 (prepared as described elsewhere [32]) for 60 to 120 min at 37°C in a final volume of 100 μl of buffer containing 50 mM KCl, 50 mM HEPES (pH 7.0 with KOH), 1 mM EDTA, 4 mM CHAPS, and 0.5 mg of bovine serum albumin/ml. Assays were quenched with 0.9 ml of 0.5 mM EDTA–0.1 M formic acid–0.2 M ammonium formate, and the degree of inositol polyphosphate hydrolysis was determined after chromatography on gravity-fed anion-exchange columns (29).
Histological analysis and in situ hybridization.
Mouse proximal tibias were fixed in 4% paraformaldehyde, decalcified in EDTA, embedded in paraffin, sectioned, and stained with hematoxylin-eosin (H&E). Mouse soft tissues were processed similarly without the decalcification step. For in situ hybridization, tissue sections were treated with proteinase K (20 μg/ml) for 5 min, with 0.1% sodium borohydride for 3 min, and finally with 5% acetic anhydride in 0.1 M triethanolamine (pH 8.0) for 10 min. After dehydration through a series of ethanol washes, the sections were dried and hybridized overnight at 55°C in a mixture containing 50% formamide, 0.3 M NaCl, 20 mM Tris-HCl (pH 8.0), 5 mM EDTA, 10% dextran sulfate, 1× Denhardt's solution, 0.5 mg of yeast tRNA/ml, and 107 cpm of probe/ml. Riboprobes were prepared and labeled with [35S]UTP to a specific activity of 109 dpm/μg by in vitro transcription reaction. The probe for Minpp1 was a 220-bp BclI-HindIII cDNA fragment (nucleotides 690 to 908 in GenBank entry AF046908). The probes for mouse type II and type X collagens were a gift from Eero Vuorio (University of Turku, Turku, Finland). Posthybridization washes were performed as follows: 30 min of 5× SSC (1× SSC is 0.15 M NaCl plus 0.015 M sodium citrate) plus 40 mM β-mercaptoethanol (β-ME) at 55°C; 30 min of 50% formamide–1× SSC plus 40 mM β-ME at 55°C; 60 min of RNase A (20 μg/ml) in 1× NTE buffer (0.5 M NaCl, 10 mM Tris-HCl [pH 8.0], 5 mM EDTA) at 37°C; and 60 min of 50% formamide–1× SSC plus 40 mM β-ME at 55°C. Slides were then dehydrated, dried, coated with NBT2 emulsion for autoradiography, and exposed at 4°C for 2 days (for collagen probes) or 20 days (for Minpp1 probes). Slides were developed in D19 (Eastman Kodak, Rochester, N.Y.), and the tissues were counterstained with hematoxylin.
Culture and growth rate analysis of MEF and NIH 3T3 cells.
Minpp1 heterozygous mice were mated, and embryos were collected at E14.5. Mouse embryonic fibroblasts (MEF) were prepared by overnight cold trypsin digestion and then genotyped. There was no difference in the growth rate between Minpp1+/+ and Minpp1−/− MEF. MEF were used between passages 2 and 4 in all experiments. NIH 3T3 cells were obtained from the American Type Culture Collection (Manassas, Va.). MEF and NIH 3T3 cells were maintained in high-glucose Dulbecco modified Eagle medium (Gibco/BRL, Rockville, Md.) with the addition of 10% heat-inactivated fetal bovine serum (HyClone, Logan, Utah). For growth curve analysis, 105 cells were plated in 10-cm-diameter plates, and at the indicated time, cell number was determined from two identical plates and averaged. For thymidine incorporation assay, 2 × 10⁴ cells were plated in 24-well plates and incubated with [3H]thymidine (Amersham, Piscataway, N.J.) at 2 μCi/ml overnight. Labeled cells were washed twice with ice-cold phosphate-buffered saline (PBS) and twice with 5% trichloroacetic acid, air dried, and dissolved in 1 N NaOH plus 0.1% Triton X-100. An aliquot was taken for measurement of radioactivity.
Retrovirus-mediated Minpp1 expression.
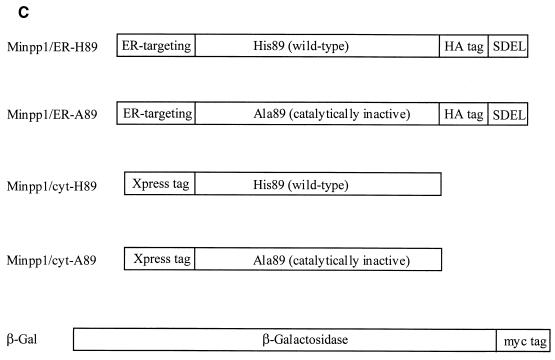
PCR was used to incorporate a hemagglutinin epitope (HA) tag (YPYDVPDYA) into the reading frame of mouse Minpp1 and Minpp1-A89 (the latter has the active-site histidine mutated to alanine [7]) to generate Minpp1/ER-H89 and ER-A89 constructs. The HA tag was placed close to the C terminus of Minpp1, upstream of the ER retention signal SDEL. Such a strategy has been shown to not interfere with ER localization of other lumenal ER proteins (20, 21). Localization of Minpp1 was confirmed by immunofluorescence staining (see Results). To express Minpp1 in the cytosol (Minpp1/cyt-H89 and cyt-A89 constructs), the putative N-terminal ER-targeting sequence (Met1 through Ala28 [7]) and the C-terminal ER retention sequence (SDEL) were deleted from the Minpp1 reading frame by PCR-based methods. The resulting PCR products were subcloned into the pcDNA3.1/HisC vector (InVitrogen, Carlsbad, Calif.); consequently, an Xpress tag (DLYDDDDK) was incorporated into the N terminus of the cytosolic forms of Minpp1. Last, all of the Minpp1 expression constructs were cloned into pLPCX and pLNCX (Clontech, Palo Alto, Calif.) vectors to generate retroviral expression vectors (see Fig. 6C).
FIG. 6.
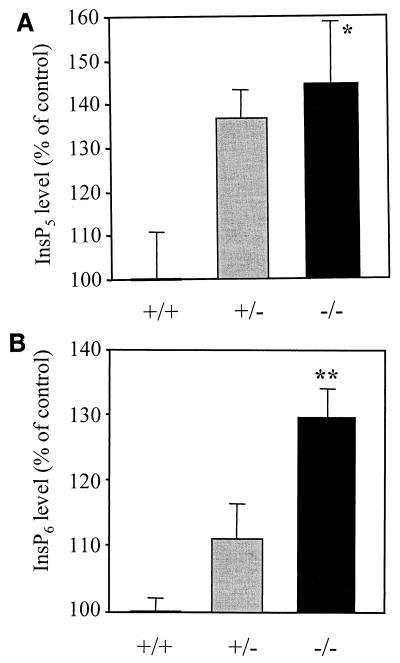
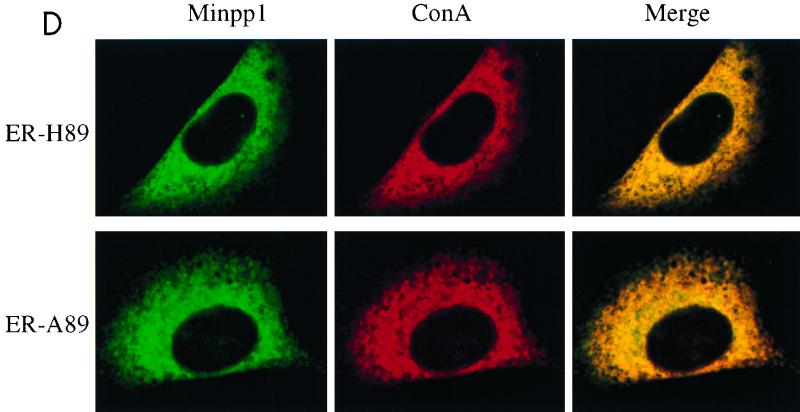
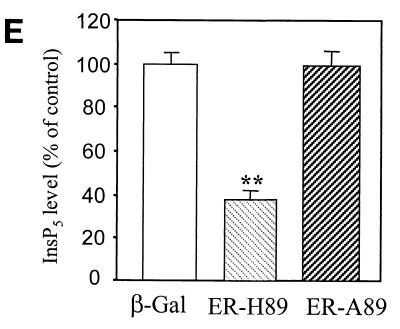
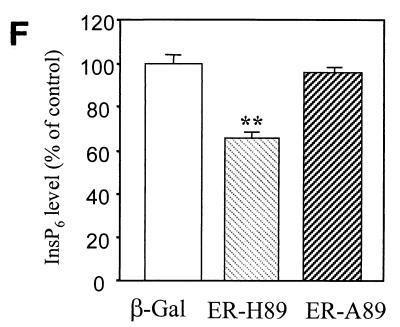
Analyses of InsP5 and InsP6 levels in Minpp1+/+ and Minpp1−/− MEF. (A and B) Primary MEF of Minpp1+/+, Minpp1+/−, and Minpp1−/− were labeled with [3H]inositol to isotopic equilibrium. Inositol phosphates were extracted and analyzed by HPLC. Original ratios of [3H]InsP5 to [3H]inositol lipids (A) were as follows (mean ± standard error): Minpp1+/+ MEF (+/+), 0.00284 ± 0.00030; Minpp1+/− MEF (+/−), 0.00388 ± 0.00018; and Minpp1−/− MEF (−/−), 0.00410 ± 0.00039. Corresponding ratios of [3H]InsP6 to [3H]inositol lipids (B) were 0.02213 ± 0.00045, 0.02465 ± 0.00111, and 0.02871 ± 0.00086. ∗, P < 0.05 and ∗∗, P < 0.001 compared with levels in Minpp1+/+ MEF (n = 5, one-way ANOVA). Levels of InsP5 (A) and InsP6 (B) are shown as percentages of those in Minpp1+/+ MEF. (C) Schematic diagram of retroviral constructs. Note that the map is not drawn to scale. (D) Localization of exogenous Minpp1 to the ER. Overexpressed Minpp1 proteins in Minpp1−/− MEF were stained with anti-HA antibody followed by FITC-labeled anti-mouse secondary antibody. Rhodamine-ConA staining revealed the ER morphology (35, 36). Colocalization of Minpp1 and ConA was indicated by the yellow color in the merged images. Cells expressing β-Gal did not show any detectable staining with anti-HA antibody. Minpp1 also colocalized with a known lumenal ER protein, BiP/GRP78 (data not shown). (E and F) Cellular levels of InsP5 (E) and InsP6 (F) were analyzed in Minpp1−/− MEF stably expressing a β-Gal control, catalytically active Minpp1/ER-H89, and inactive ER-A89. Original ratios of [3H]InsP5 to [3H]inositol lipids (E) were as follows (mean ± standard error): β-Gal, 0.00536 ± 0.00023; ER-H89, 0.00202 ± 0.00020; and ER-A89, 0.00532 ± 0.00035. Corresponding ratios of [3H]InsP6 to [3H]inositol lipids (F) were 0.02963 ± 0.00109, 0.01941 ± 0.00066, and 0.02837 ± 0.00047. ∗, P < 0.05 and ∗∗, P < 0.001 compared with levels in β-Gal-expressing cells (n = 3, one-way ANOVA). Levels of InsP5 (E) and InsP6 (F) are shown as percentages of those in β-Gal-expressing cells.
293GP cells were plated at 5 × 10⁶/10-cm-diameter plate. After 24 h, they were transiently transfected with 10 μg of retroviral constructs and 2.5 μg of vesicular stomatitis virus G protein (22), using Superfect reagents (Qiagen, Valencia, Calif.) according to the manufacturer's instructions; 48 to 72 h after transfection, the supernatants containing recombinant retroviruses were removed, mixed with Polybrene at 4 μg/ml, and added to target MEF or NIH 3T3 cells; 12 h after infection, the recombinant viruses were collected from 293GP cells a second time and the infection was repeated. Thus, target cells were incubated with the viruses for a total of 24 h before the viral supernatants were replaced with fresh medium. Puromycin (1.0 μg/ml) or neomycin (1.0 mg/ml) selection started 12 to 24 h later and lasted 4 to 7 days. Pools of stably transduced cells were then analyzed for the expression of Minpp1 by Western blotting and immunofluorescence (see below). Cells expressing a β-galactosidase (β-Gal) construct in the same retroviral vectors were used as a control in all experiments. For each construct, at least three independent cell pools were generated and used in all experiments to minimize clonal variation.
Western blotting and immunofluorescence.
Aliquots of 20 μg of protein extracts from MEF or NIH 3T3 cells were separated on a sodium dodecyl sulfate-polyacrylamide gel and then immunoblotted with anti-HA (16B12; BAbCo, Richmond, Calif.) or anti-Xpress (InVitrogen) antibody. The bound antibody was then detected by horseradish peroxidase-conjugated goat anti-mouse immunoglobulin G and visualized by enhanced chemiluminescence (Amersham). For immunofluorescence, cells were cultured in eight-well chamber slides (Nalgene, Rochester, N.Y.), fixed in 4% cold paraformaldehyde in PBS for 10 min, and then permeabilized with 0.1% Triton X-100 in PBS for 4 min at room temperature. After blocking in 5% donkey serum, permeabilized cells were incubated with monoclonal anti-HA (1:1,000) or anti-Xpress (1:400) antibody at 4°C overnight. Cells were then incubated for 30 min at room temperature with solutions containing fluorescein isothiocyanate (FITC)-labeled donkey anti-mouse secondary antibody diluted at 1:200 (Jackson ImmunoResearch, West Grove, Pa.) and 2 μg of rhodamine-concanavalin A (ConA) (Vector Laboratories, Burlingame, Calif.) per ml. Slides were mounted with Vectashield medium (Vector Laboratories) and analyzed with a confocal fluorescence microscope (Leica) at a magnification of ×1,000.
[3H]inositol labeling and HPLC separation of cellular inositol phosphates.
MEF or NIH 3T3 cells (2.5 × 10⁴) were plated into 24-well plates and labeled with [3H]inositol (Amersham Radiolabeled Chemicals) at 60 μCi/ml in the culture medium (see above) for 5 days. Cells were quenched with 0.3 ml of 0.6 M cold perchloric acid containing 0.1 mg of InsP6 per ml for 15 min on ice, and the supernatants were then collected and neutralized with 90 μl of 1 M K2CO3–5 mM EDTA. Inositol phosphates were separated by high-performance liquid chromatography (HPLC) using a 250 by 4.6-mm Synchropak Q100 SAX column (Thompson Instruments, Chantilly, Va.) eluted with the following gradient, generated by mixing water with buffer B [2 M (NH4)H2PO4 (pH 3.35 with H3PO4)]: 0 to 5 min, 0% B; 5 to 240 min, 0 to 65% B. The flow rate was 0.5 ml/min. The eluate was mixed on-line with 3 vol of Monoflow-4 scintillant (National Diagnostics, Atlanta, Ga.), and 3H-labeled inositol phosphates were detected with a Radiometric D515 flow scintillation analyzer (Packard Instrument Co., Meriden, Conn.). Levels of 3H-labeled inositol phosphates were normalized against [3H]inositol lipids, which were extracted from the perchloric acid-insoluble fraction that remained after removal of the soluble inositol phosphates (see above). The inositol lipids were extracted with 0.3 ml of 100 mM NaOH–0.1% Triton X-100, and aliquots were counted for 3H radioactivity. All data were analyzed with one-way analysis of variance (ANOVA) for statistical significance: P < 0.05, significant; P < 0.001, very significant.
RESULTS
Expression of Minpp1 during mouse embryogenesis.
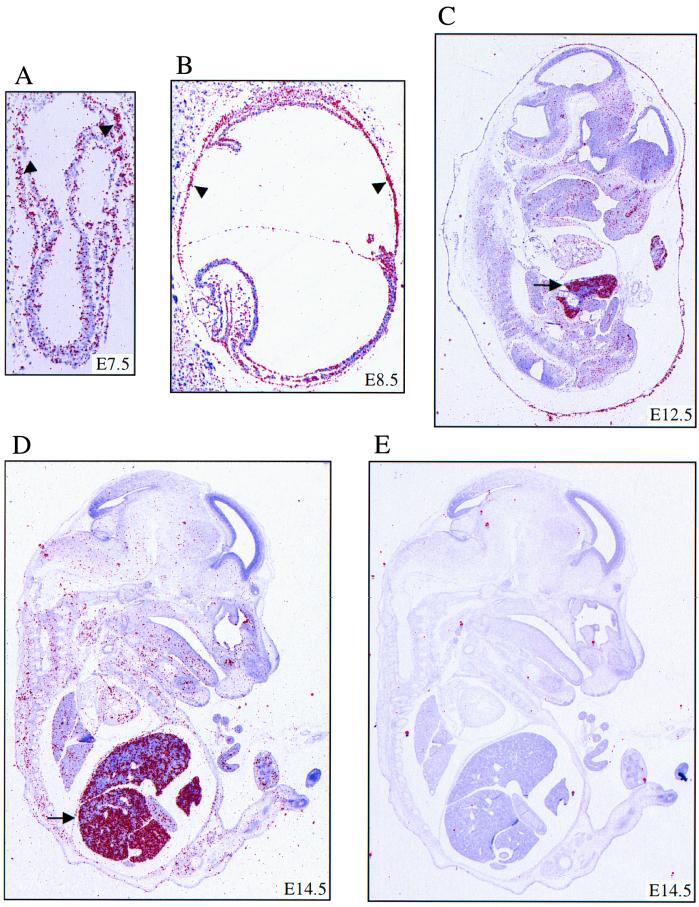
In preparation for our study of mice with a targeted deletion of Minpp1, we analyzed expression of Minpp1 during embryonic development. In situ hybridization was performed to determine the spatial distribution of Minpp1 mRNA at different stages of mouse embryogenesis, from E7.5 through E14.5. The highest levels of Minpp1 expression were found in the visceral endoderm at E7.5 and E8.5 and in the fetal liver at E12.5 and E14.5 (Fig. 1). Low levels of Minpp1 transcript were also detected in other tissues at these developmental stages (Fig. 1). Minpp1 is also likely expressed at early stages of mouse development, as expressed sequence tag cDNA clones containing Minpp1 nucleotide sequences have been identified in mRNA libraries from embryos of 2-, 4-, 8-, and 16-cell stages as well as in ES cells. Taken together, these observations demonstrate that Minpp1 is widely expressed during mouse development, with a higher abundance in visceral endoderm and fetal liver.
FIG. 1.
Expression of Minpp1 during mouse embryogenesis. In situ hybridization with 35S-labeled Minpp1 antisense probe was performed on mouse embryos at E7.5 (A), E8.5 (B), E12.5 (C), and E14.5 (D). An E14.5 embryo was hybridized with Minpp1 sense probe as a control (E). Shown are composite images generated by overlaying the dark field signal (red) with hematoxylin-counterstained tissues (blue). Minpp1 mRNA was widely expressed, and the highest level was seen in the visceral endoderm (arrowheads in panels A and B) and fetal liver (arrows in panels C and D).
Generation of Minpp1-deficient mice.
A null allele of Minpp1 was generated by homologous recombination in ES cells (see Materials and Methods). The strategy chosen was to delete all of the coding sequence of mouse Minpp1 exon 1, since this exon includes the active site (7) (Fig. 2A). Southern blot analysis identified homologous recombination in approximately 4% of the transfected ES cell clones (12 mutant clones out of 292 clones analyzed) (Fig. 2B). Independently derived mutant ES cell clones were used to generate Minpp1+/− and Minpp1−/− mice in 129 inbred and 129 × C57BL/6 mixed genetic backgrounds (Fig. 2C). In the progeny from Minpp1+/− crosses, the distribution of Minpp1+/+, Minpp1+/−, and Minpp1−/− was consistent with Mendelian segregation. In 215 mice of 129 × C57BL/6 mixed background analyzed, 24.2, 49.8, and 26.0% were Minpp1+/+, Minpp1+/−, and Minpp1−/−, respectively; in 56 mice of 129 inbred background analyzed, the percentages were 26.8, 46.4, and 26.8.
To verify that the targeted deletion of Minpp1 exon 1 produced a null mutation, DNA and RNA blot analyses were performed on tissue extracts from Minpp1+/+ and Minpp1−/− mice. A probe spanning the entire exon 1 hybridized to the genomic DNA from Minpp1+/+ mice but not to DNA from Minpp1−/− mice (data not shown). Minpp1 message was undetectable in the tissues of Minpp1−/− mice and was weaker in Minpp1+/− mice than in Minpp1+/+ mice (Fig. 2D).
Loss of Minpp1 enzyme activity in Minpp1-deficient mice.
A convenient method for measuring Minpp1 activity is to assay the Mg2+-independent hydrolysis of Ins(1,3,4,5)P4 and InsP5 (23). However, before Minpp1 activity in tissue homogenates can be assayed with accuracy, the protein must be released from the ER and separated from endogenous inhibitors of enzyme activity (13). The enzyme from brains was first solubilized with CHAPS, and the CHAPS-soluble fraction was then chromatographed on a heparin-agarose column. Approximately 60 to 65% of total Minpp1 activity from Minpp1+/+ brain bound to the column (Fig. 3A and B). There was no detectable activity in extracts prepared from Minpp1−/− brain (Fig. 3A and B). The fractions containing Minpp1 activity that did not bind to the column, and the corresponding fractions from the Minpp1−/− extracts, were each separately chromatographed on a MonoQ anion-exchange column. Almost all of the Minpp1 activity now bound to the column (Fig. 3C and D), but again, there was no detectable activity in the extracts from Minpp1−/− mice (Fig. 3C and D). In similar experiments, Minpp1 activity could not be detected in livers from Minpp1−/− mice (data not shown). These data further confirm the success of the targeted deletion of the Minpp1 gene.
FIG. 3.
Minpp1 enzyme activity in Minpp1+/+ and Minpp1−/− brain extracts. Minpp1 was solubilized from the brains of Minpp1+/+ (closed circles) and Minpp1−/− mice (open circles) and chromatographed on a heparin-agarose column (A and B). Fractions 1 to 8, which represent the loading and wash volumes, were rechromatographed on a MonoQ anion-exchange column (C and D). Minpp1 activity against either Ins(1,3,4,5)P4 (A and C) or InsP5 (B and D) was assayed using trace amounts of 3H-labeled substrate as indicated in Materials and Methods. The first-order rate constant was calculated and expressed as total activity per fraction.
The Minpp1 gene encodes an inositol polyphosphate phosphatase activity that is located in the plasma membranes of erythrocytes.
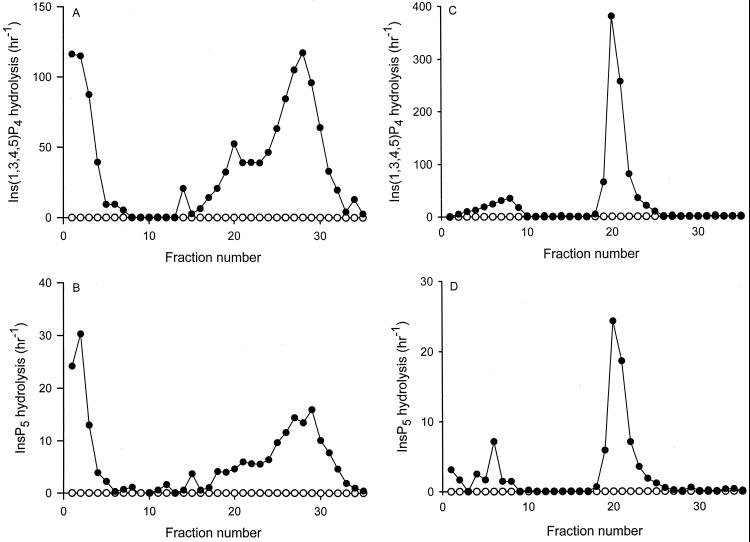
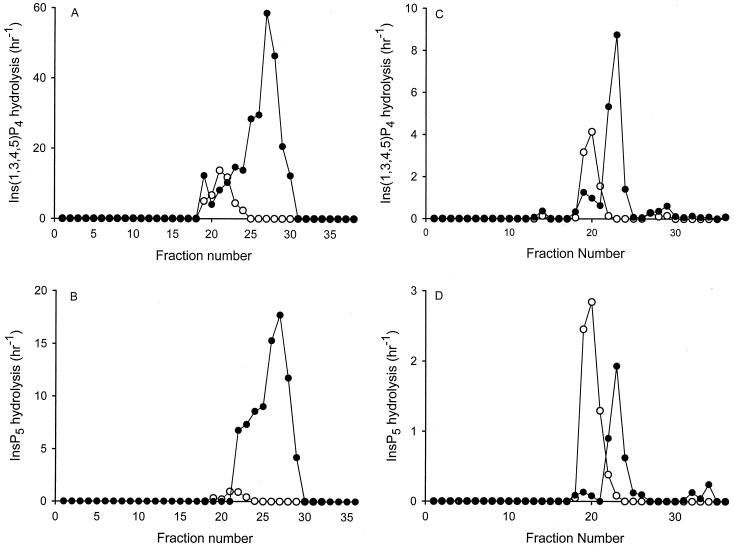
It has been reported that the plasma membrane of erythrocytes contains a Mg2+-independent Ins(1,3,4,5)P4 phosphatase activity that shares epitopes with the ER-based Minpp1 (8, 11). We have further investigated the relationship between these two enzyme activities by determining if this erythrocyte phosphatase activity was affected in the Minpp1−/− mice (Fig. 4). Erythrocytes were purified from Minpp1+/+ and Minpp1−/− mice and treated with CHAPS to prepare a detergent-soluble extract. The extracts were chromatographed on a heparin-agarose column (Fig. 4A and B). A peak of Ins(1,3,4,5)P4/InsP5 phosphatase activity bound to the column, and this was greatly reduced in the extracts prepared from the erythrocytes of Minpp1−/− mice. This result is consistent with erythrocytes containing an Ins(1,3,4,5)P4/InsP5 phosphatase that is encoded by the Minpp1 gene.
FIG. 4.
Minpp1 enzyme activity in Minpp1+/+ and Minpp1−/− erythrocytes. Minpp1 was solubilized from the erythrocytes of Minpp1+/+ (closed circles) and Minpp1−/− mice (open circles) and chromatographed on a heparin-agarose column (A and B). Fractions 1 to 11, which represent the loading and wash volumes, were rechromatographed on a MonoQ anion-exchange column (C and D). Minpp1 activity against either Ins(1,3,4,5)P4 (A and C) or InsP5 (B and D) was assayed using trace amounts of 3H-labeled substrate as indicated in Materials and Methods. The first-order rate constant was calculated and expressed as total activity per fraction. Note that the units of activity in panels C and D are one sixth that of panels A and B.
Another intriguing observation that arises from the experiments with erythrocytes is that Ins(1,3,4,5)P4/InsP5 phosphatase activity was not completely eliminated in the Minpp1−/− mice (Fig. 4A and B). Compared to the Minpp1+/+ extracts, the column fractions prepared from the Minpp1−/− mice contained approximately 17% of the total Ins(1,3,4,5)P4 phosphatase activity and 3.8% of the total InsP5 phosphatase activity. However, the elution position of the peak of the Minpp1+/+ Ins(1,3,4,5)P4 phosphatase was different from the corresponding peak obtained from the Minpp1−/− mice (Fig. 4A), suggesting that two different Ins(1,3,4,5)P4 phosphatase activities are involved. We confirmed this distinction through chromatography of the loading and wash volumes of the heparin column fractions on a separate MonoQ anion-exchange column (Fig. 4C and D).
In the extracts from Minpp1+/+ cells, an additional 5 to 8% of Ins(1,3,4,5)P4/InsP5 phosphatase activity was identified in the MonoQ column fractions (Fig. 4C and D) that was not originally detected when this material eluted in the loading and wash volumes of the heparin-agarose column (Fig. 4A and B). This observation is probably due to concentration of the enzyme activity by the MonoQ column and/or separation of Minpp1 from endogenous inhibitors in the heparin column load and wash (13, 23). It was again notable that this peak of Minpp1 activity was missing from the Minpp1−/− mice (Fig. 4C and D). However, the extracts prepared from Minpp1−/− mice did contain a different peak of Ins(1,3,4,5)P4/InsP5 phosphatase activity (Fig. 4C and D). This result suggests that there has been upregulation of a novel Ins(1,3,4,5)P4/InsP5 phosphatase in the erythrocytes of Minpp1−/− mice, presumably to compensate for the loss of Minpp1 enzyme activity.
Phenotypic analyses of Minpp1-deficient mice.
Minpp1−/− mice were viable and fertile, and they did not show a distinct phenotype compared with the Minpp1+/+ littermates. Size and weight examination at different ages did not reveal consistent differences. Minpp1−/− mice have been housed in a pathogen-free environment for 2 years without obvious physiological defects. This was true for Minpp1 mutation in all of the different genetic backgrounds analyzed, including 129 inbred background, 129 × C57BL/6, 129 × Swiss black, and 129 × CD1 mixed backgrounds. Thus, the genetic backgrounds did not appear to influence the phenotypic penetrance of the Minpp1 mutation. Histological examination of various tissues and major internal organs failed to identify any prominent structural abnormalities in Minpp1−/− mice.
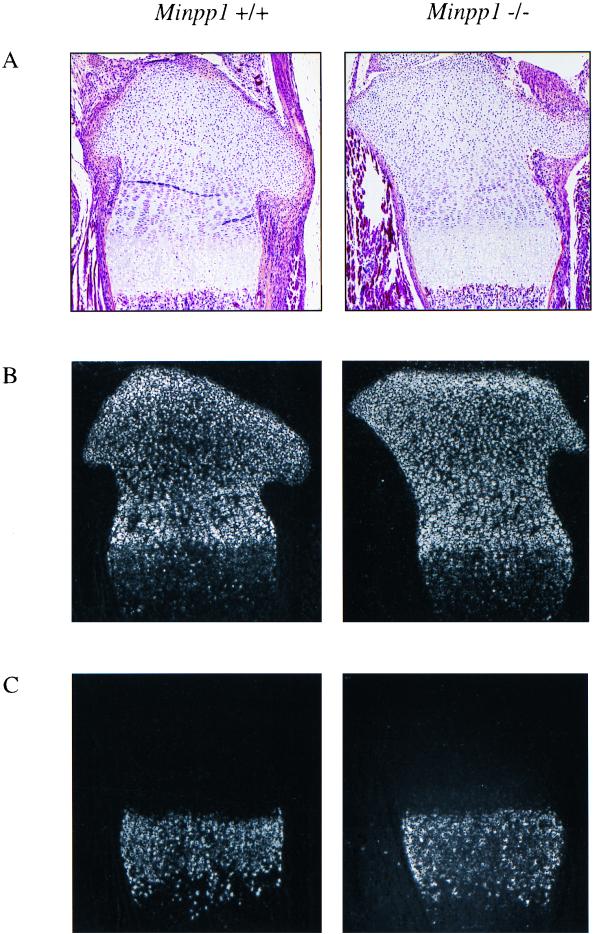
Transient high-level expression of Minpp1 in chick and rat growth plates implies an important role for this gene in chondrocyte differentiation (5, 25, 26). However, Minpp1−/− mice apparently underwent normal chondrocyte differentiation and bone development, as revealed by macroscopic, histological, and molecular analysis. Morphology of the skeletal system was comparable between Minpp1+/+ and Minpp1−/− mice, analyzed by staining of newborn mouse skeleton with alcian blue and alizarin red S, and radiological examination of the adult animals. Histological staining was performed on the proximal tibia sections of Minpp1+/+ and Minpp1−/− mice at different ages, including 2 days, 3 weeks, 3 months, and 1 year. Strains used included H&E to visualize general cellular structures, Von Kossa's stain to assess bone mineralization, and toluidine blue to detect proteoglycans of the cartilage. No obvious differences were detected in the staining patterns between the Minpp1+/+ and Minpp1−/− mice (Fig. 5A). The expression patterns of two chondrocyte markers, type II and type X collagens, were analyzed by in situ hybridization on tibia sections. Type II collagen is a general marker for chondrocytes, while type X collagen is a specific marker for hypertrophic chondrocytes. The expression patterns of type II and type X collagens were indistinguishable between Minpp1+/+ and Minpp1−/− mice (Fig. 5B and C).
FIG. 5.
Normal chondrocyte differentiation in Minpp1−/− mice. Proximal tibia sections from 2-day-old Minpp1+/+ and Minpp1−/− mice were stained with H&E (A). Expression of type II (B) and type X (C) collagens was analyzed by in situ hybridization; dark-field images are shown. Slight variations were due to differences in the plane of section and were not a consistent finding.
InsP5 and InsP6 are in vivo substrates for Minpp1.
The Ins(1,3,4,5)P4/InsP5 phosphatase activity of Minpp1 provides a convenient means of assaying enzyme activity in vitro (see above), although kinetic assays have indicated that InsP5 and InsP6 are likely to be the preferred substrates in vivo (23). Nevertheless, there has been no prior demonstration that inositol polyphosphates have access to Minpp1 in vivo. We have now addressed this issue by investigating if changes in Minpp1 expression have any impact on inositol phosphate levels in cells. MEF were isolated from E14.5 embryos of Minpp1+/+, Minpp1+/−, and Minpp1−/−. They were labeled with [3H]inositol to isotopic equilibrium, then inositol phosphates were extracted and resolved by HPLC. In Minpp1−/− MEF, the cellular levels of InsP5 and InsP6 were increased up to 45 and 30%, respectively, compared with Minpp1+/+ MEF (Fig. 6A and B). Among all of the inositol phosphates analyzed, only InsP5 and InsP6 showed consistent and significant differences between Minpp1+/+ and Minpp1−/− MEF (data not shown). These results represent the first direct evidence that InsP5 and InsP6 are in vivo substrates for Minpp1.
To confirm the role of Minpp1 in the metabolism of inositol polyphosphates, exogenous wild-type Minpp1 (Minpp1/ER-H89) was stably expressed in Minpp1−/− MEF via retroviral infection and subsequent antibiotic selection (Fig. 6C; also see Materials and Methods). Dual-label immunofluorescence staining and confocal microscopic analysis were used to confirm the localization of exogenous Minpp1 to the ER (Fig. 6D). Compared with a control construct expressing β-Gal, Minpp1/ER-H89 overexpression reduced the levels of InsP5 by 62% and those of InsP6 by 35% (Fig. 6E and F). The latter percentage declines in levels of InsP5 and InsP6 approximately reversed the percentage increases in levels of these polyphosphates that occurred in MEF when the Minpp1 gene was deleted. A His89-to-Ala89 mutation of Minpp1 has been shown to render the enzyme catalytically inactive (Minpp1/ER-A89) (7). Expression of Minpp1/ER-A89 had no effect on the levels of InsP5 and InsP6 in Minpp1−/− MEF, further indicating that it is the phosphatase activity of Minpp1 that is responsible for regulating levels of these two inositol polyphosphates. We conclude that the ER enzyme Minpp1 has a significant role in the regulation of cellular pools of InsP5 and InsP6 in vivo.
Expression of Minpp1 in the cytosol is deleterious to cell growth.
The compartmentalization of Minpp1 in the ER is unique among enzymes of inositol phosphate metabolism. This situation is likely to limit substrate availability, but the physiological significance of this compartmentalization has not been established. Therefore, we investigated the consequences of increasing the access of Minpp1 to its substrates by overexpressing a cytosolic form of either catalytically active Minpp1 (Minpp1/cyt-H89) or the catalytically inactive mutant (Minpp1/cyt-A89). Cytosolic expression was assured by deleting from the Minpp1 nucleotide sequence the regions that encode the putative N-terminal ER-targeting sequence (5, 7) and the C-terminal ER retention sequence (Fig. 6C).
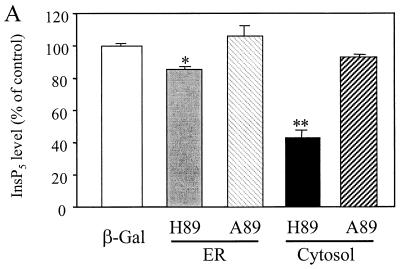
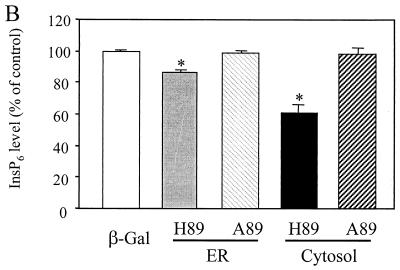
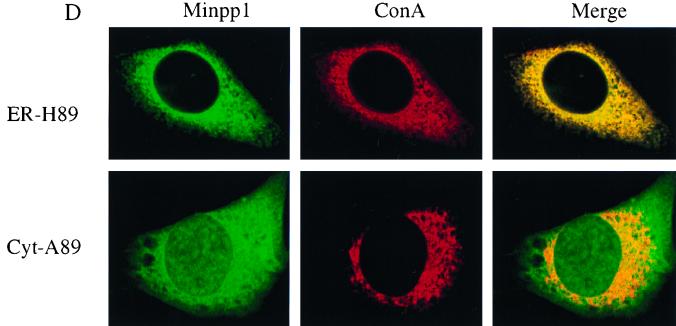
Efforts to stably overexpress cytosolic Minpp1 in MEF were unsuccessful; NIH 3T3 cells were used instead as a model system. Following expression of Minpp1/cyt-H89, levels of InsP5 and InsP6 were substantially (by 57% and 40%, respectively) decreased (Fig. 7A and B). Yet despite these dramatic changes, only relatively low levels of cytosolic Minpp1 could be detected by Western blot analysis (Fig. 7C), and the amount was undetectable by immunofluorescence analysis. In contrast, it was possible to generate stable cell lines that expressed relatively high levels of catalytically inactive Minpp1/cyt-A89 (Fig. 7C and D). As expected, expression of Minpp1/cyt-A89 did not affect levels of inositol phosphates (Fig. 7A and B). Exogenous Minpp1 was also overexpressed into the ER of NIH 3T3 cells. Despite high levels of Minpp1 expression compared to endogenous protein expression (data not shown), levels of InsP5 and InsP6 were only slightly reduced (approximately 15%; P < 0.05 [Fig. 7A and B]).
FIG. 7.
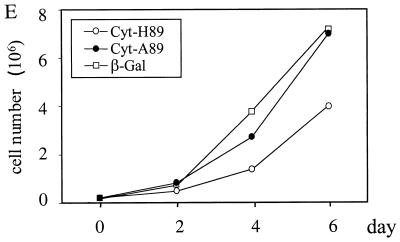
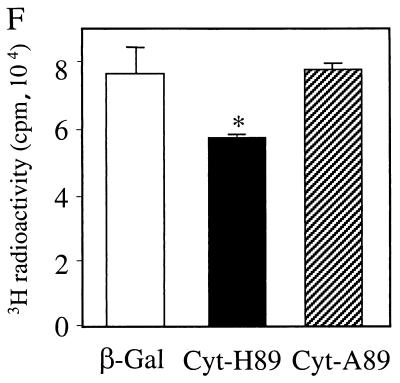
Expression of ER and cytosolic forms of Minpp1 in NIH 3T3 cells. (A and B) Cellular InsP5 (A) and InsP6 (B) levels were analyzed in NIH 3T3 cells stably expressing a β-Gal control, catalytically active forms of Minpp1 (ER-H89 and cyt-H89), and catalytically inactive His89 to Ala89 mutants (ER-A89 and cyt-A89). ∗, P < 0.05 and ∗∗, P < 0.001 compared with the levels in β-Gal-expressing cells (one-way ANOVA). Levels of InsP5 (A) and InsP6 (B) are shown as percentages of those in β-Gal-expressing cells. (C) Western blotting with anti-Xpress antibody, demonstrating the expression of Minpp1/cyt-H89 and cyt-A89 in NIH 3T3 cells. (D) Localization of overexpressed Minpp1 in NIH 3T3 cells. Minpp1 proteins were stained with anti-HA antibody (for ER forms of Minpp1) or anti-Xpress antibody (for cytosolic forms of Minpp1) followed by FITC-labeled anti-mouse secondary antibody. Rhodamine-ConA staining revealed the ER morphology, which colocalized with Minpp1/ER-H89 (upper panel) and ER-A89 (data not shown) but not with Minpp1/cyt-A89 (lower panel). Note that Minpp1/cyt-A89 had cytosolic expression as well as diffusive nuclear staining (Minpp1/cyt-A89 is a protein of 50 kDa, around the cutoff size of 40 to 60 kDa for diffusion of cytosolic proteins into nuclei). Cells expressing β-Gal or the catalytically active Minpp1/cyt-H89 did not show any detectable staining. (E) Growth curve analysis. The growth of cells expressing Minpp1/cyt-H89, cyt-A89, and β-Gal was analyzed by counting the total number of cells on each of the indicated days. (F) DNA synthesis rate of cells expressing Minpp1/cyt-H89, Minpp1/cyt-A89, and β-Gal was measured by thymidine incorporation assay. ∗, P < 0.05 compared with the level in β-Gal-expressing cells (n = 3 to 4, one-way ANOVA).
It was noteworthy that the growth rate of cells expressing catalytically active Minpp1/cyt-H89 was lower than that of cells expressing either β-Gal, catalytically inactive Minpp1/cyt-A89, or the ER form of active Minpp1 (Fig. 7E). This observation was further supported by incorporation of [3H]thymidine, as a measurement of DNA synthesis (Fig. 7F). The growth-inhibitory effect may explain why cells stably expressing high levels of active enzyme in the cytosol could not be generated. Taken together, these results lead to the novel conclusion that there are deleterious consequences for cell growth once the levels of InsP5 and InsP6 are reduced below a threshold level. This situation would also place into a physiological perspective the necessity for cells to restrict Minpp1 to the interior of the ER.
DISCUSSION
Among the phosphatases that hydrolyze inositol polyphosphates, Minpp1 is unique by virtue of three characteristics: an active site histidine, cleavage of the 3-phosphate from multiple inositol polyphosphates, and compartmentalization in the lumen of the ER. In vitro, Minpp1 hydrolyzes Ins(1,3,4,5)P4, InsP5, and InsP6, and kinetic experiments have indicated that InsP5 and InsP6 are the most important substrates for Minpp1. While these two polyphosphates are abundant in the cytosol, localization of Minpp1 to the ER has made it difficult to prove that these substrates gain access to the enzyme in vivo.
One of the major new conclusions to arise from this study is that ER-based Minpp1 does regulate InsP5 and InsP6 levels in vivo. Support for this proposal comes from our observation that in Minpp1−/− MEF the cellular levels of InsP5 and InsP6 were 30 to 45% higher than those of Minpp1+/+ MEF. Reintroduction of Minpp1 into the ER of Minpp1−/− MEF reduced the levels of InsP5 and InsP6 by 35 to 62%, approximately reversing the consequences of the Minpp1 gene deletion. In these add-back experiments, the expression level of exogenous Minpp1 in the ER of Minpp1−/− MEF was considerably greater than the level of endogenous Minpp1 in Minpp1+/+ MEF (data not shown). Moreover, the overexpression of ER-based Minpp1 in NIH 3T3 cells did not reduce levels of InsP5 and InsP6 much below those in wild-type cells. These results strongly suggest the existence of setpoint mechanisms that resist reductions in cellular levels of InsP5 and InsP6 below a critical minimum value. The maintenance of cellular InsP5 and InsP6 may be achieved through a low-affinity transport mechanism that allows access of InsP5 and InsP6 to ER-based Minpp1 only if these compounds rise above a certain concentration; another mechanism could be upregulation of the various kinases that synthesize InsP5 and InsP6 from the precursor Ins(1,4,5)P3.
Further support for the importance of maintaining cellular InsP5 and InsP6 is provided by our experiments with cytosolic expression of Minpp1. It was striking that expression of very low levels of catalytically active Minpp1 in the cytosol substantially lowered InsP5 and InsP6 levels and negatively affected cell growth. Increased levels of InsP5 and InsP6 have been associated with cell cycle progression, although there has been no evidence of a direct link (3, 12). Thus, our results demonstrate for the first time that maintenance of cellular InsP5 and InsP6 is essential to normal growth of mammalian cells. This conclusion is consistent with recent observations in yeast: depletion of cellular InsP6 slows cell growth and impedes gene expression by decreasing export of mRNA from the nucleus (28, 37). We can now fully appreciate the importance of the ER membrane barrier in restricting access of Minpp1 to its substrates.
In light of the necessity of ER localization for Minpp1, it becomes all the more intriguing to find that the Minpp1 gene encodes the inositol polyphosphate phosphatase previously localized to the plasma membrane in erythrocytes (11). Mature mammalian erythrocytes are a specialized cell type in that they have lost their nuclei and ER. They also lack a receptor-activated phospholipase C and do not synthesize inositol phosphates. The situation is different during erythropoiesis. Erythropoietic cells express receptor-regulated phospholipase C activity (24); consequently, InsP5 and InsP6 seem likely to accumulate from the precursor Ins(1,4,5)P3. If InsP5 and InsP6 were to be retained by mature erythrocytes, they would bind tightly to hemoglobin and impair the normal regulation of its affinity for oxygen by 2,3-diphosphoglycerate (2). Therefore, Minpp1 may be responsible for ensuring that InsP5 and InsP6 do not persist in mature erythrocytes. An important clue as to the significance of Minpp1, at least in mature erythrocytes and perhaps during erythropoiesis, is underlined by our demonstration that a substitutive inositol polyphosphate phosphatase is upregulated in the erythrocytes from Minpp1−/− mice. The identity of this novel enzyme awaits further investigation, but the existence of this phosphatase may explain why hemoglobin content and oxyhemoglobin saturation were unchanged in Minpp1−/− mice compared to Minpp1+/+ controls (data not shown).
Perhaps this novel inositol polyphosphate phosphatase, and/or other phosphatases, is upregulated in other tissues from Minpp1−/− mice, although we could not detect any such enzyme activity in liver or brain, at least under the Minpp1 assay conditions. Nevertheless, the presence of alternative mechanisms for regulating levels of InsP5 and InsP6 may be one reason that Minpp1−/− mice did not exhibit any detectable abnormalities. This lack of a phenotype is otherwise surprising, since Minpp1 is a single-copy gene, the message is widely expressed during mouse development, and the protein possesses a number of unique biochemical features (1, 7, 23).
Minpp1 deficiency may also result in subtle phenotypic alterations at the cellular level that we have yet to detect. For example, we considered the possibility that Minpp1 is involved in the regulation of Ca2+ storage and release, and/or the ER stress response, as is the case for other lumenal ER proteins such as calreticulin and BiP/GRP78 (15, 17, 19). However, no significant differences in agonist-induced cytosolic Ca2+ transients were detected between Minpp1+/+ and Minpp1−/− MEF and pancreatic acinar cells (data not shown). Stress-induced ER-based BiP/GRP78 expression, in response to tunicamycin (10 μg/ml) or thapsigargin (100 nM) treatment for up to 24 h, was indistinguishable between Minpp1+/+ and Minpp1−/− MEF. Also, Minpp1 mRNA expression itself was not regulated by these treatments (data not shown).
In summary, we have provided evidence that Minpp1 participates in the homeostatic regulation of the metabolic pools of InsP5 and InsP6 in vivo. Our data also show that these pools must be maintained for normal cell growth, except in the case of the mature erythrocyte, which employs Minpp1 activity to deplete InsP5 and InsP6. Despite these activities, and a strongly suggested role in chondrocyte differentiation, we have yet to define the upstream and downstream elements in those pathways that employ Minpp1 activity. We are currently performing yeast two-hybrid screens to identify proteins that interact with Minpp1. Upon identification of such proteins, combined with continued growth in the understanding of inositol polyphosphates, our Minpp1−/− mice will provide a valuable genetic background for further study of this novel enzyme.
ACKNOWLEDGMENTS
We gratefully acknowledge Barry Stripp, Robert Howell, and the University of Rochester Transgenic Mouse Facility for culturing of ES cells and production of chimeric mice. We also thank Patricia Hinkle and David Yule for calcium measurements, Edward Schwarz for providing 293GP cells and the VSV-G construct, Cristin Ferguson for advice on in situ hybridization, and Jennifer Harvey for preparation of the histological sections.
This work was supported by NIH grants AR44091 (P.R.R.) and AR38945 (R.N.R. and P.R.R.).
REFERENCES
- 1.Ali N, Craxton A, Shears S B. Hepatic Ins(1,3,4,5)P4 3-phosphatase is compartmentalized inside endoplasmic reticulum. J Biol Chem. 1993;268:6161–6167. [PubMed] [Google Scholar]
- 2.Arnone A, Perutz M F. Structure of inositol hexaphosphate-human deoxyhaemoglobin complex. Nature. 1974;249:34–36. doi: 10.1038/249034a0. [DOI] [PubMed] [Google Scholar]
- 3.Balla T, Sim S S, Baukal A J, Rhee S G, Catt K J. Inositol polyphosphates are not increased by overexpression of Ins(1,4,5)P3 3-kinase but show cell-cycle dependent changes in growth factor-stimulated fibroblasts. Mol Biol Cell. 1994;5:17–27. doi: 10.1091/mbc.5.1.17. [DOI] [PMC free article] [PubMed] [Google Scholar]
- 4.Berridge M J, Irvine R F. Inositol phosphates and cell signaling. Nature. 1989;341:197–205. doi: 10.1038/341197a0. [DOI] [PubMed] [Google Scholar]
- 5.Caffrey J J, Hidaka K, Matsuda M, Hirata M, Shears S B. The human and rat forms of multiple inositol polyphosphate phosphatase: functional homology with a histidine acid phosphatase up-regulated during endochondral ossification. FEBS Lett. 1999;442:99–104. doi: 10.1016/s0014-5793(98)01636-6. [DOI] [PubMed] [Google Scholar]
- 6.Cancedda R, Descalzi Cancedda F, Castagnola P. Chondrocyte differentiation. Int Rev Cytol. 1995;159:265–358. doi: 10.1016/s0074-7696(08)62109-9. [DOI] [PubMed] [Google Scholar]
- 7.Chi H B, Tiller G E, Dasouki M J, Romano P R, Wang J, O'Keefe R J, Puzas J E, Rosier R N, Reynolds P R. Multiple inositol polyphosphate phosphatase: evolution as a distinct group within the histidine phosphatase family and chromosomal localization of the human and mouse genes to chromosomes 10q23 and 19. Genomics. 1999;56:324–336. doi: 10.1006/geno.1998.5736. [DOI] [PubMed] [Google Scholar]
- 8.Craxton A, Ali N, Shears S B. Comparison of the activities of a multiple inositol polyphosphate phosphatase obtained from several sources: a search for heterogeneity in this enzyme. Biochem J. 1995;305:491–498. doi: 10.1042/bj3050491. [DOI] [PMC free article] [PubMed] [Google Scholar]
- 9.Craxton A, Caffrey J J, Burkhart W, Safrany S T, Shears S B. Molecular cloning and expression of a rat hepatic multiple inositol polyphosphate phosphatase. Biochem J. 1997;328:75–81. doi: 10.1042/bj3280075. [DOI] [PMC free article] [PubMed] [Google Scholar]
- 10.Efanov A M, Zaitsev S V, Berggren P O. Inositol hexakisphosphate stimulates non-Ca2+-mediated and primes Ca2+-mediated exocytosis of insulin by activation of protein kinase C. Proc Natl Acad Sci USA. 1997;94:4435–4439. doi: 10.1073/pnas.94.9.4435. [DOI] [PMC free article] [PubMed] [Google Scholar]
- 11.Estrada-Garcia T, Craxton A, Kirk C J, Michell R H. A salt-activated inositol 1,3,4,5-tetrakisphosphate 3-phosphatase at the inner surface of the human erythrocyte membrane. Proc R Soc Lond B. 1991;244:63–68. doi: 10.1098/rspb.1991.0052. [DOI] [PubMed] [Google Scholar]
- 12.Guse A H, Greiner E, Emmrich F, Brand K. Mass changes of inositol 1,3,4,5,6-pentakisphosphate and inositol hexakisphosphate during cell cycle progression in rat thymocytes. J Biol Chem. 1993;268:7129–7133. [PubMed] [Google Scholar]
- 13.Hodgson M E, Shears S B. Rat liver contains a potent endogenous inhibitor of inositol 1,3,4,5-tetrakisphosphate 3-phosphatase. Biochem J. 1990;267:831–834. doi: 10.1042/bj2670831. [DOI] [PMC free article] [PubMed] [Google Scholar]
- 14.Hunziker E B. Mechanism of longitudinal bone growth and its regulation by growth plate chondrocytes. Microsc Res Tech. 1994;28:505–519. doi: 10.1002/jemt.1070280606. [DOI] [PubMed] [Google Scholar]
- 15.Krause K H, Michalak M. Calreticulin. Cell. 1997;88:439–443. doi: 10.1016/s0092-8674(00)81884-x. [DOI] [PubMed] [Google Scholar]
- 16.Larsson L, Barker C J, Sjoholm A, Carlqvist H, Michell R H, Bertorello A, Nilsson T, Honkanen R E, Mayr G W, Zwiller J, Berggren P-O. Inhibition of phosphatases and increased Ca2+ channel activity by inositol hexaphosphate. Science. 1997;278:471–474. doi: 10.1126/science.278.5337.471. [DOI] [PubMed] [Google Scholar]
- 17.Lievremont J P, Rizzuto R, Hendershot L, Meldolesi J. BiP, a major chaperone protein of the endoplasmic reticulum lumen, plays a direct and important role in the storage of the rapidly exchanging pool of Ca2+ J Biol Chem. 1997;272:30873–30879. doi: 10.1074/jbc.272.49.30873. [DOI] [PubMed] [Google Scholar]
- 18.Majerus P W. Inositol phosphate biochemistry. Annu Rev Biochem. 1992;61:225–250. doi: 10.1146/annurev.bi.61.070192.001301. [DOI] [PubMed] [Google Scholar]
- 19.Morris J A, Dorner A J, Edwards C A, Hendershot L M, Kaufman R J. Immunoglobulin binding protein (BiP) function is required to protect cells from endoplasmic reticulum stress but is not required for the secretion of selective proteins. J Biol Chem. 1997;272:4327–4334. doi: 10.1074/jbc.272.7.4327. [DOI] [PubMed] [Google Scholar]
- 20.Munro S, Pelham H R B. A C-terminal signal prevents secretion of luminal ER proteins. Cell. 1987;48:899–907. doi: 10.1016/0092-8674(87)90086-9. [DOI] [PubMed] [Google Scholar]
- 21.Murray P J, Watowich S S, Lodish H F, Young R A, Hilton D J. Epitope tagging of the human endoplasmic reticulum HSP70 protein, BiP, to facilitate analysis of BiP-substrate interactions. Anal Biochem. 1995;229:170–179. doi: 10.1006/abio.1995.1399. [DOI] [PubMed] [Google Scholar]
- 22.Naldini L, Blomer U, Gallay P, Ory D, Mulligan R, Gage F H, Verma I M, Trono D. In vivo gene delivery and stable transduction of nondividing cells by a lentiviral vector. Science. 1996;272:263–267. doi: 10.1126/science.272.5259.263. [DOI] [PubMed] [Google Scholar]
- 23.Nogimori K, Hughes P J, Glennon M C, Hodgson M E, Putney J W, Jr, Shears S B. Purification of an inositol (1,3,4,5)-tetrakisphosphate 3-phosphatase activity from rat liver and the evaluation of its substrate specificity. J Biol Chem. 1991;266:16499–16506. [PubMed] [Google Scholar]
- 24.Ren H Y, Komatsu N, Shimizu R, Okada K, Miura Y. Erythropoietin induces tyrosine phosphorylation and activation of phospholipase C-γ1 in a human erythropoietin-dependent cell line. J Biol Chem. 1994;269:19633–19638. [PubMed] [Google Scholar]
- 25.Reynolds S D, Johnston C J, Leboy P S, O'Keefe R J, Puzas J E, Rosier R N, Reynolds P R. Identification and characterization of a unique chondrocyte gene involved in transition to hypertrophy. Exp Cell Res. 1996;226:197–207. doi: 10.1006/excr.1996.0219. [DOI] [PubMed] [Google Scholar]
- 26.Romano P R, Wang J, O'Keefe R J, Puzas J E, Rosier R N, Reynolds P R. HiPER1, a phosphatase of the endoplasmic reticulum with a role in chondrocyte maturation. J Cell Sci. 1998;111:803–813. doi: 10.1242/jcs.111.6.803. [DOI] [PubMed] [Google Scholar]
- 27.Safrany S T, Caffrey J J, Yang X, Shears S B. Diphosphoinositol polyphosphates: the final frontier for inositide research? Biol Chem. 1999;380:945–951. doi: 10.1515/BC.1999.117. [DOI] [PubMed] [Google Scholar]
- 28.Saiardi A, Caffrey J J, Snyder S H, Shears S B. Inositol polyphosphate multikinase (ArgRIII) determines nuclear mRNA export in Saccharomyces cerevisiae. FEBS Lett. 2000;468:28–32. doi: 10.1016/s0014-5793(00)01194-7. [DOI] [PubMed] [Google Scholar]
- 29.Shears S B. Measurement of inositol phosphate turnover in intact cells and cell-free systems. In: Shears S, editor. Signaling by inositides: a practical approach. Oxford, United Kingdom: Oxford University Press; 1997. pp. 33–52. [Google Scholar]
- 30.Shears S B. Metabolism of inositol phosphates. Adv Second Messenger Phosphoprotein Res. 1992;26:63–92. [PubMed] [Google Scholar]
- 31.Shears S B. The versatility of inositol phosphates as cellular signals. Biochim Biophys Acta. 1998;1436:49–67. doi: 10.1016/s0005-2760(98)00131-3. [DOI] [PubMed] [Google Scholar]
- 32.Stephens L R, Downes C P. Product-precursor relationships amongst inositol polyphosphates. Incorporation of [32P]Pi into myo-inositol 1,3,4,6-tetrakisphosphate, myo-inositol 1,3,4,5-tetrakisphosphate, myo-inositol 3,4,5,6-tetrakisphosphate and myo-inositol 1,3,4,5,6-pentakisphosphate in intact avian erythrocytes. Biochem J. 1990;265:435–452. doi: 10.1042/bj2650435. [DOI] [PMC free article] [PubMed] [Google Scholar]
- 33.Stripp B R, Lund J, Mango G W, Doyen K C, Johnston C, Hultenby K, Nord M, Whitsett J A. Clara cell secretory protein: a determinant of PCB bioaccumulation in mammals. Am J Physiol. 1996;271:L656–L664. doi: 10.1152/ajplung.1996.271.4.L656. [DOI] [PubMed] [Google Scholar]
- 34.Stuart J A, Anderson K L, French P J, Kirk C J, Michell R H. The intracellular distribution of inositol polyphosphates in HL60 promyeloid cells. Biochem J. 1994;303:517–525. doi: 10.1042/bj3030517. [DOI] [PMC free article] [PubMed] [Google Scholar]
- 35.Tartakoff A M, Vassalli P. Lectin-binding sites as markers of Golgi subcompartments: proximal-to-distal maturation of oligosaccharides. J Cell Biol. 1983;97:1243–1248. doi: 10.1083/jcb.97.4.1243. [DOI] [PMC free article] [PubMed] [Google Scholar]
- 36.Virtanen I, Ekblom P, Laurila P. Subcellular compartmentalization of saccharide moieties in cultured normal and malignant cells. J Cell Biol. 1980;85:429–434. doi: 10.1083/jcb.85.2.429. [DOI] [PMC free article] [PubMed] [Google Scholar]
- 37.York J D, Odom A R, Murphy R, Ives E B, Wente S R. A phospholipase C-dependent inositol polyphosphate kinase pathway required for efficient messenger RNA export. Science. 1999;285:96–100. doi: 10.1126/science.285.5424.96. [DOI] [PubMed] [Google Scholar]


