

Abstract
Neuromodulation via the intracellular second messenger cAMP is ubiquitous at presynaptic nerve terminals. This modulation of synaptic transmission allows exocytosis to adapt to stimulus levels and reliably encode information. The AII amacrine cell (AII-AC) is a central hub for signal processing in the mammalian retina. The main apical dendrite of the AII-AC is connected to several lobular appendages that release glycine onto OFF cone bipolar cells and ganglion cells. However, the influence of cAMP on glycine release is not well understood. Using membrane capacitance measurements from mouse AII-ACs to directly measure exocytosis, we observe that intracellular dialysis of 1 mm cAMP enhances exocytosis without affecting the L-type Ca2+ current. Responses to depolarizing pulses of various durations show that the size of the readily releasable pool of vesicles nearly doubles with cAMP, while paired-pulse depression experiments suggest that release probability does not change. Specific agonists and antagonists for exchange protein activated by cAMP 2 (EPAC2) revealed that the cAMP-induced enhancement of exocytosis requires EPAC2 activation. Furthermore, intact Ca2+ stores were also necessary for the cAMP potentiation of exocytosis. Postsynaptic recordings from OFF cone bipolar cells showed that increasing cAMP with forskolin potentiated the frequency of glycinergic spontaneous IPSCs. We propose that cAMP elevations in the AII-AC lead to a robust enhancement of glycine release through an EPAC2 and Ca2+ store signaling pathway. Our results thus contribute to a better understanding of how AII-AC crossover inhibitory circuits adapt to changes in ambient luminance.
SIGNIFICANCE STATEMENT The mammalian retina operates over a wide dynamic range of light intensities and contrast levels. To optimize the signal-to-noise ratio of processed visual information, both excitatory and inhibitory synapses within the retina must modulate their gain in synaptic transmission to adapt to different levels of ambient light. Here we show that increases of cAMP concentration within AII amacrine cells produce enhanced exocytosis from these glycinergic interneurons. Therefore, we propose that light-sensitive neuromodulators may change the output of glycine release from AII amacrine cells. This novel mechanism may fine-tune the amount of tonic and phasic synaptic inhibition received by bipolar cell terminals and, consequently, the spiking patterns that ganglion cells send to the upstream visual areas of the brain.
Keywords: AII amacrine cell, calcium store, cAMP, EPAC, exocytosis, retina
Introduction
Light signals are transduced by photoreceptors into graded glutamate release onto bipolar cell (BC) dendrites and then by BC terminals via glutamate release onto retinal ganglion cell (RGC) dendrites in the inner plexiform layer (IPL). Amacrine cells (ACs) form inhibitory synapses in the IPL with BC terminals, with other ACs and with RGC dendrites (Strettoi et al., 1992; Wässle, 2004). AII ACs (AII-ACs) are the most abundant glycinergic narrow-field AC in the mammalian retina and are found even in the primate fovea (Vaney et al., 1991; Wässle et al., 2009; Strettoi et al., 2018). Their dendritic arbors are bistratified in the IPL and perform two compartment specific functions that are crucial for night (scotopic) and daytime (photopic) vision. First, glutamate from rod BC terminals activates AMPARs on AII-AC distal dendrites, and these excitatory signals are relayed to neighboring AII-ACs and ON-cone BCs (ON-CBCs) through gap junctions (Demb and Singer, 2012). Second, signals from ON rod BCs or ON-CBCs crossover to inhibit OFF-cone BCs (OFF-CBCs) and OFF-RGCs via the AII-AC proximal dendritic lobular appendages. These lobular terminals express L-type Cav1.3 Ca2+ channels at active zones for exocytosis and contain a large pool of synaptic vesicles loaded with glycine (Habermann et al., 2003; Marc et al., 2014). This crossover inhibition from ON to OFF channels enhances the signal-to-noise ratio of retinal circuits (Liang and Freed, 2012).
The dynamic range of the rod and cone photoreceptors operates from 1 to >100,000 photons, yet little is known about how crossover inhibition adapts to such a wide range of light intensities. The adaptation of retinal circuits to changes in ambient light is dependent on neuromodulators (Roy and Field, 2019). Light-evoked uncoupling of AII-ACs networks, for example, relies on the elevation of retinal dopamine (Hampson et al., 1992), which in turn induces cAMP-dependent dephosphorylation of connexin 36 (Cx36) hemichannels (Kothmann et al., 2009). This decreases gap-junction conductances between AII-ACs, which relies on cAMP binding and activating protein kinase A (PKA) in the distal dendritic arbors (Kothmann et al., 2009; Field and Sampath, 2017). Although dopaminergic ACs form en passant synapses onto AII-ACs (Voigt and Wässle, 1987), it is still unclear how changes in dopamine and cAMP levels affect crossover inhibition via glycine release.
Changes in the concentration of cAMP can induce changes in presynaptic release probability (Pr) or the size of the readily releasable pool (RRP) of vesicles at different CNS synapses (Vaden et al., 2019). This can be mediated by activating PKA or the effector protein directly activated by cAMP (EPAC) at excitatory and inhibitory synapses (Katsurabayashi et al., 2001; Sakaba and Neher, 2001; Kaneko and Takahashi, 2004; Fernandes et al., 2015). The proximity of the AII-AC lobules to the cell soma makes these release sites electronically accessible for time-resolved membrane capacitance (Cm) recordings (Balakrishnan et al., 2015; Hartveit et al., 2019). The AII-AC contains a large RRP of vesicles, which may account for this interneuron's ability to provide both phasic and graded modes of synaptic transmission (Graydon et al., 2018). This versatility in neurotransmitter release may allow AII-ACs to reliably encode different temporal frequencies.
Here we used Cm measurements of exocytosis from AII-ACs and recordings of spontaneous IPSCs (sIPSCs) from OFF-CBCs to provide direct evidence that cAMP can enhance inhibitory synaptic transmission. We find that this cAMP-induced potentiation of exocytosis is not PKA-dependent. Instead, this potentiation depends on EPAC2 activation and intact internal Ca2+ stores. Importantly, cAMP elevation did not change significantly the total charge influx of the L-type Ca2+ current, which triggers exocytosis and is localized to the lobular appendages of the AII-ACs (Habermann et al., 2003; Balakrishnan et al., 2015). We propose that EPAC2 activation promotes Ca2+ release from Ca2+ stores that enhances glycine release onto OFF-CBC synaptic terminals. Changes of cAMP levels in AII-ACs thus constitute an important signaling pathway that modulates glycine release in the mammalian retina.
Materials and Methods
Rodents and retinal slices
Procedures were approved by the Institutional Animal Care and Use Committee of Oregon Health & Science University, and were in accordance with National Institutes of Health guidelines. C57BL/6 background mice and Sprague Dawley rats of either sex (postnatal day 25-35) were used in the experiments. Animals were anesthetized with isoflurane (Novaplus) and then after death, the eyes were removed and dissected to extract the retina in carbogenated Ames medium (US Biologicals) at room temperature. Experiments were also performed using connexin-36 knockout mice (Cx36−/−; generated as described by Hormuzdi et al., 2001), and transgenic synaptotagmin2-EGFP mice (Syt2-EGFP; MMRRC).
Retinas were embedded in low melting temperature agarose (σ Type VIIA, 3% in Ames medium), and 250 µm slices were prepared using a vibratome (Leica Microsystems, VT1200S) in carbogenated low-Na+ sucrose-based cutting solution containing the following (in mm): 2.5 KCL, 35 NaHCO3, 1.25 NaH2PO4, 0.5 CaCl2, 6 MgCl2, 10 glucose, 3 Na-pyruvate, 210 sucrose, and 20 HEPES and buffered to pH 7.4 with NaOH. Retinal slices were stored at room temperature in carbogenated Ames solution before being transferred to the recording chamber. Ames solution (containing 1.15 mm free Ca2+) (Ames and Nesbett, 1981) was continuously perfused over the retinal slices during recordings and heated to near physiological temperature (32°C-34°C) for all experiments.
Live cell imaging
Retina slices were viewed with differential interference contrast (DIC) microscopy using a water immersion objective lens (60×, Olympus) on a fixed stage, upright microscope (BX51WI, Olympus). Experiments were also performed with a 40× objective on an Axio Examiner microscope (Carl Zeiss). AII-ACs and OFF-CBCs were identified by the soma shape and position in the inner nuclear layer (INL). Epifluorescence images were taken to determine the cell morphology perfused with Alexa-488 or -594 dye (20 μm; Invitrogen) after whole-cell recordings. Images were captured with a QIClick CCD camera (Q-Imaging). Z stacks and time-series image acquisition was performed using an Orca Flash 4.0LT CMOS camera (Hamamatsu Photonics) controlled with CellSens deconvolution image software (Olympus). Image stacks were also generated using a piezo collar (Pi) on the objective and used to capture both AII-AC and OFF-CBC morphology using epifluorescence and DIC image channels (z = 0.5 µm optical slices; ranging from 50 to 95 slices varying from cell to cell).
Tracking whole-cell dialysis of Alexa-488 was done with a time-lapse (10 Hz) video at a single focal plane for 30 s. This was immediately followed by a time-lapse video at 5 Hz using a piezo collar (Pi) on the objective to cycle through 5 focal planes. After these videos were captured and the cell was fully dialyzed, we performed a z-stack image of the entire cell.
Patch-clamp electrophysiology
Single-cell voltage-clamp recordings were performed using a double EPC-9 or EPC-10 patch-clamp amplifier and either Pulse or Patchmaster software (HEKA Elektronik). Thick-walled borosilicate glass pipettes (8-10 mΩ; 1B150F-4, World Precision Instruments) were pulled using a Narishige puller-PP830 (Tokyo) and coated with dental wax (Cavex) or Parafilm to reduce stray capacitance and electrical noise. Data were acquired at 10 or 20 kHz sampling rate and filtered with 2 kHz low-pass filter.
Presynaptic recordings of Ca2+ currents and Cm measurements
Whole-cell voltage-clamp recordings of Cm and Ca2+ currents (ICa) were performed in mouse AII-ACs. Recordings were performed in photopic conditions. Ames external solution was supplemented with (in µm) as follows: 10 NBQX or 10 CNQX, 50 DL-AP5, 2 strychnine, 3 SR95531, 5 bicuculline, and 1 TTX. These drugs blocked AMPA, NMDA, glycine, and GABA receptors, as well as Na+ channels during Cm and ICa recordings. Pipettes were back-filled with a filtered internal solution designed to isolate Ca2+ currents (ICa) by blocking K+ currents (in mm) as follows: 40 CsCl, 60 Cs-gluconate, 10 tetraethyl ammonium chloride, 28 HEPES, 3 adenosine 5′-triphosphate magnesium salt (ATP-Mg), 1 guanosine 5′-triphosphate disodium salt (GTP-Na2), and 2 EGTA; osmolarity was adjusted to 270 mOsm using glucose, and pH to 7.3 with CsOH. Ultrapure salts for internal and external solutions were purchased from Sigma-Aldrich.
Time-resolved Cm measurements were made using the “sine+DC” method (Gillis, 2000; Kushmerick and von Gersdorff, 2003; Balakrishnan et al., 2015; Hartveit et al., 2019). A pair of sinusoidal waves (2 kHz; 30 mV peak-to-peak) superimposed on membrane holding potential (−80 mV) were given before and after a square depolarizing pulse from −80 to −10 mV for maximum activation of L-type Ca2+ current (Balakrishnan et al., 2015), which triggered Ca2+-dependent vesicle fusion (exocytosis). Leak voltage-clamp pulses (to −66 mV) were used to calculate leak-subtracted L-type Ca2+ currents and were resolved using offline P/5 leak subtraction. In addition, ICa were sometimes isolated by subtraction of the leak current after application of 1 μm isradipine. Experiments were not corrected for liquid junction potential, which was measured (−6 mV) post hoc using methods described by Neher (1992). Of the total of 79 AII-AC recordings, the average series resistance (RS) for AII-ACs was 29.04 ± 14.8 mΩ and the membrane resistance (Rm) was 1025 ± 193 mΩ.
Online calculations of passive membrane properties (Cm, Rs, Rm) were done by the HEKA software. Traces were imported to IgorPro software (Wavemetrics) for offline analysis. Net exocytosis was determined by the change in the Cm response after a depolarizing pulse: ΔCm = Cm (after pulse) – Cm (baseline). This was performed by subtracting averaged Cm data points after the depolarizing pulse from baseline Cm (indicated by gray bars on figures with Cm). ΔCm response was measured from 300 to 500 ms after the depolarizing pulse, allowing time for all evoked conductances to decay back to baseline.
Postsynaptic recordings from off-CBCs
Whole-cell voltage-clamp recordings of sIPSCs from OFF-CBCs in retina slices from rat and Syt2-EGFP mice: recordings were performed in an external ACSF solution containing the following (in mm): 125 NaCl, 2.5 KCl, 25 NaHCO3, 1.25 NaH2PO4, 2.5 CaCl2, 1 MgCl2, 10 glucose, pH 7.4, and using a Cs-based internal solution containing the following (in mm): 50 CsCl, 60 Cs-gluconate, 10 HEPES, 6 EGTA, 4 ATP-Mg, 0.4 GTP-Na2, 0.1 CaCl2, and 1 MgCl2; osmolarity was adjusted to 270 mOsm using glucose, and pH to 7.3 with CsOH. Glycinergic sIPSCs from OFF-CBCs were isolated using the following drugs in the external bath solution (in µm): 10 CNQX, 25 D-AP5, 5 bicuculline, and 3 SR95531. Similar experiments were also performed on OFF-CBCs in slices from Syt2-EGFP mice continuously perfused with Ames medium. The datasets for sIPSCs from rat and mouse OFF-CBCs were similar in amplitude and kinetics and were grouped together. A total of five OFF-CBC recordings from Syt2-EGFP mice were used in this study, the mean Rs was 21.3 ± 3.952 mΩ, and holding curent was −95.4 ± 36.24 pA.
Glycinergic sIPSCs were analyzed using custom procedures in IgorPro software using a sliding scale template method for detecting and isolating events (Clements and Bekkers, 1997). Analysis was performed using a detection threshold of −10 and −15 pA, with no change in event detection. The medians of events for each cell were used for statistical comparisons before and after treatment. Plots of frequency and cumulative distribution were generated by grouping all events for each dataset, which were generated and fitted using Prism software (GraphPad). Using Prism software (GraphPad), we made log-Gaussian fits to frequency distribution histograms of sIPSC events using the following function:
Where µ is the geometric mean and σ is the geometric standard deviation. A is a constant related to the distribution area (Parea) and amplitude (Pmax) as defined by the following equations:
Drugs and toxins
Stock concentrations of drugs and salts were prepared using purified water (Millipore). The synaptic blockers NBQX, CNQX, SR95531, and DL-AP5 and bicuculline were obtained from Tocris Bioscience. TTX and strychnine were obtained from Sigma. Internal solutions contained HJC0350, H89, and 8-pCPT-2-O-Me-cAMP (8-pCPT) when indicated (Tocris Biosciences). Forskolin, 2-APB, and ryanodine were bath-applied in the external solution when indicated (Tocris Biosciences). HJC0350, H89, and forskolin were first dissolved in DMSO (final DMSO concentration of 0.01%, v/v). Internal solutions were prepared and stored [1.25×] for no longer than 3 months and diluted [1×] before use with purified water (Milli-Q; Millipore) or freshly prepared 25 mm stock cAMP sodium salt (Sigma). Pipette filling syringes containing internal solutions were kept on ice to avoid thermal degradation of cAMP, GTP, and ATP-Mg.
Experimental design and statistical analysis
Datasets for all experiments were tested for normal distribution using a Shapiro–Wilk test. For most experiments, pairwise comparisons were made between recordings taken within 1 min (30 s to 1 min) and at 4 min after break-in using a two-tailed paired t test or Wilcoxon test, respectively, for datasets with normal and non-normal distribution with an α level of 0.05. For comparisons of independent groups, we performed either a Student's t test or Mann–Whitney test, respectively, for normal and non-normal distribution. For comparisons between multiple groups, we indicate where we use one-way and two-way ANOVA tests followed by post hoc tests. All statistical tests were performed in Prism 9 software (GraphPad). Grouped data are written as mean ± SEM. Statistical significance is noted by asterisks, while not significant (p > 0.05) is either labeled or not indicated.
Results
Dialysis of cAMP potentiates exocytosis in AII-ACs
We performed whole-cell voltage-clamp experiments by patching AII-AC somas with a Cs-based internal pipette solution containing 1 mm cAMP (Fig. 1A). AII-ACs were targeted by the characteristic location of their somas near the border between the INL and IPL. Dye-filled cells were examined after each recording to morphologically confirm their identity as AII-ACs (Fig. 1B). A 100 ms depolarizing pulse from −80 to −10 mV elicits a noninactivating L-type Ca2+ current (ICa; Fig. 1C,D, insets), which was isolated after offline leak subtraction (see Materials and Methods).
Figure 1.
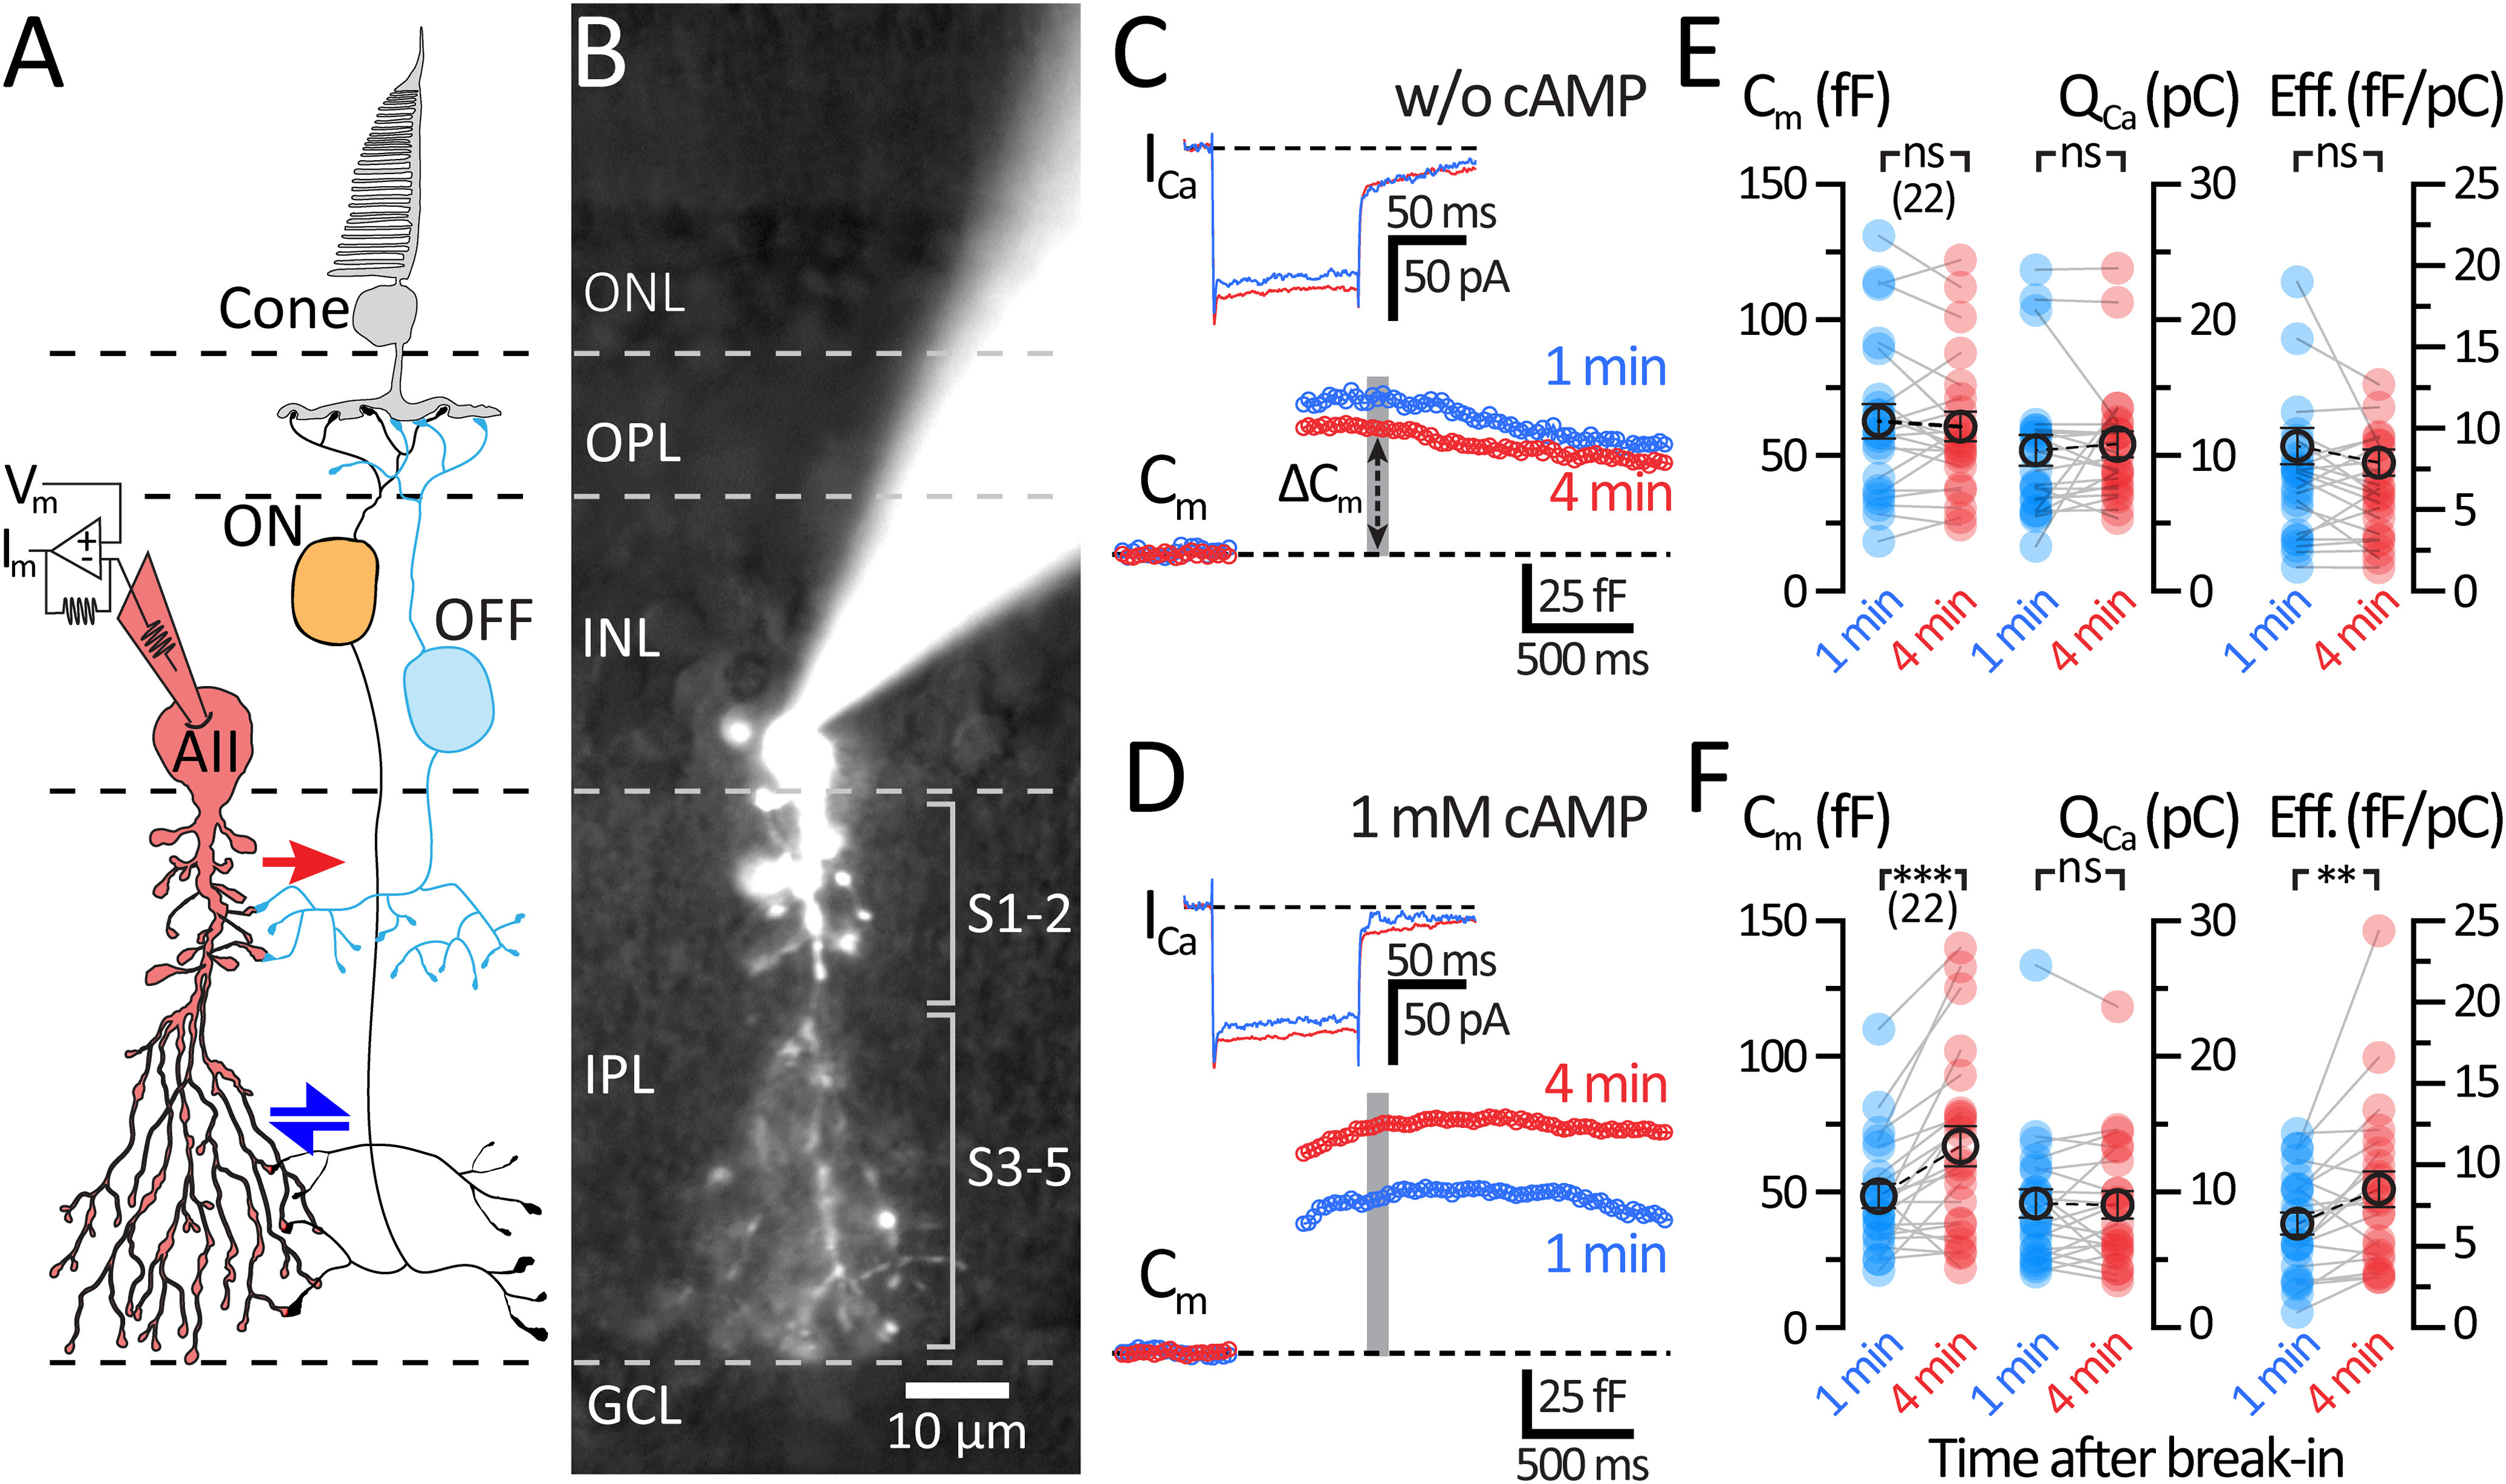
Dialysis with cAMP (1 mm) potentiates evoked exocytosis in AII-ACs. A, Schematic of the crossover inhibitory circuit and the AII-AC. Signals from cone photoreceptors are split into ON- and OFF-type BCs and mixed by AII-ACs. Excitation from gap junction (blue arrows) coupled ON-BCs is converted by the AII-AC into synaptic release of inhibitory glycine to OFF-BCs (red arrow). B, Epifluorescence micrograph of an AII-AC filled with an internal solution containing Alexa-488 (20 μm) after whole-cell patch-clamp recording. Labeled on image are lines indicating layers and sublayers of the retina. C, D, Average traces of Cm and ICa responses to a 100 ms depolarizing pulse (from −80 to −10 mV) within 1 min (blue) and 4 min (red) after break-in. Gray bar represents the region where Cm values were averaged. C, Recordings from AII-ACs using a control internal solution (no cAMP). D, Recordings from AII-ACs using an internal solution containing 1 mm cAMP. E, F, Summary plots for ΔCm, the ICa integrated charge transfer (QCa), and exocytosis efficiency (ΔCm/QCa) showing pairwise comparisons between each time after break-in. Solid circles represent data from individual AII-ACs. Open circles with error bars represent mean ± SEM. E, Summary plots for control dataset. There is no change in ΔCm, QCa, or ΔCm/QCa after 4 min of recording. Statistical significance for ΔCm was tested using a paired t test, while QCa and efficiency were tested using a Wilcoxon t test. F, Summary plots for 1 mm cAMP dataset. ΔCm and exocytosis efficiency increase significantly at 4 min with no change in QCa. Statistical significance for the 1 mm cAMP datasets was determined using Wilcoxon t tests: ns, p > 0.05; **p < 0.01; ***p < 0.001.
After whole-cell break-in, depolarizing pulses were given at <1 min and shortly after >4 min of whole-cell dialysis with the internal solution. The ICa responses observed in control (without cAMP; Fig. 1C) were similar to ICa recordings performed with 1 mm cAMP (Fig. 1D). The ICa current was integrated over the entire pulse duration to measure the Ca2+ charge transfer (QCa). As shown in Figure 1E, QCa did not change significantly between 1 and 4 min of dialysis with the control solution (1 min: 10.4 ± 1.15 pC; and 4 min: 10.8 ± 0.95 pC; n = 22; p = 0.552; Wilcoxon). The ICa thus remained stable and did not rundown or runup during whole-cell recordings. As shown in Figure 1F, 1 mm cAMP did not affect the QCa (1 min: 9.16 ± 1.06 pC; and 4 min: 9.05 ± 1.02 pC; n = 22; p = 0.924; Wilcoxon), which indicates that cAMP has no significant effect on the L-type Ca2+ currents of AII-ACs.
Time-resolved Cm measurements can correlate strongly with synaptic vesicle exocytosis and neurotransmitter release at different nerve terminals (Grabner and Zenisek, 2013; Ritzau-Jost et al., 2014). We next measured ΔCm before and after the dialysis with control internal solution. Similar to our previous report (Balakrishnan et al., 2015), we did not observe a significant rundown or change in ΔCm when using our control internal solution within a time window of ∼10 min after break-in (Fig. 1C,E; 1 min: 62.6 ± 6.32 fF; and 4 min: 60.7 ± 5.54 fF; n = 22; p = 0.6333; Wilcoxon). However, when the pipette solution contained 1 mm cAMP, we observed significantly larger ΔCm jumps after 4 min of whole-cell dialysis (Fig. 1D,F; 1 min: 48.56 ± 4.48 fF; and 4 min: 66.9 ± 7.41 fF; n = 22; p = 0.0006; Wilcoxon), although QCa remained the same (Fig. 1F). This suggests that a cAMP-dependent potentiation of exocytosis is present in AII-ACs, and this enhancement of vesicle fusion occurs without augmenting L-type Ca2+ currents. The efficiency of exocytosis (ratio of ΔCm divided by Qca) did not change in controls (1 min: 7.13 ± 0.89 fF/pC; and 4 min: 6.32 ± 0.65 fF/pC; n = 22; p = 0.3248; Wilcoxon); however, we observed an increase in exocytosis efficiency with 1 mm cAMP (1 min: 6.40 ± 0.68 fF/pC; and 4 min: 8.50 ± 1.08 fF/pC; n = 22; p = 0.0059; Wilcoxon).
The passive parameters of Rs (1 min: 28.4 ± 2.87 mΩ; and 4 min: 24.8 ± 2.45 mΩ; n = 22; mΩ; p = 0.002) and Rm (1 min: 956 ± 300 mΩ; and 4 min: 603 ± 127 mΩ; n = 22; p = 0.0738; Wilcoxon) were also recorded in control experiments. These values were similar to those from cells dialyzed with 1 mm cAMP for both Rs (1 min: 25.4 ± 2.54 mΩ; and 4 min: 27.5 ± 3.62 mΩ; n = 22; p = 0.5879) and Rm (1 min: 1040 ± 247 mΩ; and 4 min: 742 ± 118 mΩ; n = 22; p = 0.0684; Wilcoxon). As long as Rm ≫ Rs, the ΔCm measurements should be a good estimate of exocytosis (Gillis, 2000).
Tracking the diffusion of small molecules within AII-ACs
The AII-AC has been classically modeled as a compact isopotential cell despite its complex morphology (Vardi and Smith, 1996). However, recent electrotonic and morphologic modeling suggests that electrical compartments can filter the spread of voltage between distal and proximal regions of the AII-AC in rat retina (Zandt et al., 2018). Furthermore, the dendritic compartments and the narrow tubes linking lobules with dendrites can act as diffusion barriers, which may complicate our study of cAMP modulation on synaptic vesicle exocytosis.
We thus tracked the fluorescent dye Alexa-488 as it diffused from the pipette solution and mixed with the AII-AC cytosol. Alexa-488 does not permeate across membranes but will dialyze into cells after whole-cell break-in. The perfusion rate of small mobile molecules depends on the molecular weight of the molecule, the cell volume, and the pipette Rs (Neher and Almers, 1986; Oliva et al., 1988). In addition, tortuosity (geometry of the pathway), viscosity of the cytosol, binding or degradation of the molecule, and the diffusion coefficient all influence diffusion rates. We thus measured the dialysis of Alexa-488 after making whole-cell patches of AII-ACs (Rs: 28.7 ± 4.59 mΩ; n = 5). Shown in Figure 2A are representative images from a time-lapse video of a single AII-AC being filled with Alexa-488 dye. Time-lapse imaging captured the dialysis time course after whole-cell break-in (Fig. 2Ai,Aii). Proximal dendritic compartments began filling within 1 min of dialysis, and the AII-AC was fully dialyzed with Alexa dye after 3 min. Time-series images were acquired at multiple focal plans to capture the branched distal compartments (Fig. 2Aii,Aiii). Similar observations were obtained in 5 AII-ACs; however, we were unable to capture distal and fine arbors in 2 of 5 cells.
Figure 2.
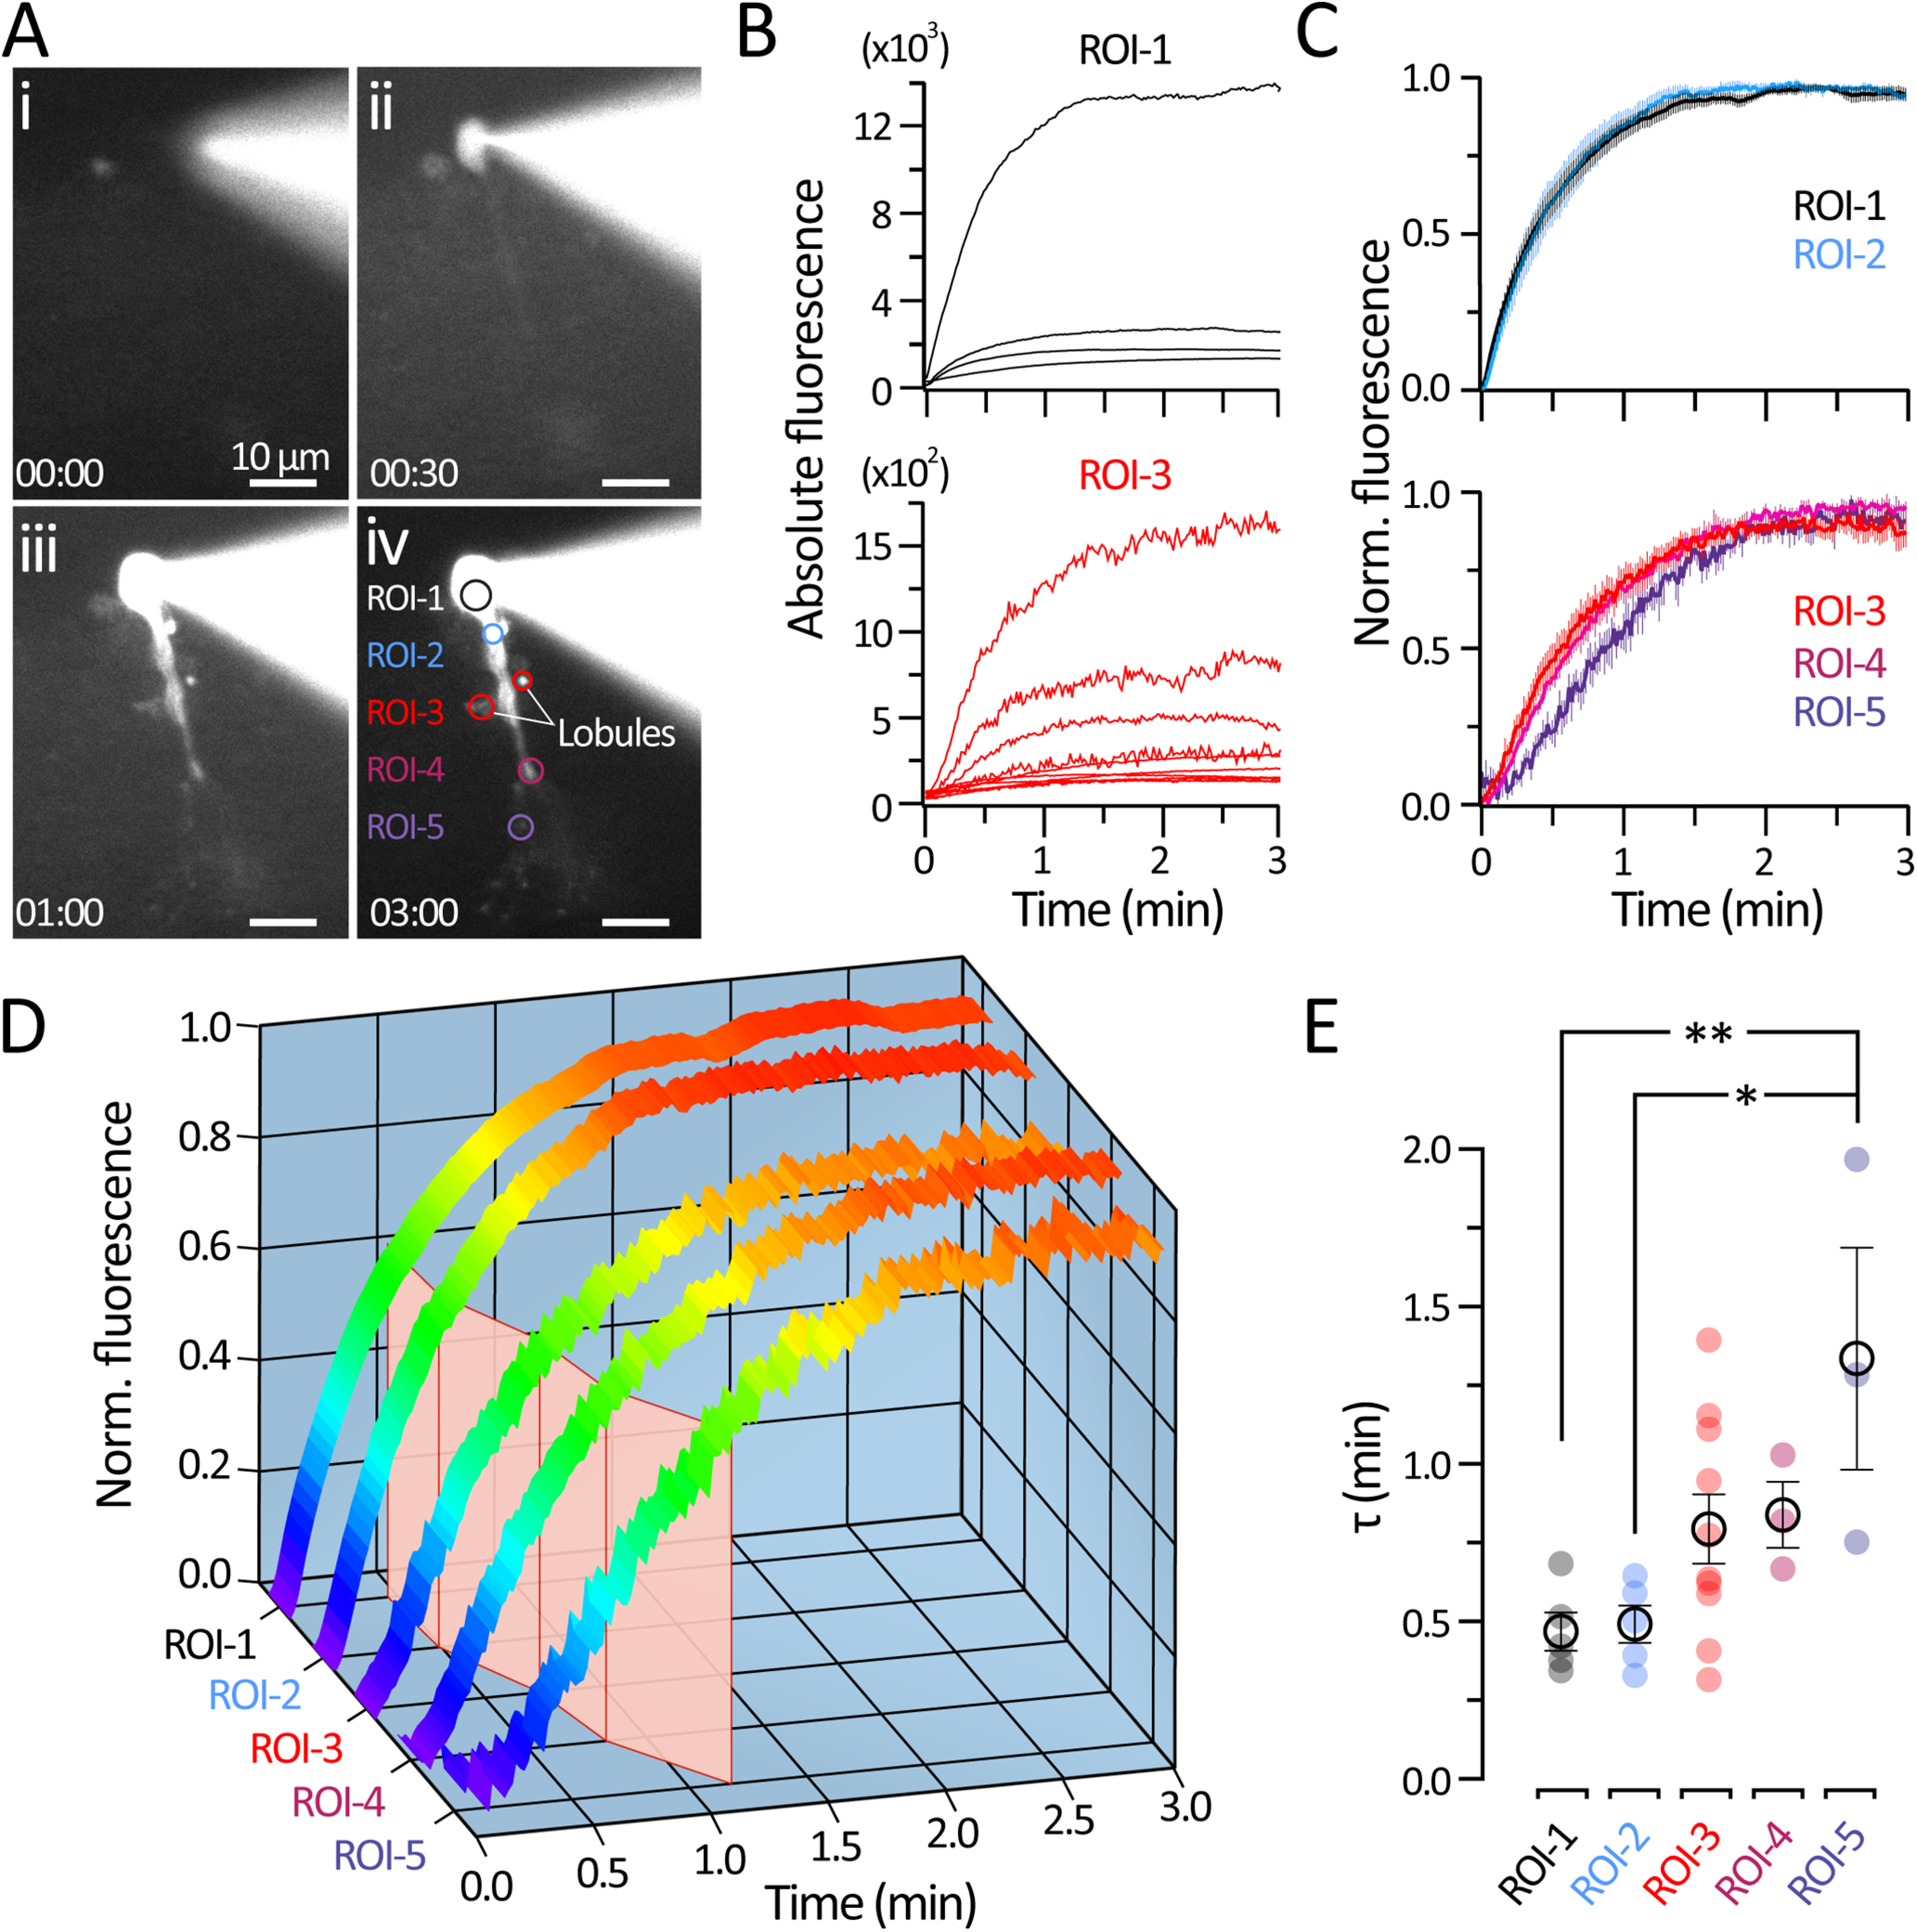
Dialysis time course of AII-ACs after whole-cell break-in. A, Sequence of micrographs showing epifluorescence images of an AII-AC during whole-cell dialysis with an internal solution containing 20 μm Alexa-488. Image stacks were acquired (see Material and Methods) before break- in (Ai) and during whole-cell dialysis (Aii–Aiv). ROIs indicate morphologic features of the AI-ACs (1: soma; 2: root dendrite; 3: lobular varicosities; 4: dendrite branch; and 5: distal arboreal dendrite). Time displayed as mm:ss. Scale bar, 10 µm. B, Example traces of absolute fluorescence intensity from individual AII-AC somas (top) and multiple lobules (bottom). C, Traces of normalized fluorescence plotted as mean ± SEM. Top, Datasets from the soma (ROI-1; n = 5), and root dendrite (ROI-2; n = 5). Bottom, Datasets from the lobules (ROI-3; n = 10), dendrite branch (ROI-4; n = 3), and distal arboreal dendrite (ROI-5; n = 3). D, 3D histogram showing normalized fluorescence intensity profiles (same as in C). Traces are colored (violet to red) to indicate normalized fluorescence intensity. The mean time constant τ from an exponential fit (red plane) show the slower time course in distal processes of AII-ACs.. E, Plots of τ values obtained from exponential fits to raw fluorescence intensity traces. Closed circles represent data from individual ROIs. Open circles and error bars represent mean ± SEM. Statistical significance was determined using a one-way ANOVA and Tukey's test: *p < 0.05; **p < 0.01.
Specific ROIs were selected for measuring fluorescence intensity: the soma, lobular varicosities, dendritic branches, and distal dendritic arbors (Fig. 2B). Lobular appendages have diverse structures, so multiple lobules were selected from each cell to accommodate for variations in size and distance from the soma's central axis (Zandt et al., 2018). Changes in absolute fluorescence were observed immediately after the moment of break-in (t = 0 min) within the soma and plateaued within 3 min at distal compartments. Because of the wide range in fluorescence intensity among different ROIs (i.e., Fmax in the soma was 10-fold higher compared with lobules), traces were normalized for comparing diffusion rates (Fig. 2C). By comparing normalized fluorescence intensity traces, we were able to better estimate the time course of diffusion of Alexa dye through complex structures of the AII-AC dendrites (Fig. 2C, left). Mean traces from each ROI plotted in 3D were pseudocolored (Fig. 2D) to show the time necessary to reach a steady fluorescence (red), illustrating that simple structures (soma and apical dendrite) reach a steady state faster than distal compartments (lobules and distal arboreal dendrites) where thinner and more complex dendritic branching may act as a diffusion barrier.
Individual fluorescent traces were fit with a single exponential function to estimate diffusion time constants. This diffusion time constant was a linear function of the whole-cell Rs with positive slope (data not shown; Pearson's test; r = 0.9021; p = 0.036; n = 5) in agreement with previous studies (Neher and Almers, 1986; Oliva et al., 1988). Plotting the time constant τ values (Fig. 2E) shows that diffusion times in proximal compartments (soma and apical dendrite) saturate within seconds after break-in (τsoma = 0.47 ± 0.06 min; τapical = 0.49 ± 0.06 min). Slower τ values were seen for lobules and dendritic branch structures (τlobule: 0.85 ± 0.10 min; τbranch = 0.84 ± 0.11 min), although this trend was not significant. However, distal arboreal dendrites required significantly more time to reach the same level of fluorescence as the soma (τdistal = 1.34 ± 0.35 min; p < 0.03; n = 3), suggesting that the thin processes act as a diffusion barrier. After 3 min, even the distal arboreal dendrites were fully saturated with dye and reached a steady state. Similar observations were made for five distinct AII-ACs. The dialysis of Alexa-488 was complete within <3 min for all five AII-ACs. Given that the molecular weight of Alexa-488 (547.85 g/mol) is larger than cAMP (329.2 g/mol), these results suggest that the concentration of cAMP in the lobular appendages may also reach a steady-state level within <3 min after whole-cell break-in.
cAMP increases the initial and secondary vesicle pool size
The size of the RRP of synaptic vesicles can be determined by giving depolarizing pulses of increasing durations to evoke ΔCm jumps until a plateau level is reached. This protocol revealed two kinetically distinct pools of vesicles in AII-ACs (Balakrishnan et al., 2015). We measured Cm responses to a range of depolarizing pulse durations from 1 to 500 ms. The pulses were spaced 15-30 s apart, and results were quantified at 4 min after break-in across several AII-ACs using either control or 1 mm cAMP internal solutions. We estimated the effects of cAMP on the RRP size by plotting ΔCm as a function of the depolarizing pulse duration for each dataset (Fig. 3). Examples of ICa response to short (1-10 ms) and long pulses (100 ms) illustrate the similar peak amplitudes, total charge, and inactivation kinetics of the L-type Ca2+ currents from AII-ACs recorded with control and 1 mm cAMP internal solutions (Fig. 3A).
Figure 3.

Vesicle pool size increases with 1 mm cAMP in the patch pipette. A, Average ICa for different depolarizing pulse durations stepping from −80 to −10 mV recorded from AII-ACs using a control (blue) and 1 mm cAMP containing (red) internal solutions. Average ICa responses are shown for 1, 2, 5, 10, and 100 ms; the number cells (n) are labeled on each graph. All recordings were performed between 4 and 7 min after break-in and were spaced 15-30 s apart. The vertical scale bar is the same for all traces. Black lines on the 100 ms ICa show double exponential fits. The decay time constants had a fast (τ1; control: 5 ms, and cAMP: 6 ms) component, which was 56% of the total decay; and a slow component (τ2; control: 100 ms, and cAMP: 120 ms). B, Plot of ΔCm responses versus pulse durations ranging from 1 to 100 ms. The ΔCm saturates for pulse durations of ∼20-60 ms for controls (blue) and for 1 mm cAMP dataset (red). Solid lines indicate an exponential fit for control (R2 = 0.28) and 1 mm cAMP (R2 = 0.48) datasets. Time constants are labeled on the graph (control: τ = 3.28 ms; and cAMP: τ = 4.82 ms). The size of the RRP can be estimated from the saturating Cm responses for 40-60 ms pulses. C, Plot of ΔCm responses versus pulse durations ranging from 1 to 500 ms for control (blue) and 1 mm cAMP (red) datasets. Solid lines are double exponential fits to each dataset. The curve fitting improved for the control (R2 = 0.57) and cAMP (R2 = 0.65) datasets. Time constants are shown on the graph: control: τ1 = 2.02 ms (28.0%); τ2 = 330 ms, and 1 mm cAMP: τ1 = 3.17 ms (28.7%); τ2 = 285 ms. The double-exponential fit suggests that a secondary vesicle pool, with slower release kinetics, can be evoked for longer pulses. This secondary pool was also larger with 1 mm cAMP in the patch pipette. Open circles with error bars represent mean ± SEM. Statistical significance determined using unpaired parametric t tests: *p < 0.05; **p < 0.01; ****p < 0.0001. Results are summarized in Table 1.
The initial RRP was estimated using short pulses ranging from 1 to 100 ms in duration performed 4 min after break-in (Fig. 3B). The initial RRP size was determined by averaging responses from 40 to 100 ms for each dataset, which was significantly larger with 1 mm cAMP (control: 37.3 ± 1.85 fF; and cAMP: 63.4 ± 3.75 fF; p < 0.0001, Student's t test). Time constants from fitting with a single exponential function from 1 to 60 ms were similar (control: τ = 3.28 ms; and cAMP: τ = 4.82 ms), as well as the initial rate of exocytosis (control: 11.4 fF/ms; and cAMP: 13.2 fF/ms). Together, these results suggest cAMP is enhancing the size of the initial RRP of vesicles without altering the initial kinetics of exocytosis.
Longer depolarizing pulse durations (from 200 to 500 ms) revealed that ΔCm continued to rise for both the control and cAMP datasets (Fig. 3B). The entire dataset was well fit by a double exponential function. Both control and cAMP datasets have a fast initial RRP with similar time constants (τ1; control: 2.02 ms; and cAMP: 3.16 ms), which accounted for 28% of the total pool size. The remaining secondary pool had a much slower kinetics (control: τ2 = 330 ms; and cAMP: τ2 = 285 ms). The kinetics of the overall RRP were thus not greatly affected by cAMP. However, the overall RRP size was significantly larger with cAMP, which nearly doubled the size of the overall RRP (estimated using ΔCm averaged from 200 to 500 ms for control: 67.5 ± 3.65 fF; and cAMP: 108 ± 4.46 fF; p < 0.0001). Results and statistical tests are summarized in Table 1.
Table 1.
Vesicle exocytosis is enhanced by 1 mm cAMPa
| Duration | ΔCm Mean ± SEM | n | t test (p) |
|---|---|---|---|
| 1 ms | control: 8.79 ± 1.76 | 6 | 0.2948 (NS) |
| cAMP: 12.2 ± 2.57 | 6 | ||
| 2 ms | 17.3 ± 1.44 | 12 | 0.2991 (NS) |
| 20.3 ± 1.95 | 23 | ||
| 5 ms | 24.8 ± 2.27 | 14 | 0.0689 (NS) |
| 31.9 ± 2.72 | 19 | ||
| 10 ms | 29.1 ± 2.56 | 12 | 0.0184* |
| 41.2 ± 3.65 | 16 | ||
| 20 ms | 31.1 ± 3.42 | 18 | 0.003** |
| 48.0 ± 4.03 | 16 | ||
| 40 ms | 33.2 ± 4.25 | 14 | 0.0031** |
| 54.2 ± 4.80 | 13 | ||
| 60 ms | 35.6 ± 3.99 | 16 | 0.0263* |
| 52.4 ± 6.26 | 11 | ||
| 80 ms | 38.1 ± 4.24 | 12 | 0.0168* |
| 60.0 ± 7.91 | 8 | ||
| 100 ms | 39.9 ± 3.11 | 21 | <0.0001**** |
| 75.6 ± 7.05 | 22 | ||
| 200 ms | 57.9 ± 4.36 | 12 | 0.0039** |
| 87.6 ± 6.82 | 20 | ||
| 300 ms | 68.2 ± 5.97 | 11 | 0.001** |
| 110 ± 7.87 | 19 | ||
| 400 ms | 70.0 ± 8.48 | 6 | 0.005** |
| 112 ± 7.72 | 14 | ||
| 500 ms | 76.8 ± 10.1 | 10 | 0.0057** |
| 126 ± 10.9 | 17 |
aSummary results for Figure 3B and C displaying ΔCm responses to depolarizing pulse durations from 1 to 500 ms. Recordings were performed between 4 and 7 min after whole-cell break-in with control internal pipette solutions or with 1 mm cAMP containing internal solutions in separate groups of AII-ACs. Pulses were given in random order across different cells. ΔCm values are listed as mean ± SEM for control and 1 mm cAMP datasets. The number of AII-AC recordings (n) and results from a Student's t test are listed.
NS (p > 0.05);
*p < 0.05;
**p < 0.001;
****p < 0.0001.
Effects of 1 mm cAMP on paired-pulse depression
Like retinal ribbon synapses (Rabl et al., 2006; Cho and von Gersdorff, 2012), the synapses of ACs can exhibit strong paired pulse depression that takes several seconds to fully recover (Li et al., 2007; Vickers et al., 2012). To study short-term depression and test the effects of 1 mm cAMP on Pr and RRP size, we performed double-pulse ΔCm recordings. Paired-pulse depression was tested by measuring ΔCm responses for two depolarizing pulses (20 ms; from −80 to −10 mV) interleaved between sinewaves (2 kHz) and with an interpulse duration of 500 ms. This produced marked paired-pulse ΔCm depression (Fig. 4). Recordings were performed in AII-ACs within 1 min after whole-cell break-in and just after 4 min of break-in using a control internal solution (Fig. 4A) and an internal solution containing 1 mm cAMP (Fig. 4B). The ΔCm responses to the first pulse (ΔC1) for control experiments did not change after 4 min (1 min: 38.4 ± 4.26 fF; and 4 min: 38.1 ± 5.53 fF; n = 8; p = 0.8998, paired t test), but increased significantly with 1 mm cAMP (Fig. 4C; 1 min: 36.6 ± 4.05 fF; and 4 min: 54.7 ± 6.35 fF; n = 11; p = 0.0017, paired t test). The QCa values after 4 min were significantly reduced for both control (1 min: 1.92 ± 0.19 pC; and 4 min: 1.59 ± 0.23 pC; n = 8; p = 0.0369, paired t test) and 1 mm cAMP (1 min: 1.84 ± 0.21; and 4 min: 1.56 ± 0.19; n = 11; p = 0.0387, paired t test). However, the values of QCa at 1 min for control and cAMP, and at 4 min for control and cAMP, were not significantly different.
Figure 4.

Short-term plasticity: Effects of 1 mm cAMP on paired-pulse depression. Whole-cell voltage-clamp recordings of Cm and ICa from AII-ACs are shown for two consecutive depolarizing pulses (20 ms duration) separated by 500 ms. Recordings of Cm jumps show paired-pulse synaptic depression. Shown are Cm and ICa traces performed within 1 min (blue) and at 4 min (red) after whole-cell break-in. Labeled on the graph is the pulse number (P1 and P2) corresponding to each Cm jump (ΔC1 and ΔC2). Gray bar represents the region where Cm values were averaged. A, Average Cm and ICa traces for recordings performed using a control internal solution (with no cAMP). The ΔC2 is depressed with no change in the ICa. Also, ΔC1 and ΔC2 do not change after 4 min of recording. B, Average Cm and ICa recordings performed with an internal solution containing 1 mm cAMP. ΔC1 increases after 4 min. C-E, Summary plots showing pairwise comparisons for recordings made within 1 min (blue) and after 4 min (red) of break-in. Displayed are datasets for recordings with control (top) and 1 mm cAMP (bottom) internal solutions. Closed circles represent data from individual AII-AC. Open circles with error bars represent mean ± SEM. C, Summary plots of ΔC1 and ICa charge (Q1) for each dataset. With 1 mm cAMP, the ΔC1 increases after 4 min, while the Q1 decreases. D, Summary plots of the paired-pulse Cm jump ratio (ΔC2/ΔC1) and Q ratio (Q2/Q1). The Q ratio is near 1, indicating that the ICa charge for each pulse is unchanged. The paired-pulse ΔC2/ΔC1 and Q ratio after 4 min also do not change significantly. E, Summary plot for estimates of Bmax (maximum vesicle pool size). Bmax increases after 4 min with 1 mm cAMP. Statistical significance determined using a paired t test: ns, p > 0.05; *p < 0.05; **p < 0.01.
In both conditions, the ΔCm to the second pulse (ΔC2) was smaller than the first pulse (ΔC1), whereas ICa responses to both pulses were the same (Fig. 4A,B). The paired pulse ratio (PPR; ΔC2/ΔC1; Fig. 4D) did not change for control (1 min: 0.39 ± 0.06; and 4 min: 0.39 ± 0.03; n = 8; p = 0.9434, paired t test). The PPR for experiments with 1 mm cAMP exhibited a slight increase, but this was not significant (1 min: 0.37 ± 0.05; and 4 min: 0.47 ± 0.03; n = 11; p = 0.0841, paired t test). Paired-pulse depression cannot be explained by changes in ICa charge because Qratio (Q2/Q1) was ≅ 1.0 (Fig. 4D) and did not change significantly for control (1 min: 1.04 ± 0.06; and 4 min: 1.058 ± 0.05; n = 8; p = 0.8742, paired t test) or with cAMP (1 min: 1.02 ± 0.05; and 4 min: 1.08 ± 0.05; n = 11; p = 0.3613, paired t test). Estimates for the maximum overall pool size (Bmax; Fig. 4E) were calculated by using the following formula:
This formula assumes that the same fraction of the pool is released with each pulse (Gillis et al., 1996; M. Chen and von Gersdorff, 2019). If there is a larger fraction of release during the second pulse (e.g., because of residual Ca2+ from the first pulse) or significant vesicle recruitment during the second pulse, then Bmax will overestimate the actual initial pool size. Therefore, the actual pool size lies between ΔC1 and Bmax. There was no change in Bmax after 4 min for controls (1 min: 72.2 ± 14.8 fF; and 4 min: 63.05 ± 9.28 fF; n = 8; p = 0.4809, paired t test), but a significant increase for experiments with 1 mm cAMP (1 min: 64.5 ± 11.9 fF; and 4 min: 103 ± 10.9 fF; n = 11; p = 0.0143, paired t test). The PPR we measured varied from 0.4 to 0.5, which suggests a high Pr, reflecting the strength of our depolarizing pulse from −80 to −10 mV. We found that PPR did not change significantly with 1 mm cAMP; however, Bmax did increase significantly. This further supports our findings in Figure 3, suggesting that 1 mm cAMP increases the RRP size, without changing the release kinetics or the initial Pr.
cAMP enhances the exocytosis of AII-ACs from Cx36−/− mice
Electrical synapses are formed between AII-ACs through Cx36 gap junctions located at the distal arboreal dendrites, forming a vast AII-ACs coupled network (Hartveit and Veruki, 2012; Marc et al., 2014). We considered the possibility that cAMP may introduce artifacts by altering the coupling state between AII-ACs, which could change the input resistance (Vardi and Smith, 1996; Urschel et al., 2006; Veruki et al., 2010). We thus performed ΔCm recordings using standard solutions and with cAMP in the transgenic Cx36 KO (Cx36−/−) mouse (Hormuzdi et al., 2001; Christie, et al., 2005; Balakrishnan et al., 2015). This addresses the issue of whether cAMP-dependent modulation of gap junctions may influence an increase in the ΔCm jump size. Recordings from Cx36−/− AII-ACs produced normal ICa currents before 1 min and 4 min after break-in (Fig. 5A, inset). We observed no changes in QCa resulting from 100 ms pulses (1 min: 11.2 ± 1.54 pC; and 4 min: 12.0 ± 1.45 pC; n = 5; p = 0.5356, paired t test). ΔCm recordings were also performed before and after 1 mm cAMP dialysis (Fig. 5B). After 4 min of dialysis with cAMP, ΔCm increased significantly (1 min: 33.8 ± 5.83 fF; and 4 min: 60.4 ± 7.84 fF; n = 5; p = 0.0004, paired t test). These results are very similar to the WT mice and rule out the possibility that cAMP modulation of gap junctions are augmenting ΔCm jumps. We conclude that cAMP is enhancing vesicle fusion independently of gap junctions. Dialysis of 1 mm cAMP did not change Rs (1 min: 41.1 ± 9.69 mΩ; and 4 min: 45.0 ± 20.3 mΩ; n = 5; p = 0.8125, Wilcoxon) or Rm (1 min: 2100 ± 945 mΩ; and 4 min: 1203 ± 253.5 mΩ; n = 5; p = 0.0625, Wilcoxon). Compared with AII-ACs from WT C57 mice, 1 mm cAMP experiments with Cx36−/− did have significantly higher Rs (p = 0.035, Mann–Whitney) and Rm (p = 0.003, Mann–Whitney). We observed a higher average Rm in mutant Cx36−/− mice (2100 ± 945 mΩ at 1 min) than in WT C57 (1040 ± 247 mΩ at 1 min), as expected from the lack of gap junction coupling between AII-ACs in the Cx36−/− mouse retina.
Figure 5.

Effects of cAMP on exocytosis are independent of AII-AC gap junction coupling. Whole-cell voltage-clamp recordings in AII-ACs from Cx36−/− mice performed using an internal solution containing 1 mm cAMP. A, Average Cm and ICa responses to a 100 ms depolarizing pulse. Recordings were performed before 1 min (blue) and at 4 min (red) after break-in. Cm jumps are larger after 4 min, with no changes in ICa traces. Gray bar represents the region where Cm values were averaged. B, Summary plots for ΔCm and QCa showing pairwise comparisons between the time periods after break-in for each recording. Closed circles represent data from individual AII-ACs. Open circles with error bars represent mean ± SEM. ΔCm significantly increase after 4 min without any corresponding changes in QCa. Statistical significance determined using a paired t test: ns, p > 0.05; ***p < 0.001.
Forskolin enhances the exocytosis from AII-ACs
We have shown that vesicle exocytosis is enhanced by directly applying 1 mm cAMP through the patch pipette. Forskolin is a membrane-permeable activator of adenylyl cyclase that can enhance synaptic transmission by increasing endogenous levels of cAMP (C. Chen and Regehr, 1997; Tzounopoulos et al., 1998; Kamiya et al., 2002; Kaneko and Takahashi, 2004; Choi et al., 2009; Alasbahi and Melzig, 2012). We thus preincubated retinal slices with 25 μm forskolin for 30 min before whole-cell recordings. Forskolin was also continuously perfused during Cm and ICa recordings, whereas in separate control experiments cells within retinal slices were perfused with control Ames medium without forskolin (Fig. 6A). Figure 6B shows that, in AII-ACs treated with 25 μm forskolin, the ΔCm jumps evoked by 100 ms pulses were nearly twofold larger than in controls (control: 58.6 ± 7.95 fF, n = 11; and forskolin: 86.9 ± 9.92 fF, n = 13; p = 0.0408, Mann–Whitney). The QCa in cells with forskolin application was slightly larger than controls, although this was not significant (control: 10.9 ± 1.82 pC, n = 11; and forskolin: 13.5 ± 1.80 pC, n = 13; p = 0.2066, Mann–Whitney). Our results indicate that forskolin increases the ΔCm independent of the L-type Ca2+ channel and may be mediated by an increase in intracellular cAMP levels. Recorded Rs values (control: 24.4 ± 3.79 mΩ, n = 11; and forskolin: 21.9 ± 3.46 mΩ, n = 13; p = 0.6234; t test) and Rm (control: 509 ± 180 mΩ, n = 11; and forskolin: 237 ± 48.1 mΩ, n = 13; p = 0.1297; t test) did not change significantly.
Figure 6.

Upregulation of adenylyl cyclase potentiates exocytosis. Whole-cell voltage-clamp recordings were performed in retinal slices that were preincubated for 10 min with Ames (control; black) or containing in addition 10 μm forskolin (orange), a potent activator of adenylyl cyclase. A, The Cm and ICa recordings were performed 4 min after break-in. AII-ACs treated with forskolin produced on average larger ΔCm jumps than controls. Gray bar represents the region where Cm values were averaged. B, Summary plots for ΔCm (left), QCa (middle), and exocytosis efficiency (ΔCm/QCa; right) showing comparisons between AII-ACs for control and 10 μm forskolin datasets. Closed circles represent data from individual AII-ACs. Open circles with error bars represent mean ± SEM. ΔCm was significantly increased when 10 μm forskolin was present in the external solution, whereas QCa did not change significantly. Statistical significance was determined using an unpaired Student's t test: ns, p > 0.05; *p < 0.05.
Forskolin increases glycinergic inhibition to OFF-CBCs
OFF-CBC terminals receive glycinergic inhibition from AII-ACs (Wässle et al., 2009). We used whole-cell voltage-clamp recordings from OFF-CBCs to record glycinergic sIPSCs as a measure of spontaneous glycine release from AII-ACs, which are the most abundant AC in the mammalian retina (Fig. 7A). ON- and OFF-type BCs can be targeted by their soma position in the INL using infrared DIC optics and distinguished by their morphology when filled with fluorescent dyes (Fig. 7B). Figure 7B shows examples of ON-CBCs and OFF-CBCs. ON-CBC axon terminates in the ON-sublamina of the IPL (Fig. 7Bi), whereas OFF-CBCs terminate near the AII-AC lobules in the OFF-sublamina (Fig. 7Bii). Whole-cell voltage-clamp recordings from rat and/or mouse OFF-CBCs resulted in large inward sIPSCs when held at −70 mV. Subtypes of primate OFF-CBCs exhibit similar glycinergic sIPSCs (McLaughlin et al., 2021). Rat retina OFF-CBCs were used because they are larger and easier to identify and patch clamp. These sIPSCs were all sensitive to 2 μm strychnine, which blocked sIPSCs in 6 of 6 recordings in rat retina (Fig. 7C).
Figure 7.
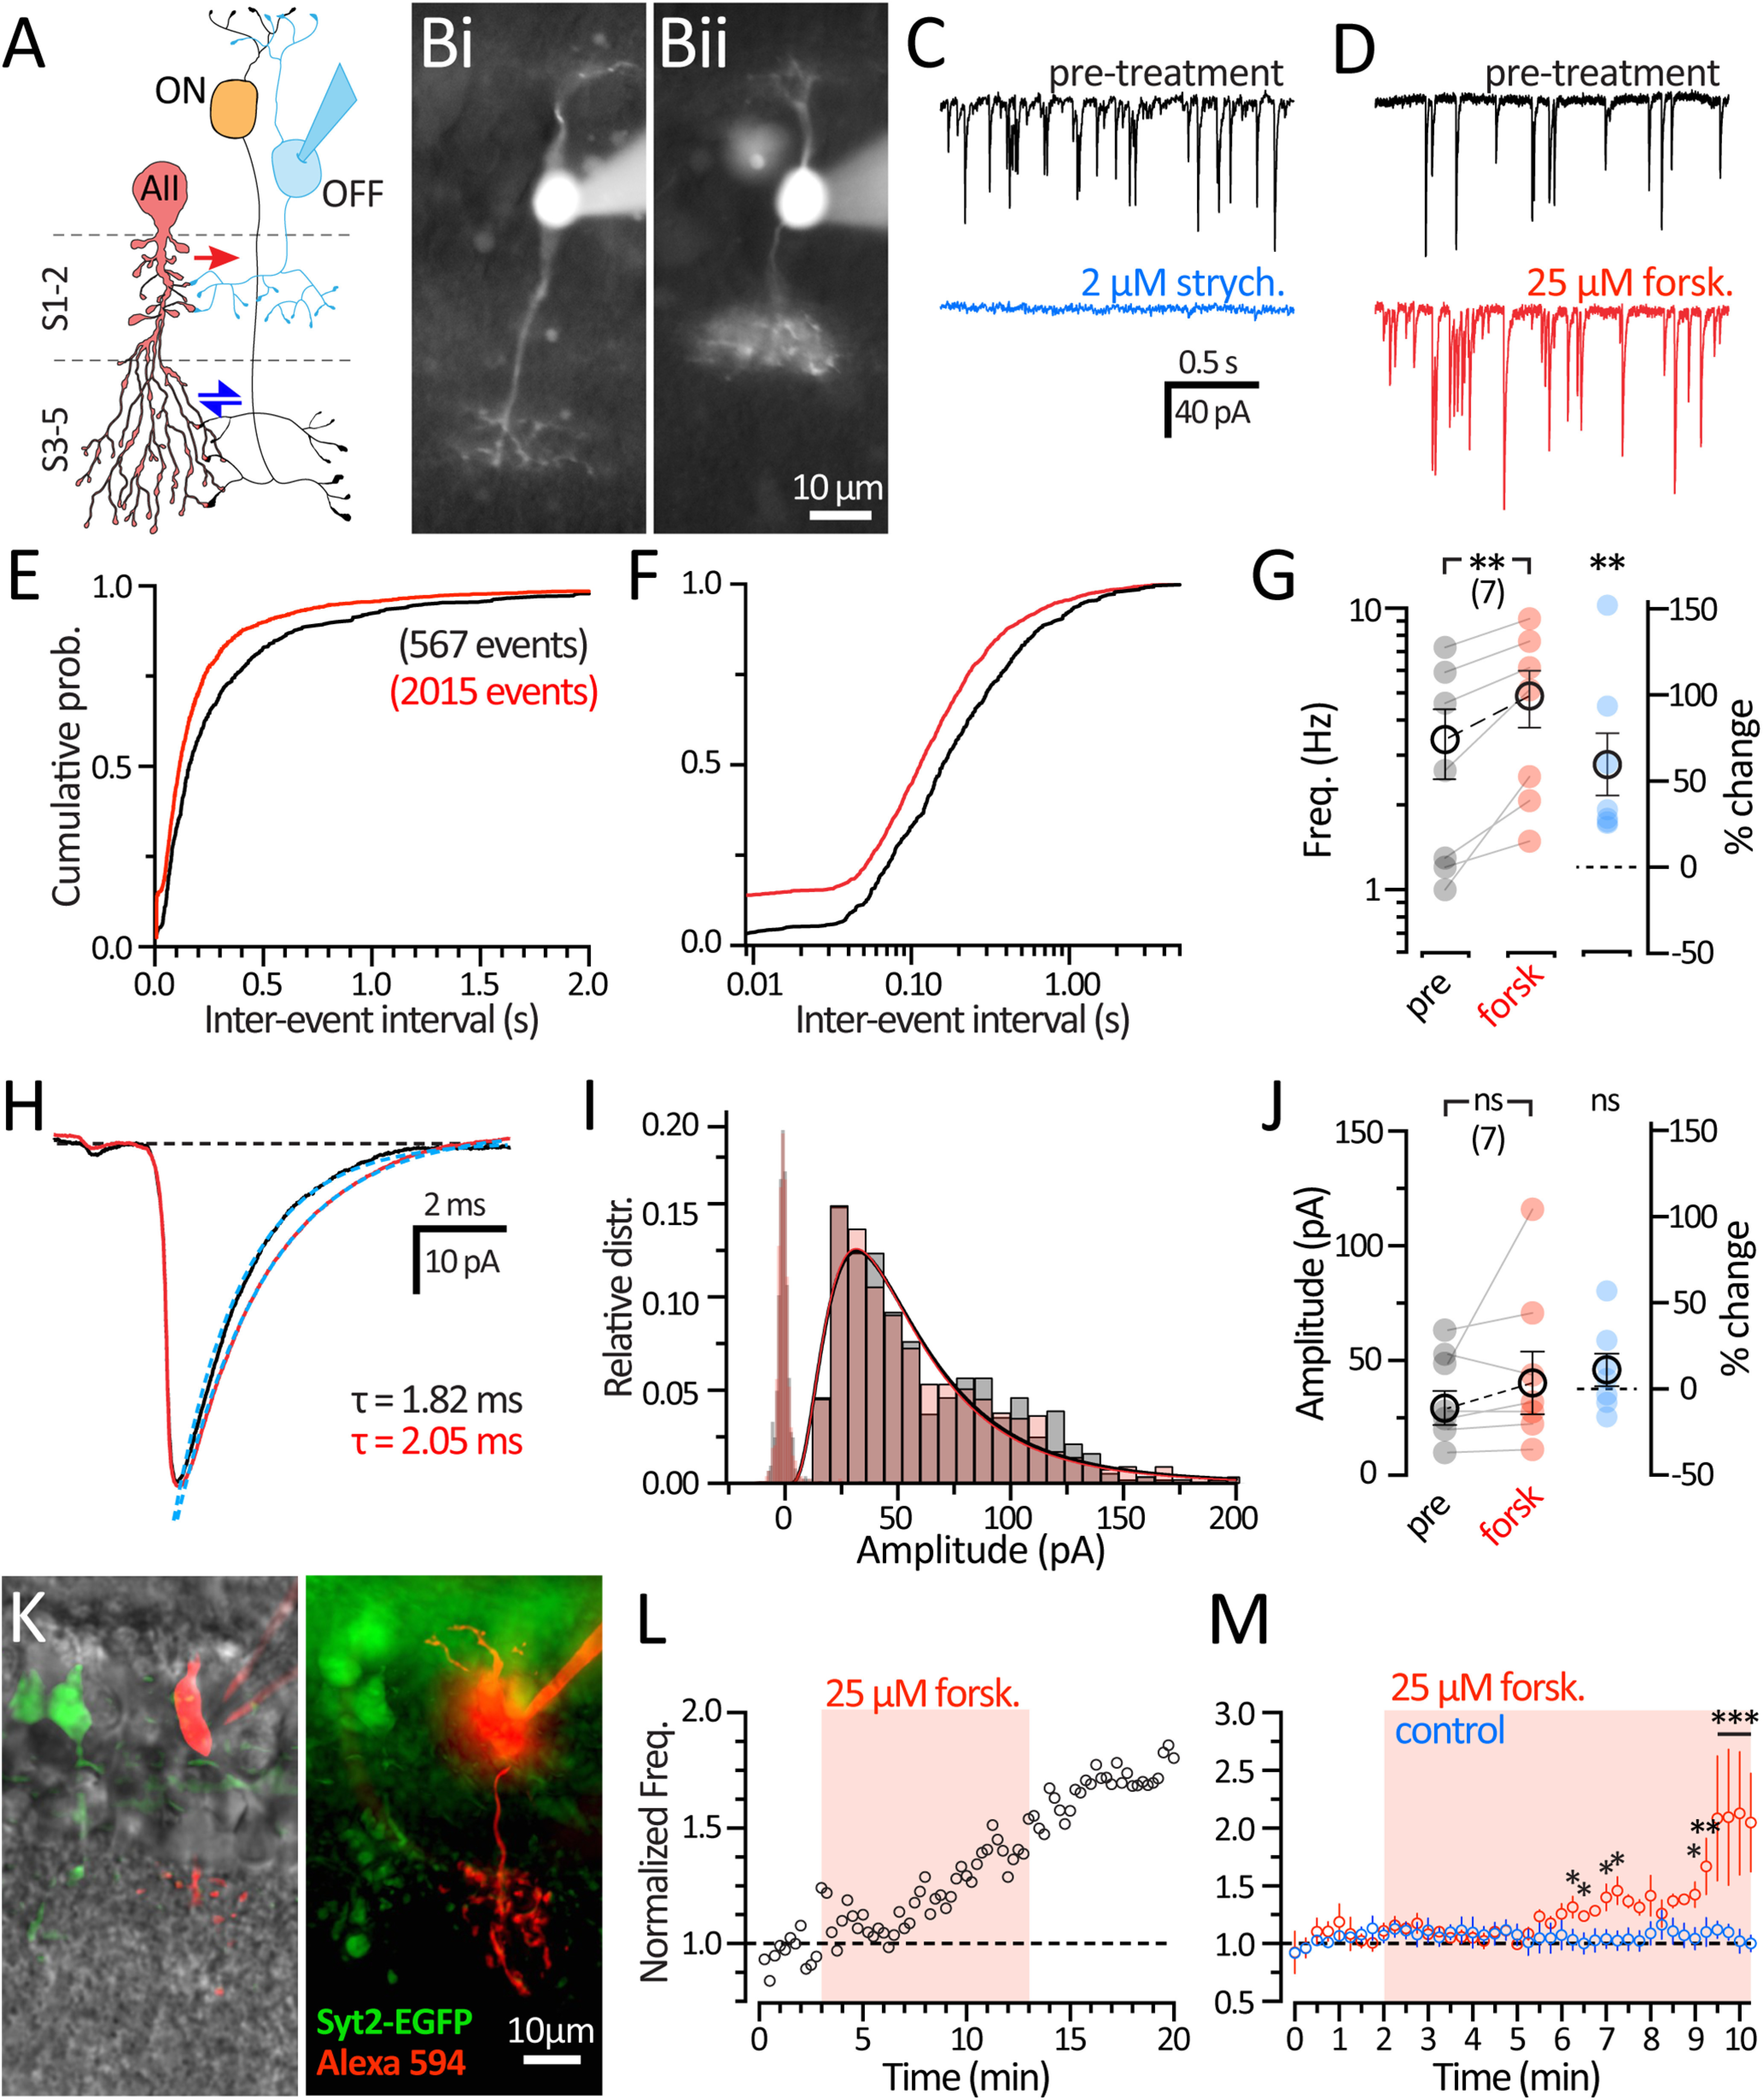
Upregulation of adenylyl cyclase leads to an increase in the frequency of spontaneous glycine release. A, Diagram of the crossover inhibition circuit showing that OFF-BCs receive glycinergic inhibition from AII-ACs. Whole-cell voltage-clamp experiments were performed in OFF-BCs, held at −70 mV, using a high chloride internal. B, Micrograph of epifluorescence images of CBCs in rat retinal slices after whole-cell recording with an internal solution containing 20 μm Alexa-488 dye. BC subtypes identified by their axon stratification in the ON (Bi) or OFF (Bii) sublamina of the IPL. OFF-CBCs were also targeted in transgenic Syt2-EGFP mice (K), and pooled with recordings from rats. C, Example OFF-BC recordings of glycinergic sIPSCs performed in Ames medium with synaptic blockers (see Materials and Methods). Recordings were made before (pretreatment; black) and after application of 2 μm strychnine (blue). sIPSCs are completely abolished with 2 μm strychnine. D, Example traces show sIPSCs before (pretreatment; black) and during 25 μm forskolin wash (red), which caused an increase in glycinergic sIPSCs. E, Histogram represents normalized cumulative distribution of interevent interval times between sIPSCs. Labeled on graph is the number of events detected (pretreatment: 567 events; and after 25 μm forskolin treatment: 2015 events; n = 7 cells). The application of forskolin shifted the distribution to left. F, Histogram represents the cumulative distribution (E) plotted on a log axis to illustrate the increase in events with small interevent interval. G, Plot of the sIPSC frequency showing the sIPSC rate recorded from OFF-BCs before (black) and during 25 μm forskolin wash (red). There is significantly larger sIPSC frequency with 25 μm forskolin. Also shown as percent change (right; blue). Statistical significance was determined using a Wilcoxon paired t test. H, Grand average traces of the sIPSC waveform before (black) and during 25 μm forskolin wash (red). Solid line indicates an exponential fit to the decay phase (blue dashed lines) with time constants labeled on the graph (pretreatment: 1.82 ms; and 25 μm forskolin: 2.05 ms). I, Histogram represents the relative frequency distribution of sIPSC amplitudes before (black) and during 25 μm forskolin wash (red). Binned values were fitted with a log-Gaussian function showing no changes in amplitude. Noise analysis (open bars) did not overlap with sIPSC amplitudes. J, Plot of the median sIPSC amplitudes from individual OFF-BCs before (black) and during 25 μm forskolin wash (red). Amplitudes did not change significantly after forskolin application, also shown as percent change (right; blue). Statistical significance was determined using a Wilcoxon paired t test. K, Micrograph of an epifluorescence image of OFF-BCs from a Syt2-EGFP mouse with a DIC overlay. Type 2 Off-BCs expresses GFP (green) and targeted for whole-cell recording with an internal containing 20 Alexa-594 (red). Maximum projection (z = 0.5 µm). L, Example diary plot of normalized sIPSC frequency (30 s bins; open circles) in a mouse OFF-BC during 25 μm forskolin treatment (red shading). M, Diary plot of mean values during 25 μm forskolin treatment (red circles; n = 6), and in control conditions (blue: n = 5). Open circles with error bars represent mean ± SEM. Statistical significance was determined using a two-way ANOVA and Sidak test for multiple comparisons: ns, p > 0.05; *p < 0.05; **p < 0.01; ***p < 0.001.
We next tested the effects of bath application of 25 μm forskolin during sIPSCs recordings. Figure 7D shows example traces from an OFF-CBC recording that illustrates sIPSCs before drug treatment (controls; top trace) and the subsequent increase in frequency occurring after 25 μm forskolin application (bottom trace). We quantified sIPSCs using custom mini analysis procedures (see Materials and Methods) for rat OFF-BCs (n = 7) and sIPSCs recorded in retinal slices from transgenic Syt2-EGFP mice (n = 3). Analysis from mouse and rat OFF-CBCs were grouped together (n = 10). Events measured 30 s before drug application (control; 4347 events) were compared with the last 60 s of recording during forskolin application (12,452 events). Figure 7E shows cumulative probability distributions of the interevent intervals between sIPSC events. The cumulative histogram shows that the interevent interval after the application of 25 μm forskolin significantly shifts to the left (p < 0.0001; Kolmogorov–Smirnov test). The shift to shorter interevent intervals can be better visualized in plots on a log time-scale (Fig. 7F). The absolute frequency was measured before and after 25 μm forskolin treatment for each OFF-CBC (Fig. 7G). The application of forskolin significantly increased the sIPSC frequency (pretreatment: 3.42 ± 0.96 Hz; and forskolin: 4.88 ± 1.12 Hz; p = 0.002, paired t test). These results indicate that forskolin is producing presynaptic changes that increase the frequency of spontaneous glycine release.
We also examined whether forskolin changes sIPSC amplitudes. Figure 7H shows the grand average waveform for all sIPSCs recorded before and after drug application. A distribution histogram comparing sIPSC amplitudes (Fig. 7I) suggests that sIPSC amplitude is not affected by forskolin. The centers of log-Gaussian fits (DF = 58) did not shift after forskolin treatment (control: 23.6 pA; R2 = 0.99, and forskolin: 24.6 pA; R2 = 0.97). Median sIPSC amplitudes from individual cells (Fig. 7J) also did not change significantly after forskolin treatment (control: 36.4 ± 6.44 pA; and forskolin: 41.8 ± 10.4 pA; p = 0.43; Wilcoxon). This suggests that forskolin does not cause changes to postsynaptic glycine receptors in OFF-CBCs or the quantal content of sIPSCs. However, the average sIPSC traces took slightly longer to decay after forskolin application. We speculate that higher release rates may produce excess glycine in the synaptic cleft, thereby increasing the open probability of glycine receptors, and perhaps causing significantly longer decay time constants (control: τ = 1.82 ± 0.43 ms; and forskolin: τ = 2.05 ± 0.42 ms; p = 0.03; Wilcoxon).
These results suggest that the forskolin is activating adenylyl cyclase and thus producing cAMP-induced changes that enhance the presynaptic release of glycine. We next determined the onset of potentiation by continuously recording sIPSCs during 25 μm forskolin application. OFF-CBCs were targeted in Syt2-EGFP mice that we backcrossed onto a C57 background (Fig. 7K). Figure 7L shows a diary plot of sIPSC frequency (15 s bins) across the duration of recording in a single OFF-CBC. The basal sIPSC frequency remained stable during the first 5 min of recording before forskolin reached the batch chamber. We observed an increase in frequency by 4 min of 25 μm forskolin treatment. Diary plots of average sIPSC frequency (15 s bins) are shown in Figure 7M. Bath application of 25 μm forskolin was given to OFF-BCs from mouse (n = 3) and rat (n = 3). Separate control experiments were performed in OFF-CBCS that did not receive drug application (n = 5). By 6.5 to 7.0 min after forskolin application, the frequency of IPSCs was significantly higher than control (p < 0.001; except at 6.75 min, p = 0.003), and by 7.25 min the frequency doubled (p < 0.0001; degrees of freedom = 91; two-way ANOVA and Sidak test).
cAMP potentiates exocytosis by an EPAC-dependent and PKA-independent mechanism
PKA is a kinase activated by cAMP and implicated in the uncoupling of AII-AII AC electrical synapses by mediating the dephosphorylation of Cx36 gap junctions (Urschel et al., 2006; Kothmann et al., 2009). We then tested whether PKA enhances glycinergic release at the AII-AC to OFF-BC synapse using an internal solution containing 1 mm cAMP and 2 μm H89, a competitive antagonist, highly specific for PKA (Hidaka et al., 1991). Example traces for experiments with 2 μm H89 (Fig. 8A1) illustrate that the antagonist did not suppress cAMP-induced potentiation in AII-ACs. Potentiation was consistently observed across several AII-ACs, resulting in a significant increase ΔCm even with 2 μm H89 (1 min: 60.2 ± 7.35 fF; and 4 min: 76.3 ± 8.17 fF; n = 9; p = 0.002, paired t test) with no changes in L-type QCa (1 min: 8.02 ± 0.91 pC; and 4 min: 7.95 ± 1.19 pC; n = 9; p = 0.874, paired t test; Fig. 8A2). Building on our finding that 1 mm cAMP enhances exocytosis in AII-ACs (Fig. 1), the result from this experiment suggests that cAMP-induced potentiation requires a PKA-independent pathway. Furthermore, we observed no changes in Rs values with 2 μm H89 (1 min: 20.7 ± 1.01 mΩ; and 4 min: 22.8 ± 2.17 mΩ; n = 9; p = 0.6523, Wilcoxon), and Rm (1 min: 529 ± 269 mΩ; and 4 min: 471 ± 332 mΩ; n = 9; p = 0.097, Wilcoxon).
Figure 8.
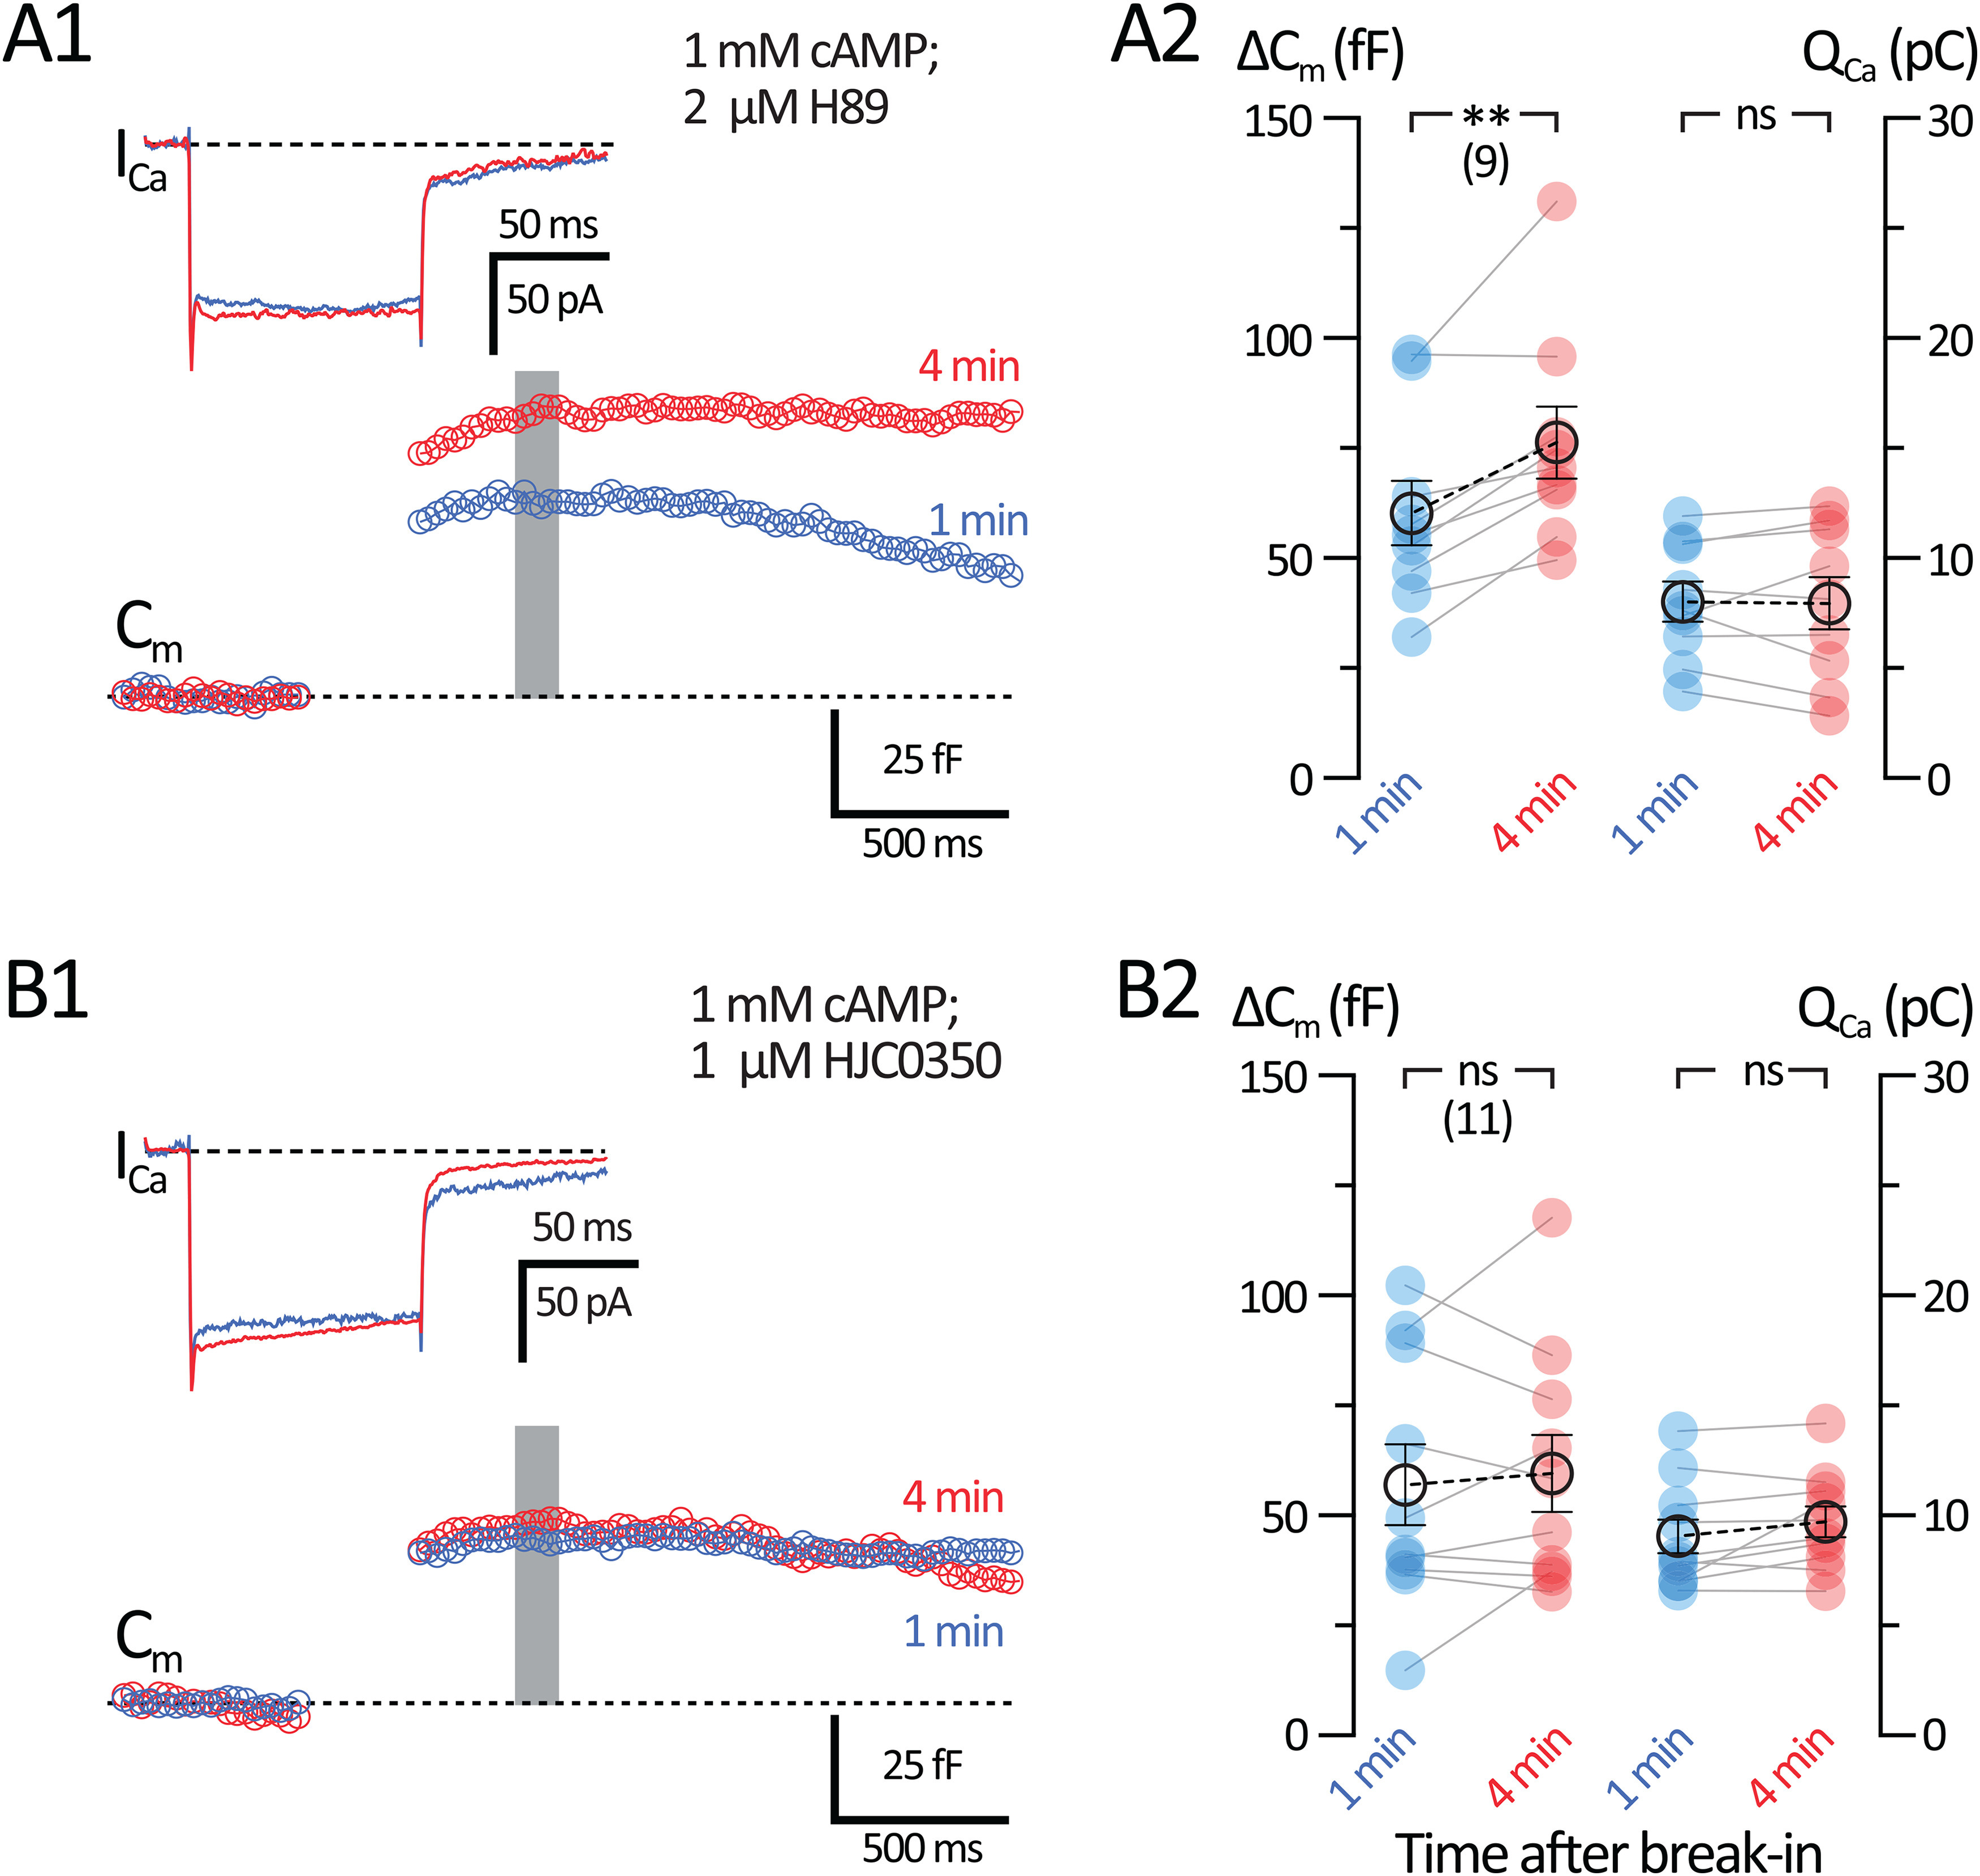
The mechanism for cAMP-induced potentiation is EPAC2-dependent. Whole-cell voltage-clamp recordings were performed in AII-ACs using an internal solution containing 1 mm cAMP. Internal solutions also contained either 2 μm H89 (PKA inhibitor) or 1 μm HJC0350 (EPAC2 inhibitor). A1, B1, Average Cm and ICa responses to a 100 ms depolarizing pulse. Shown are recordings made before 1 min (blue) and 4 min (red) after break-in. Gray bar represents the region where Cm values were averaged. A1, Cm and ICa responses from AII-ACs recorded with 2 μm H89. B1, Cm and ICa responses from AII-ACs recorded with 1 μm HJC0350. A2, B2, Summary plots of ΔCm and QCa showing pairwise comparisons for each time after break-in. Closed circles represent data from individual AII-ACs. Open circles with error bars represent mean ± SEM. A2, Summary plots for the 2 μm H89 dataset. ΔCm increases after 4 min with no changes to QCa, suggesting that 1 mm cAMP does not require PKA activation for cAMP-induced potentiation. B2, Summary plots for the 1 μm HJC0350 dataset. ΔCm does not increase after 4 min, suggesting that cAMP-induced potentiation is EPAC2-dependent. Statistical significance was determined using a paired t test: ns, p > 0.05; **p < 0.001.
We next tested the potential role of EPAC2 at this synapse by adding 1 μm HJC0350, a specific inhibitor of EPAC2 (H. Chen et al., 2013), to our internal solution containing 1 mm cAMP. Figure 8B1 shows representative ICa and Cm traces as AII-ACs were dialyzed with the internal solution. ΔCm did not increase after 4 min with 1 μm HJC0350 even with cAMP in the patch pipette (1 min: 57.0 ± 9.17 fF; and 4 min: 59.6 ± 8.69 fF; n = 10; p = 0.59, paired t test; Fig. 8B2). These results suggest that cAMP-induced potentiation of exocytosis relies on an EPAC2-dependent mechanism. Furthermore, there were no significant changes in QCa (1 min: 9.05 ± 0.77 pC; and 4 min: 9.71 ± 0.71 pC; n = 10; p = 0.112, paired t test). The mean Rs from recordings with 2 μm HJC0350 was as follows: 1 min: 25.4 ± 2.39 mΩ; and at 4 min: 24.2 ± 1.26 mΩ (n = 11; p = 0.5771; Wilcoxon); and mean Rm was as follows: 1 min: 1880 ± 1220 mΩ; and at 4 min: 759.8 ± 211 mΩ (n = 10; p = 0.3223, Wilcoxon).
Direct activation of EPAC potentiates exocytosis
EPAC2-mediated potentiation of exocytosis is widespread at synapses and secretory cells (Sakaba and Neher, 2001; Kamiya et al., 2002; Zhong and Zucker, 2005; Komai et al., 2014; Fernandes et al., 2015). We further tested for a role of EPAC mechanisms at AII-ACs with the specific EPAC activator 8-pCPT. This EPAC specific analog of cAMP has a threefold higher binding affinity than cAMP (Enserink et al., 2002); therefore, we substituted cAMP with 10 μm 8-pCPT in our internal solution. Figure 9A shows the detailed morphology of an AII-AC dialyzed with Alexa-488 after iterative image deconvolution. Figure 9B shows representative Cm and ICa traces recorded with 10 μm 8-pCPT in the patch pipette. Using 8-pCPT, we again did not see a significant change in QCa (1 min: 16.1 ± 2.46 pC; and 4 min: 15.2 ± 2.54 pC; n = 7; p = 0.565, paired t test). However, dialysis with 8-pCPT increased the ΔCm jumps significantly after 4 min from break-in (Fig. 9C; 1 min: 56.2 ± 10.9 fF; and 4 min: 93.3 ± 15.35 fF; n = 7; p = 0.021, paired t test). The efficiency of exocytosis also increased with 8-pCPT (1 min: 4.49 ± 1.21 fF/pC; and 4 min: 7.39 ± 1.48 fF/pC; n = 7; p = 0.0066, paired t test). Our concentration of 8-pCPT (10 μm) was 100-fold lower than what we used for cAMP (1 mm). Nevertheless, ΔCm jumps increased almost twofold with 8-pCPT. This supports our findings in Figure 8 that cAMP increases exocytosis via an EPAC2 pathway. The mean Rs was (1 min: 29.7 ± 5.7 mΩ; and 4 min: 32.7 ± 7.4 mΩ; n = 6; p = 0.2697, paired t test) and mean Rm was (1 min: 487.6 ± 121.4 mΩ; and 4 min: 348.7 ± 100.4 mΩ; n = 7; p = 0.042, paired t test).
Figure 9.
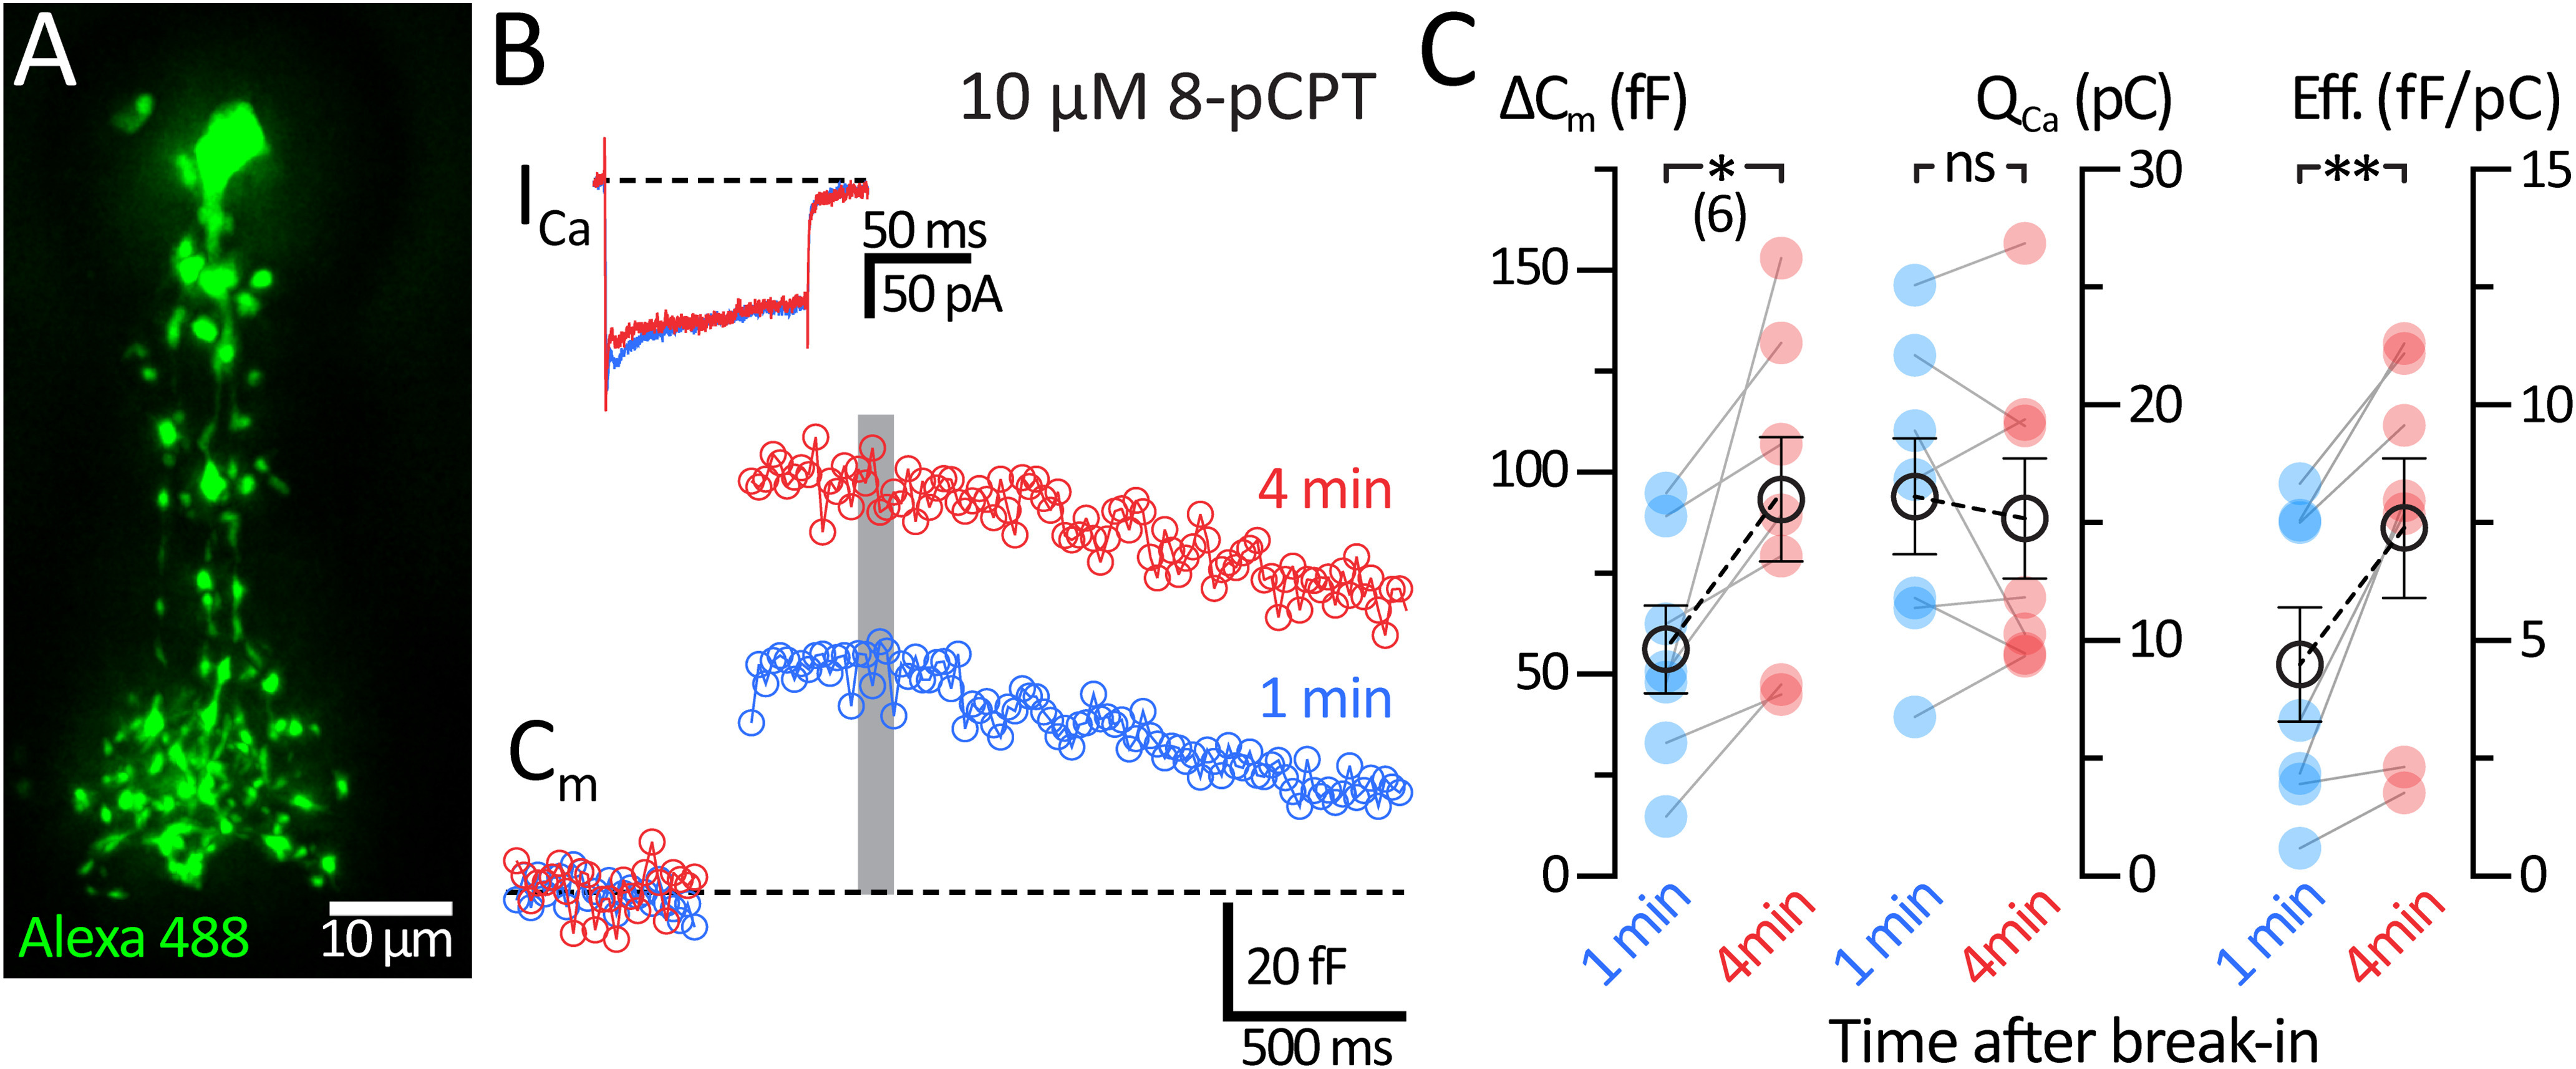
Direct activation of EPAC potentiates the exocytosis of AII-ACs. Whole-cell voltage-clamp recordings were performed in AII-ACs before 1 min and after 4 min after break-in using an internal solution containing 10 μm 8-pCPT (EPAC specific activator). A, Epifluorescence maximum intensity projection (z = 0.5 µm) of an AII-AC filled with Alexa-488 (20 μm), processed using iterative deconvolution. B, Example Cm and ICa traces for responses to a 100 ms depolarizing pulse performed within 1 min (blue) and at 4 min (red) after break-in. Gray bar represents the region where Cm values were averaged. C, Summary plots for ΔCm and QCa showing pairwise comparisons between each time after break-in. Closed circles represent data from individual AII-ACs. Open circles with error bars represent mean ± SEM. ΔCm increases after 4 min with no change in QCa, thus significantly increasing synaptic efficiency. Statistical significance was determined using a paired t test: ns, p > 0.05; *p < 0.05; **p < 0.001.
Inhibition of Ca2+ release from Ca2+ stores reduces cAMP-induced potentiation
Ca2+ induced Ca2+ release (CICR) is a major regulator of exocytosis at synapses (Padamsey et al., 2019). ACs use sarcoplasmic-endoplasmic reticulum (ER) Ca2+ pumps to regulate internal Ca2+ levels (Krizaj, 2005). EPAC2 has been shown to enhance CICR from the ER in a cAMP-dependent manner by modulating Ca2+ release from ryanodine and inositol 1,4,5-trisphosphate (IP3) receptors (Holz et al., 2006). CICR can trigger exocytosis at AC synapses (Warrier et al., 2005) and ribbon-type synapses of photoreceptors and hair cells (Babai et al., 2010; Castellano-Munoz et al., 2016). By contrast, short-term plasticity at several CNS synapses is not affected by CICR (Carter et al., 2002). EPAC2 is involved in CICR during β-cell insulin secretion (Rorsman et al., 2012; Stožer et al., 2021). However, EPAC2-dependent exocytosis enhancement and EPAC2-dependent CICR have not been observed previously in the retina. We used 2-APB (50 μm) as a competitive IP3 receptor antagonist and store-operated Ca2+ entry channel antagonist, which should deplete ER Ca2+ stores (Bootman et al., 2002; Majewski and Kuznicki, 2015). Importantly, 2-APB (50 μm) has been shown to significantly reduce CICR from depolarized GABAergic AC dendrites (Warrier et al., 2005). We incubated retina slices with 50 μm 2-APB for 10-15 min and then whole-cell voltage-clamped the AII-AC with an internal solution containing 1 mm cAMP while 50 μm 2-APB was continuously perfused (Fig. 10A1). ΔCm responses from AII-ACs pretreated with 2-APB slightly increased after 4 min, but this was not statistically significant (1 min: 44.1 ± 5.67 fF; and 4 min: 59.8 ± 12.3 fF; n = 10; p = 0.1197, paired t test; Fig. 10A2). The QCa slightly decreased after 4 min with the 2-APB pretreatment (1 min: 7.63 ± 0.487 pC; and 4 min: 6.27 ± 0.57 pC; n = 10; p = 0.0306, paired t test).
Figure 10.
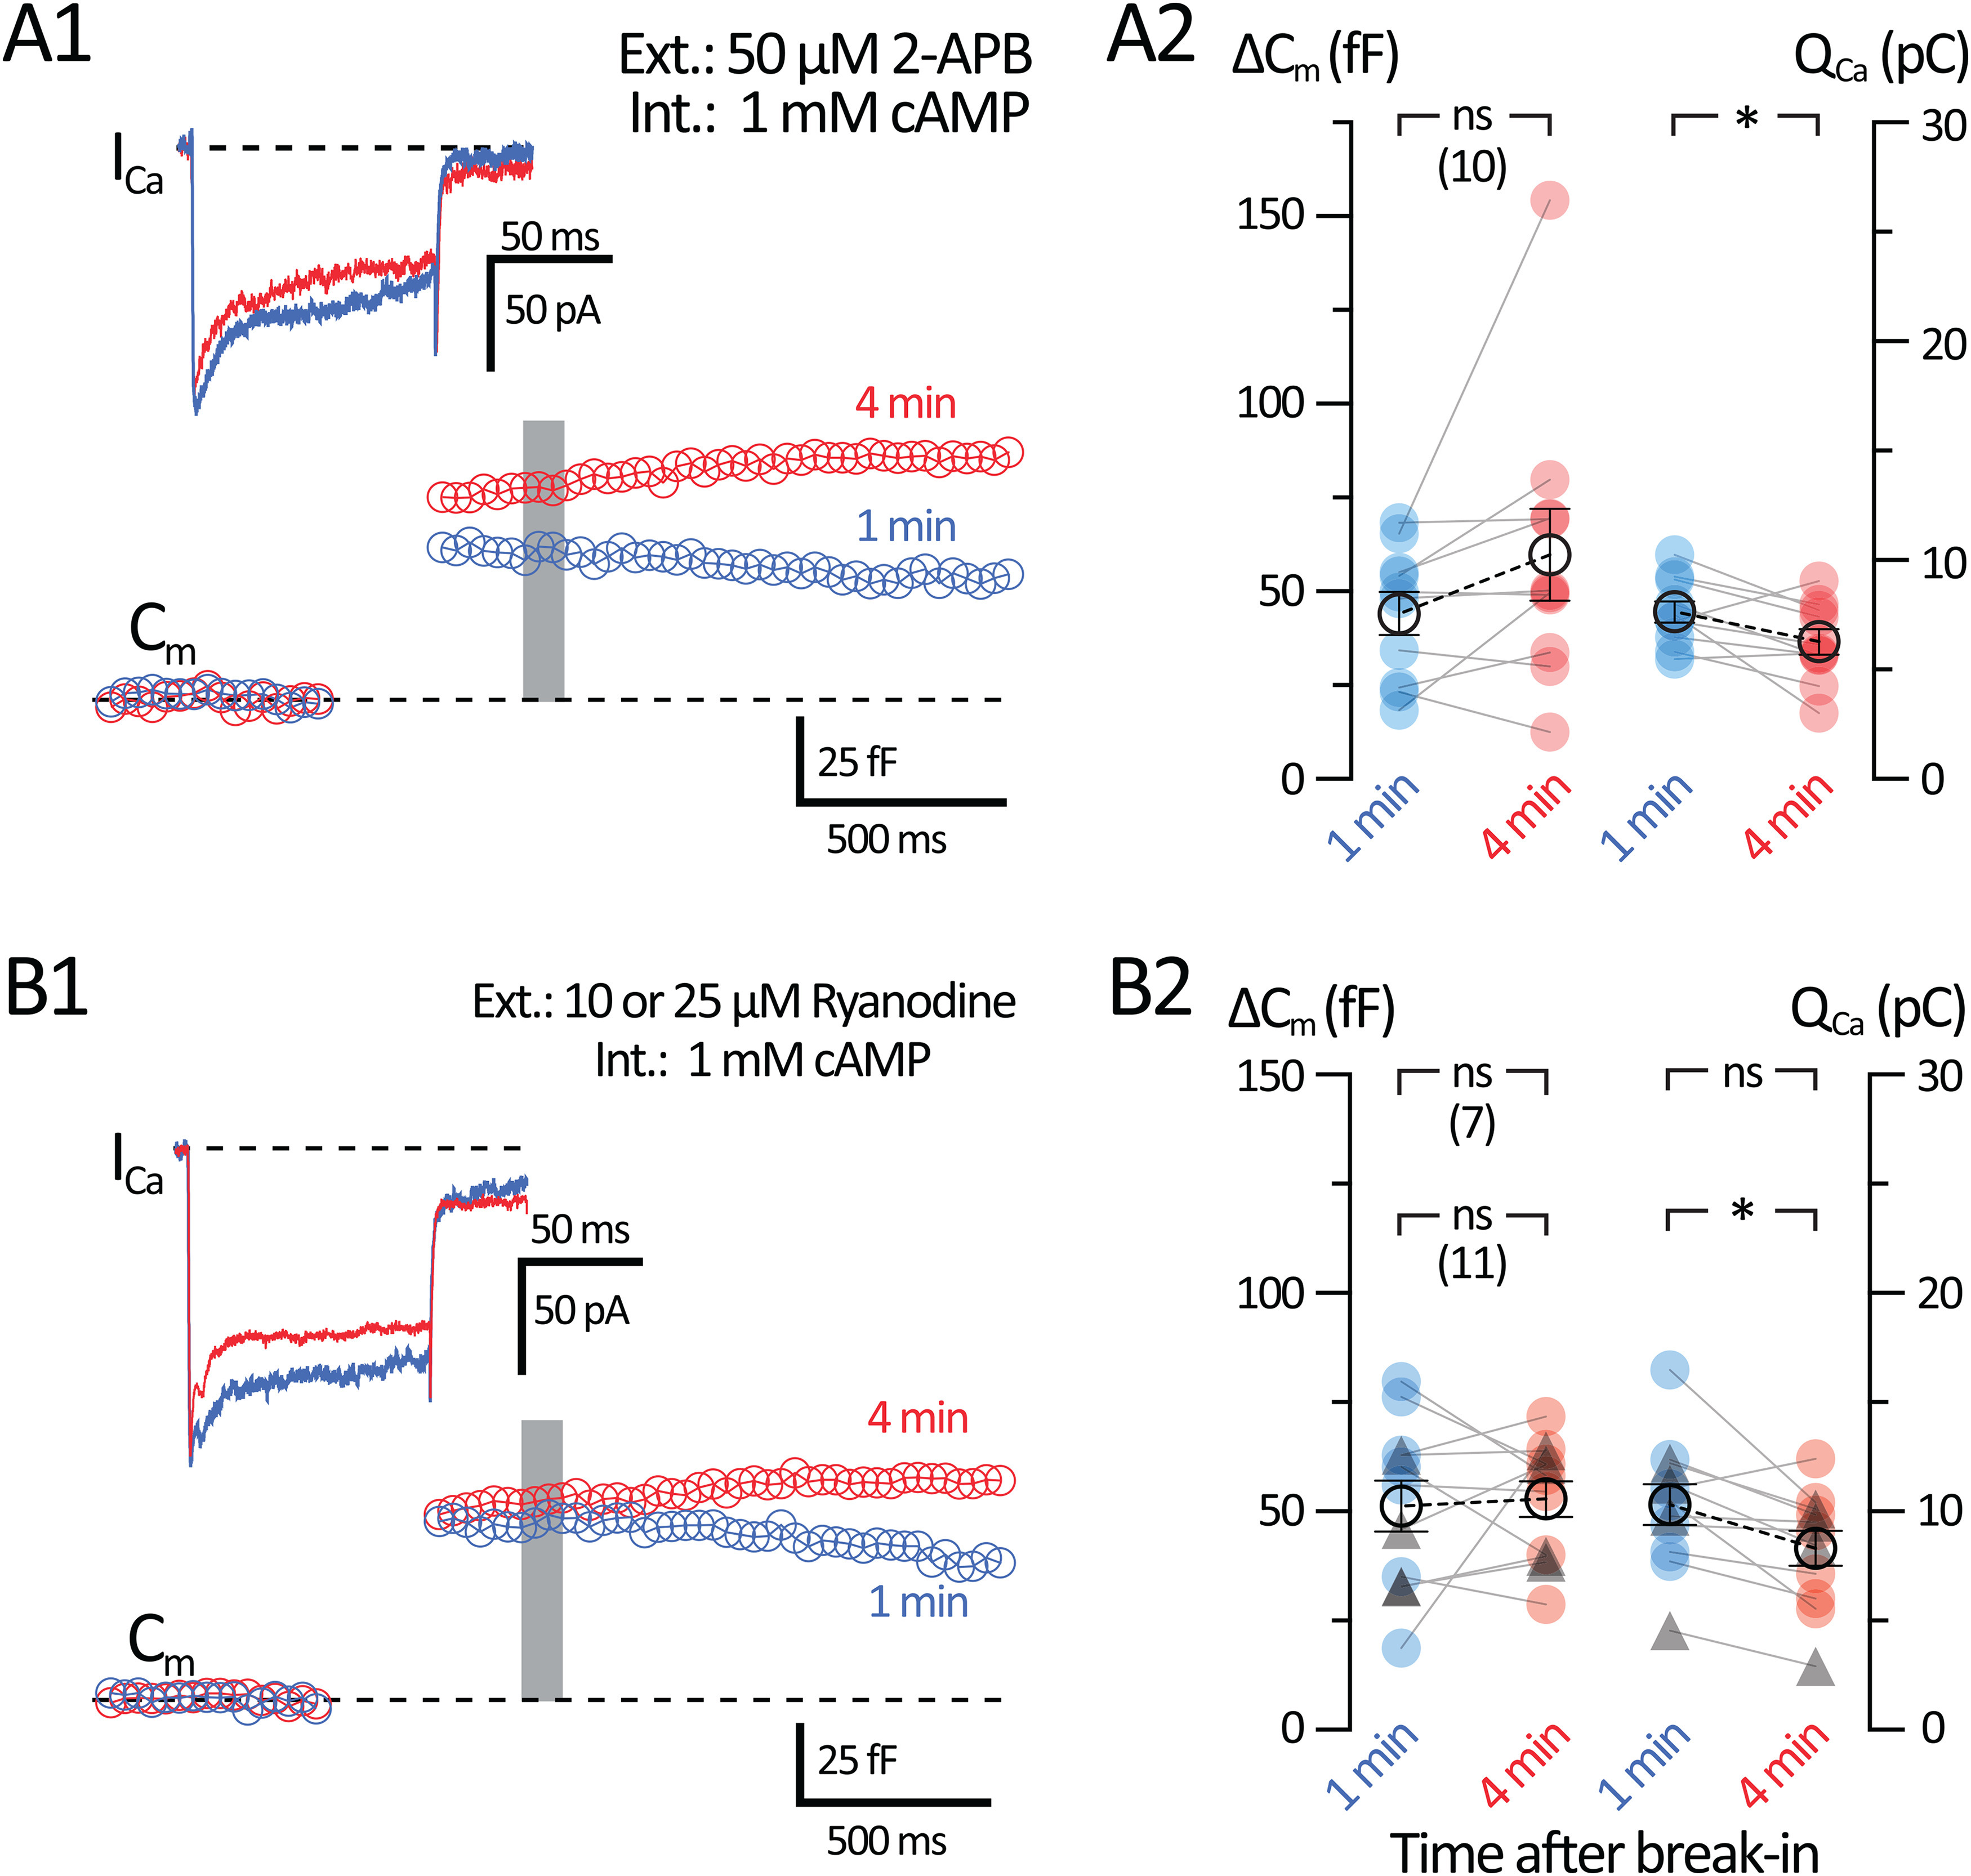
Inhibition of Ca2+ release from Ca2+ stores reduces cAMP-induced potentiation. Whole-cell voltage-clamp recordings were performed in AII-ACs using an internal solution containing 1 mm cAMP. The AII-ACs were preincubated for 10 min with 50 μm 2-APB (blocker of IP3 receptors and store-operated Ca2+ entry channels) or ryanodine (10 or 25 μm) in the external bath solution before whole-cell break-in. These drugs were then perfused continuously during the recordings. A1, B1, Average Cm and ICa responses from AII-ACs performed within 1 min (blue) and at 4 min (red) after break-in using an internal solution containing 1 mm cAMP. Gray bar represents the region where Cm values were averaged. A1, Average Cm and ICa responses for AII-ACs preincubated with 50 μm 2-APB. B1, Average Cm and ICa responses for AII-ACs preincubated with 10 or 25 μm ryanodine, which depletes and partially blocks Ca2+ stores. A2, B2, Summary plots for ΔCm and QCa for AII-ACs showing pairwise comparisons between each time after break-in. Closed circles represent data from individual cells. Open circles with error bars represent mean ± SEM. A2, Summary plots for the 50 μm 2-APB dataset. B2, Summary plots for the 10 or 25 μm ryanodine dataset. Triangles represent cells with 25 μm ryanodine (n = 4). Labeled on the graphs are statistical summaries for 10 μm ryanodine dataset (top; n = 7) and dataset including 25 μm ryanodine (bottom; n = 11). ΔCm does not increase after 4 min with 1 mm cAMP in the internal solution, while QCa decreases only for the whole combined dataset (n = 11). Statistical significance was determined using a paired t test: ns, p > 0.05; *p < 0.05.
To study CICR from ryanodine receptors (RyRs), we incubated retina slices with 10 μm ryanodine for 10-15 min before whole-cell voltage-clamp recordings with 1 mm cAMP in the internal solution (Fig. 10B1). Ryanodine at 10 μm can lock RyR in a low conductance state and thus cause a slow and tonic leak of Ca2+ from ER stores, thereby depleting them (Ehrlich et al., 1994; Kang et al., 2005; Ster et al., 2007). Slow Ca2+ release from ER stores triggered by 10 μm ryanodine can produce nonribbon Ca2+-dependent exocytosis in rod photoreceptors (M. Chen et al., 2014). Therefore, we also used a higher concentration (25 μm) to block Ca2+ release from RyR, as shown by Warrier et al. (2005) using caffeine to induce Ca2+ release from stores in AC dendrites (see also Sosa et al., 2002; Vigh and Lasater, 2003; Vigh et al., 2005; Chávez et al., 2010). Resulting ΔCm responses with a 1 mm cAMP internal did not potentiate 4 min after break-in when pretreated with 10 or 25 μm ryanodine (1 min: 51.3 ± 5.91 fF; and 4 min: 52.8 ± 4.15 fF; n = 11; p = 0.7863, paired t test; Fig. 10B2). QCa did not significantly decrease when 10 μm ryanodine was used (n = 7), although QCa did decrease significantly when we combined the datasets for 10 and 25 μm ryanodine (1 min: 10.3 ± 0.92 pC; and 4 min: 8.32 ± 0.81 pC; n = 11; p = 0.0104, paired t test). The reduction in QCa when Ca2+ stores were emptied may be because of Ca2+-dependent inactivation of the L-type Ca2+ current (von Gersdorff and Matthews, 1996). These results suggest that intact ER stores loaded with Ca2+ and thus capable of CICR are necessary for the cAMP-induced potentiation of exocytosis.
Discussion
This study used presynaptic capacitance measurements and postsynaptic recordings of sIPSCs to uncover mechanisms of cAMP-induced potentiation of glycine release from AII-ACs. We propose that cAMP plays dual roles in AII-ACs through two distinct morphologic compartments and signaling pathways: a PKA-dependent pathway uncouples electrical synapses at the distal tips of dendrites in layers S3-5 of the IPL (Kothmann et al., 2009), while cAMP binding to EPAC2 potentiates the exocytosis of synaptic vesicle fusion, enhancing crossover inhibition to OFF-CBCs at the lobular appendages in layers S1-2 of the IPL (Fig. 7A).
Elevation of cAMP concentration increases RRP size at AII-ACs
The lobular appendages of the AII-AC contain a large pool of glycine loaded vesicles in their cytoplasm and multiple extensive active zones with several docked vesicles (Strettoi et al., 1992; Marc et al., 2014). Here we show that both the initial RRP with a high release rate and the secondary RRP with slower rate were potentiated in size nearly twofold by intracellular 1 mm cAMP (Fig. 3). In the calyx of Held, nerve terminal cAMP changes the Ca2+ sensitivity of synaptotagmin, potentiating only the initial fast releasing pool of vesicles (Yao and Sakaba, 2010). Our results also contrast with results from hippocampal mossy fiber boutons, where cAMP only increases the initial release rate without changing the overall RRP size (Midorikawa and Sakaba, 2017).
Recent computer modeling of the AII-AC morphology in adult Sprague Dawley rats suggests that the thin dendrites may filter global Cm measurements when high-frequency sine waves are used (Zandt et al., 2018). Our measurements of total RRP size using a 2 kHz sinusoidal wave may therefore underestimate the total RRP of the AII-AC by 10%-20% (Hartveit et al., 2019). However, we have shown previously that reducing the sinusoidal frequency does not change the ΔCm jump size in our juvenile C57 mouse (postnatal days 16-28) AII-ACs, which we presume are more electrotonically compact (Balakrishnan et al., 2015), suggesting that the lobules are not electrotonically distant from the soma in mouse AII-ACs.
EPAC2 and Ca2+ store signaling pathways for exocytosis potentiation
The molecular pathways for cAMP-dependent potentiation differ across synapses (Seino and Shibasaki, 2005). PKA is a classic substrate for cAMP that promotes potentiation in hippocampal (Trudeau et al., 1996; Castillo et al., 1997) and cerebellar synapses (C. Chen and Regehr, 1997). PKA can enhance Ca2+ entry by directly phosphorylating L-type Ca2+ channels (Nanou and Catterall, 2018). However, enhancement of the Ca2+ current cannot explain cAMP-induced potentiation of exocytosis in AII-ACs because Ca2+ current peak amplitudes, charge, and inactivation kinetics did not change (Figs. 1, 3A, 5–9). Indeed, we observed a slight but significant reduction of QCa in some instances (Figs. 4 and 10). PKA-dependent increases in RRP can occur without changes in Pr via a shift in release mode from univesicular to coordinated multivesicular release (Vaden et al., 2019). However, our results show that cAMP potentiation of exocytosis in AII-ACs is mediated by EPAC2 (Figs. 8 and 9).
Presynaptic EPAC-dependent potentiation appears to be an evolutionary ancient modulatory pathway that has also been observed at the crayfish neuromuscular junction (Zhong and Zucker, 2005), as well as at spinal cord glycinergic interneurons (Katsurabayashi et al., 2001; Choi et al., 2009). Recently, an increase in RRP via EPAC2 has been shown at hippocampal mossy fiber synapses (Fernandes et al., 2015) and parallel fiber synapses to Purkinje cells (Martín et al., 2020). Hippocampal synapses may have a fast and slow mode of potentiation regulated by EPAC and PKA, respectively (Gekel and Neher, 2008). In pancreatic β cells, both PKA and EPAC2 potentiate Ca2+-dependent exocytosis, modulating the release of insulin large dense-core vesicles and small GABA vesicles (Eliasson et al., 2003; Hatakeyama et al., 2007; Henquin and Nenquin, 2014). Our findings show that cAMP enhancement of exocytosis is PKA-independent in AII-ACs. We confirmed this by (1) showing that H-89 does not block potentiation, (2) directly activating EPAC using the 8-pCPT analog, which has a 100-fold higher binding preference for EPACs over PKA (Enserink et al., 2002), and (3) directly blocking potentiation with a specific EPAC2 antagonist (HJC0350; 130-fold higher binding efficiency than cAMP) (H. Chen et al., 2013). We note that 8-pCPT may partially activate PKA (only 5%-7% at 50 μm) (Christensen et al., 2003). Direct activation of HCN channels by cAMP can also cause presynaptic potentiation (Zhong et al., 2004); however, Ih currents have not been reported in AII-ACs (Firl et al., 2015) and our experiments were performed in voltage-clamp. In summary, our results suggest that cAMP potentiation of exocytosis is solely driven by EPAC2 by increasing in RRP and without changing Pr as shown in PPR experiments (Fig. 4).
What are potential EPAC2-dependent molecular mechanisms that directly “superprime” the initial RRP and contribute to nearly doubling its size? Key proteins involved in vesicle priming are RIM, RBP, Rab3, and Munc13, and they are necessary for cAMP potentiation (Lonart et al., 1998; Castillo et al., 2002; Yang and Calakos, 2011). RIM proteins anchor Munc13 and Rab3 at active zones, and EPAC2 also binds to the scaffold proteins piccolo and RIM1/2 (Ozaki et al., 2000; Kashima et al., 2001; Schoch et al., 2002). RIM1/2 can also bind to the α-subunit of L-type Ca2+ channels via RBP to modulate exocytosis (Hibino et al., 2002; Grabner et al., 2015; Krinner et al., 2017) or directly to the β-subunit of Cav1.3 to modulate Ca2+ current inactivation (Gandini et al., 2011). These are all potential downstream targets of EPAC2 and need further characterization.
Additionally, we also found that inhibiting CICR from internal Ca2+ stores reduced cAMP-induced potentiation (Fig. 10). Our results with H89 (Fig. 8) suggest that PKA does not alter CICR. EPAC2 can trigger CICR by enhancing RyR and IP3 receptors (Holz et al., 2006). EPAC2 mediates RyR phosphorylation via CaMKII (Pereira et al., 2013). Cerebellar neurons also exhibit EPAC2-dependent modulation of CICR through Rap and p38 MAPK activation (Ster et al., 2007). Spontaneous release can also be regulated by CICR (M. Chen et al., 2014; Williams and Smith, 2018; Chanaday et al., 2021), which may explain the increase in sIPSCs seen in Figure 7. In summary, our results suggest that the cAMP-induced potentiation of exocytosis in AII-ACs requires both EPAC2 and CICR from intact Ca2+ stores; however, more work is necessary to determine in detail how EPAC2 and Ca2+ stores interact to promote exocytosis.
Neuromodulators can increase cAMP levels
The second messenger cAMP plays multiple roles in visual processing by tuning retinal circuits during development and sharpening local receptive fields (Stellwagen et al., 1999; Dunn et al., 2009). Fluorescent imaging of cAMP levels has shown that forskolin and several neuromodulators can increase cAMP levels in CNS nerve terminals (Vincent et al., 2008; Muntean et al., 2018). Among neuromodulators, dopamine, in particular, is responsible for long-lasting changes in retinal circuitry (Roy and Field, 2019). Dopamine also promotes the release of the antioxidant ascorbate from retinal neurons via EPAC2 (Encarnação et al., 2018). Dopamine and forskolin can potentiate exocytosis from BCs (Heidelberger and Matthews, 1994), and modulate AII-AC networks by closing gap junctions (Hampson et al., 1992). Dopaminergic ACs form en passant synapses around the root dendrite of AII-ACs (Voigt and Wässle, 1987), and there is evidence that AII-ACs exhibit D1-like receptor activity (Witkovsky et al., 2007). However, antibody localization of D1-like receptors in AII-ACs still remains uncertain (Veruki and Wässle, 1996). Interestingly, D1-like receptor activation reduces glycinergic inhibition to OFF-BCs and changes the spike output of ganglion cells during photopic conditions (Jensen, 1989; Mazade et al., 2019; Mazade and Eggers, 2020). It is possible that D1-like activity can increase cAMP in AII-ACs while reducing inhibition through global changes in retinal networks. Further studies are clearly needed to better understand the complex effects of light-evoked neuromodulator release on the local cAMP levels of AII-ACs.
Chemical compartmentalization, adenylyl cyclases, and microdomains of cAMP
The AII-AC is a bistratified neuron with well-separated cellular compartments (Figs. 1B and 9A). Indeed, changes in Ca2+ levels within a particular lobular appendage do not spread to nearby lobules or dendrites (Balakrishnan et al., 2015; Kim and von Gersdorff, 2016). Likewise, physiological changes in cAMP levels at different lobules or in the distal dendritic arbors may all occur locally and independently of each other.
Our recordings of sIPSCs from the OFF-CBCs show a significant increase in the frequency of sIPSC after forskolin application (Fig. 7). This continuous and robust release of glycine is presumably potentiated by elevations of cAMP via stimulation of adenylyl cyclases by forskolin. Changes in cAMP levels may also be regulated by Ca2+-dependent adenylyl cyclases near L-type Ca2+ channels (Halls and Cooper, 2011). Local clustering of adenylyl cyclases may elevate cAMP to the higher levels needed to activate EPAC2 and translocate it to docked vesicles (Alenkvist et al., 2017), whereas cytoplasmic phosphodiesterases may confine high cAMP levels to local microdomains near the plasma membrane (Rich et al., 2001; Kuhn and Nadler, 2020). The lobular appendage geometry (small bubble-like structures, densely packed with vesicles and mitochondria, and connected by thin and short tubes to the apical dendrite) seems ideally suited to form diffusional barriers that restrict Ca2+ and cAMP microdomains near the membrane where synaptic vesicles are docked.
In conclusion, our findings show that elevations of cAMP in the AII-ACs can increase both phasic and tonic inhibition to OFF-CBC terminals and OFF ganglion cells (Balakrishnan et al., 2015; Graydon et al., 2018). We propose that these changes in glycine release may help to reduce synaptic noise contamination between the OFF and ON pathways of the retina. This may help to sharpen contrast gain at different ambient light levels (Freed and Liang, 2014).
Footnotes
This work was supported by National Institutes of Health Grants EY014043 and DC12938 to H.v.G.; and Casey Eye Institute P30 Grant EY010572. We thank Gary Westbrook for providing the Cx36−/− mice; Holger Taschenberger for providing mini-IPSC software analysis procedures; laboratory members Andre Dagostin, Colin Wakeman, and Benjamin Zemel, and also Benjamin Sivyer, Chad Grabner, Espen Hartveit, Catherine Morgans, Stephen Smith, and Margaret Veruki for perspectives and numerous discussions.
The authors declare no competing financial interests.
References
- Alasbahi RH, Melzig MF (2012) Forskolin and derivatives as tools for studying the role of cAMP. Pharmazie 67:5–13. [PubMed] [Google Scholar]
- Alenkvist I, Gandasi NR, Barg S, Tengholm A (2017) Recruitment of EPAC2 to insulin granule docking sites regulates priming for exocytosis. Diabetes 66:2610–2622. 10.2337/db17-0050 [DOI] [PubMed] [Google Scholar]
- Ames A, Nesbett F (1981) In vitro retina as an experimental model of the central nervous system. J Neurochem 37:867–877. 10.1111/j.1471-4159.1981.tb04473.x [DOI] [PubMed] [Google Scholar]
- Babai N, Morgans CW, Thoreson WB (2010) Calcium-induced calcium release contributes to synaptic release from mouse rod photoreceptors. Neuroscience 165:1447–1456. 10.1016/j.neuroscience.2009.11.032 [DOI] [PMC free article] [PubMed] [Google Scholar]
- Balakrishnan V, Puthussery T, Kim MH, Taylor WR, von Gersdorff H (2015) Synaptic vesicle exocytosis at the dendritic lobules of an inhibitory interneuron in the mammalian retina. Neuron 87:563–575. 10.1016/j.neuron.2015.07.016 [DOI] [PMC free article] [PubMed] [Google Scholar]
- Bootman MD, Collins TJ, Mackenzie L, Roderick HL, Berridge MJ, Peppiatt CM (2002) 2-Aminoethoxydiphenyl borate (2-APB) is a reliable blocker of store-operated Ca2+ entry but an inconsistent inhibitor of InsP3-induced Ca2+ release. FASEB J 16:1145–1150. 10.1096/fj.02-0037rev [DOI] [PubMed] [Google Scholar]
- Carter AG, Vogt KE, Foster KA, Regehr WG (2002) Assessing the role of calcium-induced calcium release in short-term presynaptic plasticity at excitatory central synapses. J Neurosci 22:21–28. [DOI] [PMC free article] [PubMed] [Google Scholar]
- Castellano-Munoz M, Schnee ME, Ricci AJ (2016) Calcium-induced calcium release supports recruitment of synaptic vesicles in auditory hair cells. J Neurophysiol 115:226–239. 10.1152/jn.00559.2015 [DOI] [PMC free article] [PubMed] [Google Scholar]
- Castillo PE, Janz R, Sudhof TC, Tzounopoulos T, Malenka RC, Nicoll RA (1997) Rab3A is essential for mossy fibre long-term potentiation in the hippocampus. Nature 388:590–593. 10.1038/41574 [DOI] [PubMed] [Google Scholar]
- Castillo PE, Schoch S, Schmitz F, Sudhof TC, Malenka RC (2002) RIM1alpha is required for presynaptic long-term potentiation. Nature 415:327–330. 10.1038/415327a [DOI] [PubMed] [Google Scholar]
- Chanaday NL, Nosyreva E, Shin OH, Zhang H, Aklan I, Atasoy D, Bezprozvanny I, Kavalali ET (2021) Presynaptic store-operated Ca2+ entry drives excitatory spontaneous neurotransmission and augments endoplasmic reticulum stress. Neuron 109:1314–1332.e5. 10.1016/j.neuron.2021.02.023 [DOI] [PMC free article] [PubMed] [Google Scholar]
- Chávez AE, Grimes WN, Diamond JS (2010) Mechanisms underlying lateral GABAergic feedback onto rod bipolar cells in rat retina. J Neurosci 30:2330–2339. [DOI] [PMC free article] [PubMed] [Google Scholar]
- Chen C, Regehr WG (1997) The mechanism of cAMP-mediated enhancement at a cerebellar synapse. J Neurosci 17:8687–8694. 10.1523/JNEUROSCI.17-22-08687.1997 [DOI] [PMC free article] [PubMed] [Google Scholar]
- Chen H, Tsalkova T, Chepurny OG, Mei FC, Holz GG, Cheng X, Zhou J (2013) Identification and characterization of small molecules as potent and specific EPAC2 antagonists. J Med Chem 56:952–962. 10.1021/jm3014162 [DOI] [PMC free article] [PubMed] [Google Scholar]
- Chen M, von Gersdorff H (2019) How to build a fast and highly sensitive sound detector that remains robust to temperature shifts. J Neurosci 39:7260–7276. 10.1523/JNEUROSCI.2510-18.2019 [DOI] [PMC free article] [PubMed] [Google Scholar]
- Chen M, Krizaj D, Thoreson WB (2014) Intracellular calcium stores drive slow non-ribbon vesicle release from rod photoreceptors. Front Cell Neurosci 8:20. 10.3389/fncel.2014.00020 [DOI] [PMC free article] [PubMed] [Google Scholar]
- Cho S, von Gersdorff H (2012) Ca2+ influx and neurotransmitter release at ribbon synapses. Cell Calcium 52:208–216. 10.1016/j.ceca.2012.06.004 [DOI] [PMC free article] [PubMed] [Google Scholar]
- Choi IS, Nakamura M, Cho JH, Park HM, Kim SJ, Kim J, Lee JJ, Choi BJ, Jang IS (2009) Cyclic AMP-mediated long-term facilitation of glycinergic transmission in developing spinal dorsal horn neurons. J Neurochem 110:1695–1706. 10.1111/j.1471-4159.2009.06275.x [DOI] [PubMed] [Google Scholar]
- Christensen AE, Selheim F, de Rooij J, Dremier S, Schwede F, Dao KK, Martinez A, Maenhaut C, Bos JL, Genieser HG, Døskeland SO (2003) cAMP analog mapping of Epac1 and cAMP kinase: discriminating analogs demonstrate that Epac and cAMP kinase act synergistically to promote PC-12 cell neurite extension. J Biol Chem 278:35394–35402. 10.1074/jbc.M302179200 [DOI] [PubMed] [Google Scholar]
- Christie JM, Bark C, Hormuzdi SG, Helbig I, Monyer H, Westbrook GL (2005) Connexin36 mediates spike synchrony in olfactory bulb glomeruli. Neuron 46:761–772. 10.1016/j.neuron.2005.04.030 [DOI] [PubMed] [Google Scholar]
- Clements JD, Bekkers JM (1997) Detection of spontaneous synaptic events with an optimally scaled template. Biophys J 73:220–229. 10.1016/S0006-3495(97)78062-7 [DOI] [PMC free article] [PubMed] [Google Scholar]
- Demb JB, Singer JH (2012) Intrinsic properties and functional circuitry of the AII amacrine cell. Vis Neurosci 29:51–60. 10.1017/S0952523811000368 [DOI] [PMC free article] [PubMed] [Google Scholar]
- Dunn TA, Storm DR, Feller MB (2009) Calcium-dependent increases in protein kinase-A activity in mouse retinal ganglion cells are mediated by multiple adenylate cyclases. PLoS One 4:e7877. 10.1371/journal.pone.0007877 [DOI] [PMC free article] [PubMed] [Google Scholar]
- Ehrlich BE, Kaftan E, Bezprozvannaya S, Bezprozvanny I (1994) The pharmacology of intracellular Ca2+-release channels. Trends Pharmacol Sci 15:145–149. 10.1016/0165-6147(94)90074-4 [DOI] [PubMed] [Google Scholar]
- Eliasson L, Ma X, Renström E, Barg S, Berggren PO, Galvanovskis J, Gromada J, Jing X, Lundquist I, Salehi A, Sewing S, Rorsman P (2003) SUR1 regulates PKA-independent cAMP-induced granule priming in mouse pancreatic B-cells. J Gen Physiol 121:181–197. 10.1085/jgp.20028707 [DOI] [PMC free article] [PubMed] [Google Scholar]
- Encarnação TG, Portugal CC, Nogueira CE, Santiago FN, Socodato R, Paes-de-Carvalho R (2018) Dopamine promotes ascorbate release from retinal neurons: role of D1 receptors and the exchange protein directly activated by cAMP type 2 (EPAC2). Mol Neurobiol 55:7858–7871. 10.1007/s12035-018-0962-7 [DOI] [PubMed] [Google Scholar]
- Enserink JM, Christensen AE, de Rooij J, van Triest M, Schwede F, Genieser HG, Døskeland SO, Blank JL, Bos JL (2002) A novel Epac-specific cAMP analogue demonstrates independent regulation of Rap1 and ERK. Nat Cell Biol 4:901–906. 10.1038/ncb874 [DOI] [PubMed] [Google Scholar]
- Fernandes HB, Riordan S, Nomura T, Remmers CL, Kraniotis S, Marshall JJ, Kukreja L, Vassar R, Contractor A (2015) Epac2 mediates cAMP-dependent potentiation of neurotransmission in the hippocampus. J Neurosci 35:6544–6553. 10.1523/JNEUROSCI.0314-14.2015 [DOI] [PMC free article] [PubMed] [Google Scholar]
- Field GD, Sampath AP (2017) Behavioural and physiological limits to vision in mammals. Philos Trans R Soc Lond B Biol Sci 372:20160072. 10.1098/rstb.2016.0072 [DOI] [PMC free article] [PubMed] [Google Scholar]
- Firl A, Ke JB, Zhang L, Fuerst PG, Singer JH, Feller MB (2015) Elucidating the role of AII amacrine cells in glutamatergic retinal waves. J Neurosci 35:1675–1686. 10.1523/JNEUROSCI.3291-14.2015 [DOI] [PMC free article] [PubMed] [Google Scholar]
- Freed MA, Liang Z (2014) Synaptic noise is an information bottleneck in the inner retina. J Physiol 592:635–651. 10.1113/jphysiol.2013.265744 [DOI] [PMC free article] [PubMed] [Google Scholar]
- Gandini MA, Sandoval A, González-Ramírez R, Mori Y, de Waard M, Felix R (2011) Functional coupling of Rab3-interacting molecule 1 (RIM1) and L-type Ca2+ channels in insulin release. J Biol Chem 286:15757–15765. 10.1074/jbc.M110.187757 [DOI] [PMC free article] [PubMed] [Google Scholar]
- Gekel I, Neher E (2008) Application of EPAC activator enhances neurotransmitter release at excitatory central synapses. J Neurosci 28:7991–8002. 10.1523/JNEUROSCI.0268-08.2008 [DOI] [PMC free article] [PubMed] [Google Scholar]
- Gillis KD (2000) Admittance-based measurement of membrane capacitance using the EPC-9 patch-clamp amplifier. Pflugers Arch 439:655–664. 10.1007/s004249900173 [DOI] [PubMed] [Google Scholar]
- Gillis KD, Mossner R, Neher E (1996) Protein kinase C enhances exocytosis from chromaffin cells by increasing the size of the readily releasable pool of secretory granules. Neuron 16:1209–1220. 10.1016/s0896-6273(00)80147-6 [DOI] [PubMed] [Google Scholar]
- Grabner CP, Gandini MA, Rehak R, Le Y, Zamponi GW, Schmitz F (2015) RIM1/2 mediated facilitation of Cav1.4 channel opening is required for Ca2+-stimulated release in mouse rod photoreceptors. J Neurosci 35:13133–13147. 10.1523/JNEUROSCI.0658-15.2015 [DOI] [PMC free article] [PubMed] [Google Scholar]
- Grabner CP, Zenisek D (2013) Amperometric resolution of a prespike stammer and evoked phases of fast release from retinal bipolar cells. J Neurosci 33:8144–8158. 10.1523/JNEUROSCI.5062-12.2013 [DOI] [PMC free article] [PubMed] [Google Scholar]
- Graydon CW, Lieberman EE, Rho N, Briggman KL, Singer JH, Diamond JS (2018) Synaptic transfer between rod and cone pathways mediated by AII amacrine cells in the mouse retina. Curr Biol 28:2739–2751. 10.1016/j.cub.2018.06.063 [DOI] [PMC free article] [PubMed] [Google Scholar]
- Habermann CJ, O'Brien BJ, Wässle H, Protti DA (2003) AII amacrine cells express L-type calcium channels at their output synapses. J Neurosci 23:6904–6913. 10.1523/JNEUROSCI.23-17-06904.2003 [DOI] [PMC free article] [PubMed] [Google Scholar]
- Halls ML, Cooper DM (2011) Regulation of Ca2+-signaling pathways of adenylyl cyclases. Cold Spring Harb Perspect Biol 3:a004143. 10.1101/cshperspect.a004143 [DOI] [PMC free article] [PubMed] [Google Scholar]
- Hampson EC, Vaney DI, Weiler R (1992) Dopaminergic modulation of gap junction permeability between amacrine cells in mammalian retina. J Neurosci 12:4911–4922. [DOI] [PMC free article] [PubMed] [Google Scholar]
- Hartveit E, Veruki ML (2012) Electrical synapses between AII amacrine cells in the retina: function and modulation. Brain Res 1487:160–172. 10.1016/j.brainres.2012.05.060 [DOI] [PubMed] [Google Scholar]
- Hartveit E, Veruki ML, Zandt BJ (2019) Capacitance measurement of dendritic exocytosis in an electrically coupled inhibitory retinal interneuron: an experimental and computational study. Physiol Rep 7:e14186. 10.14814/phy2.14186 [DOI] [PMC free article] [PubMed] [Google Scholar]
- Hatakeyama H, Takahashi N, Kishimoto T, Nemoto T, Kasai H (2007) Two cAMP-dependent pathways differentially regulate exocytosis of large dense-core and small vesicles in mouse beta-cells. J Physiol 582:1087–1098. 10.1113/jphysiol.2007.135228 [DOI] [PMC free article] [PubMed] [Google Scholar]
- Heidelberger R, Matthews G (1994) Dopamine enhances Ca2+ responses in synaptic terminals of retinal bipolar neurons. Neuroreport 5:729–732. 10.1097/00001756-199402000-00018 [DOI] [PubMed] [Google Scholar]
- Henquin JC, Nenquin M (2014) Activators of PKA and Epac distinctly influence insulin secretion and cytosolic Ca2+ in female mouse islets stimulated by glucose and tolbutamide. Endocrinology 155:3274–3287. 10.1210/en.2014-1247 [DOI] [PMC free article] [PubMed] [Google Scholar]
- Hibino H, Pironkova R, Onwumere O, Vologodskaia M, Hudspeth AJ, Lesage F (2002) RIM binding proteins (RBPs) couple Rab3-interacting molecules (RIMs) to voltage-gated Ca2+ channels. Neuron 34:411–423. 10.1016/S0896-6273(02)00667-0 [DOI] [PMC free article] [PubMed] [Google Scholar]
- Hidaka H, Watanabe M, Kobayashi R (1991) Properties and use of H-series compounds as protein kinase inhibitors. Methods Enzymol 201:328–339. [DOI] [PubMed] [Google Scholar]
- Holz GG, Kang G, Harbeck M, Roe MW, Chepurny OG (2006) Cell physiology of cAMP sensor Epac. J Physiol 577:5–15. 10.1113/jphysiol.2006.119644 [DOI] [PMC free article] [PubMed] [Google Scholar]
- Hormuzdi SG, Pais I, LeBeau FE, Towers SK, Rozov A, Buhl EH, Whittington MA, Monyer H (2001) Impaired electrical signaling disrupts gamma frequency oscillations in connexin 36-deficient mice. Neuron 31:487–495. 10.1016/s0896-6273(01)00387-7 [DOI] [PubMed] [Google Scholar]
- Jensen RJ (1989) Mechanism and site of action of a dopamine D1 antagonist in the rabbit retina. Vis Neurosci 3:573–585. [PubMed] [Google Scholar]
- Kamiya H, Umeda K, Ozawa S, Manabe T (2002) Presynaptic Ca2+ entry is unchanged during hippocampal mossy fiber long-term potentiation. J Neurosci 22:10524–10528. [DOI] [PMC free article] [PubMed] [Google Scholar]
- Kaneko M, Takahashi T (2004) Presynaptic mechanism underlying cAMP-dependent synaptic potentiation. J Neurosci 24:5202–5208. 10.1523/JNEUROSCI.0999-04.2004 [DOI] [PMC free article] [PubMed] [Google Scholar]
- Kang G, Chepurny OG, Rindler MJ, Collis L, Chepurny Z, Li WH, Harbeck M, Roe MW, Holz GG (2005) A cAMP and Ca2+ coincidence detector in support of Ca2+-induced Ca2+ release in mouse pancreatic beta cells. J Physiol 566:173–188. 10.1113/jphysiol.2005.087510 [DOI] [PMC free article] [PubMed] [Google Scholar]
- Kashima Y, Miki T, Shibasaki T, Ozaki N, Miyazaki M, Yano H, Seino S (2001) Critical role of cAMP-GEFII-Rim2 complex in incretin-potentiated insulin secretion. J Biol Chem 276:46046–46053. 10.1074/jbc.M108378200 [DOI] [PubMed] [Google Scholar]
- Katsurabayashi S, Kubota H, Wang ZM, Rhee JS, Akaike N (2001) cAMP-dependent presynaptic regulation of spontaneous glycinergic IPSCs in mechanically dissociated rat spinal cord neurons. J Neurophysiol 85:332–340. 10.1152/jn.2001.85.1.332 [DOI] [PubMed] [Google Scholar]
- Kim MH, von Gersdorff H (2016) Postsynaptic plasticity triggered by Ca2+-permeable AMPA receptor activation in retinal amacrine cells. Neuron 89:507–520. 10.1016/j.neuron.2015.12.028 [DOI] [PMC free article] [PubMed] [Google Scholar]
- Komai AM, Brannmark C, Musovic S, Olofsson CS (2014) PKA-independent cAMP stimulation of white adipocyte exocytosis and adipokine secretion: modulations by Ca2+ and ATP. J Physiol 592:5169–5186. 10.1113/jphysiol.2014.280388 [DOI] [PMC free article] [PubMed] [Google Scholar]
- Kothmann WW, Massey SC, O'Brien J (2009) Dopamine-stimulated dephosphorylation of connexin 36 mediates AII amacrine cell uncoupling. J Neurosci 29:14903–14911. 10.1523/JNEUROSCI.3436-09.2009 [DOI] [PMC free article] [PubMed] [Google Scholar]
- Krinner S, Butola T, Jung S, Wichmann C, Moser T (2017) RIM-Binding Protein 2 promotes a large number of Cav1.3 Ca2+-channels and contributes to fast synaptic vesicle replenishment at hair cell active zones. Front Cell Neurosci 11:334. 10.3389/fncel.2017.00334 [DOI] [PMC free article] [PubMed] [Google Scholar]
- Krizaj D (2005) Serca isoform expression in the mammalian retina. Exp Eye Res 81:690–699. 10.1016/j.exer.2005.04.007 [DOI] [PMC free article] [PubMed] [Google Scholar]
- Kuhn SM, Nadler A (2020) Nanoscale signaling: messages across time and space. eLife 9:e63845. 10.7554/eLife.63845 [DOI] [PMC free article] [PubMed] [Google Scholar]
- Kushmerick C, von Gersdorff H (2003) Exo-endocytosis in at mossy fiber terminals: toward capacitance measurements in cells with arbitrary geometry. Proc Nat Acad Sci USA 100:8618–8620. [DOI] [PMC free article] [PubMed] [Google Scholar]
- Li GL, Vigh J, von Gersdorff H (2007) Short-term depression at the reciprocal synapses between a retinal bipolar cell terminal and amacrine cells. J Neurosci 27:7377–7385. 10.1523/JNEUROSCI.0410-07.2007 [DOI] [PMC free article] [PubMed] [Google Scholar]
- Liang Z, Freed MA (2012) Cross inhibition from ON to OFF pathway improves the efficiency of contrast encoding in the mammalian retina. J Neurophysiol 108:2679–2688. 10.1152/jn.00589.2012 [DOI] [PMC free article] [PubMed] [Google Scholar]
- Lonart G, Janz R, Johnson KM, Sudhof TC (1998) Mechanism of action of rab3A in mossy fiber LTP. Neuron 21:1141–1150. 10.1016/s0896-6273(00)80631-5 [DOI] [PubMed] [Google Scholar]
- Majewski L, Kuznicki J (2015) SOCE in neurons: signaling or just refilling? Biochim Biophys Acta 1853:1940–1952. [DOI] [PubMed] [Google Scholar]
- Marc RE, Anderson JR, Jones BW, Sigulinsky CL, Lauritzen JS (2014) The AII amacrine cell connectome: a dense network hub. Front Neural Circuits 8:104. 10.3389/fncir.2014.00104 [DOI] [PMC free article] [PubMed] [Google Scholar]
- Martín R, García-Font N, Suárez-Pinilla AS, Bartolomé-Martín D, Ferrero JJ, Luján R, Torres M, Sánchez-Prieto J (2020) β-Adrenergic receptors/EPAC signaling increases the size of the readily releasable pool of synaptic vesicles required for parallel fiber LTP. J Neurosci 40:8604–8617. 10.1523/JNEUROSCI.0716-20.2020 [DOI] [PMC free article] [PubMed] [Google Scholar]
- Mazade RE, Eggers ED (2020) Inhibitory components of retinal bipolar cell receptive fields are differentially modulated by dopamine D1 receptors. Vis Neurosci 37:E01. 10.1017/S0952523819000129 [DOI] [PMC free article] [PubMed] [Google Scholar]
- Mazade RE, Flood MD, Eggers ED (2019) Dopamine D1 receptor activation reduces local inner retinal inhibition to light-adapted levels. J Neurophysiol 121:1232–1243. 10.1152/jn.00448.2018 [DOI] [PMC free article] [PubMed] [Google Scholar]
- McLaughlin AJ, Percival KA, Gayet-Primo J, Puthussery T (2021) Glycinergic inhibition targets specific Off cone bipolar cells in primate retina. eNeuro 8:ENEURO.0432-20.2020. 10.1523/ENEURO.0432-20.2020 [DOI] [PMC free article] [PubMed] [Google Scholar]
- Midorikawa M, Sakaba T (2017) Kinetics of releasable synaptic vesicles and their plastic changes at hippocampal mossy fiber synapses. Neuron 96:1033–1040.e1033. 10.1016/j.neuron.2017.10.016 [DOI] [PubMed] [Google Scholar]
- Muntean BS, Zucca S, MacMullen CM, Dao MT, Johnston C, Iwamoto H, Blakely RD, Davis RL, Martemyanov KA (2018) Interrogating the spaciotemporal landscape of neuromodulatory GPCR signaling by real-time imaging of cAMP in intact neurons and circuits. Cell Rep 22:255–268. 10.1016/j.celrep.2017.12.022 [DOI] [PMC free article] [PubMed] [Google Scholar]
- Nanou E, Catterall WA (2018) Calcium channels, synaptic plasticity, and neuropsychiatric disease. Neuron 98:466–481. 10.1016/j.neuron.2018.03.017 [DOI] [PubMed] [Google Scholar]
- Neher E (1992) Correction for liquid junction potential in patch clamp experiments. Methods Enzymol 207:123–131. [DOI] [PubMed] [Google Scholar]
- Neher E, Almers W (1986) Patch pipettes used for loading small cells with fluorescent indicator dyes. Adv Exp Med Biol 211:1–5. 10.1007/978-1-4684-5314-0_1 [DOI] [PubMed] [Google Scholar]
- Oliva C, Cohen IS, Mathias RT (1988) Calculation of time constants for intracellular diffusion in whole cell patch clamp configuration. Biophys J 54:791–799. 10.1016/S0006-3495(88)83017-0 [DOI] [PMC free article] [PubMed] [Google Scholar]
- Ozaki N, Shibasaki T, Kashima Y, Miki T, Takahashi K, Ueno H, Sunaga Y, Yano H, Matsuura Y, Iwanaga T, Takai Y, Seino S (2000) cAMP-GEFII is a direct target of cAMP in regulated exocytosis. Nat Cell Biol 2:805–811. 10.1038/35041046 [DOI] [PubMed] [Google Scholar]
- Padamsey Z, Foster WJ, Emptage NJ (2019) Intracellular Ca2+ release and synaptic plasticity: a tale of many stores. Neuroscientist 25:208–226. 10.1177/1073858418785334 [DOI] [PubMed] [Google Scholar]
- Pereira L, Cheng H, Lao DH, Na L, van Oort RJ, Brown JH, Wehrens XH, Chen J, Bers DM (2013) Epac2 mediates cardiac β1-adrenergic-dependent sarcoplasmic reticulum Ca2+ leak and arrhythmia. Circulation 127:913–922. [DOI] [PMC free article] [PubMed] [Google Scholar]
- Rabl K, Cadetti L, Thoreson WB (2006) Paired-pulse depression at photoreceptor synapses. J Neurosci 26:2555–2563. 10.1523/JNEUROSCI.3667-05.2006 [DOI] [PMC free article] [PubMed] [Google Scholar]
- Rich TC, Fagan KA, Tse TE, Schaack J, Cooper DM, Karpen JW (2001) A uniform extracellular stimulus triggers distinct cAMP signals in different compartments of a simple cell. Proc Natl Acad Sci USA 98:13049–13054. 10.1073/pnas.221381398 [DOI] [PMC free article] [PubMed] [Google Scholar]
- Ritzau-Jost A, Delvendahl I, Rings A, Byczkowicz N, Harada H, Shigemoto R, Hirrlinger J, Eilers J, Hallermann S (2014) Ultrafast action potentials mediate kilohertz signaling at a central synapse. Neuron 84:152–163. 10.1016/j.neuron.2014.08.036 [DOI] [PubMed] [Google Scholar]
- Rorsman P, Braun M, Zhang Q (2012) Regulation of calcium in pancreatic α- and β-cells in health and disease. Cell Calcium 51:300–308. 10.1016/j.ceca.2011.11.006 [DOI] [PMC free article] [PubMed] [Google Scholar]
- Roy S, Field GD (2019) Dopaminergic modulation of retinal processing from starlight to sunlight. J Pharmacol Sci 140:86–93. 10.1016/j.jphs.2019.03.006 [DOI] [PubMed] [Google Scholar]
- Sakaba T, Neher E (2001) Preferential potentiation of fast-releasing synaptic vesicles by cAMP at the calyx of Held. Proc Natl Acad Sci USA 98:331–336. 10.1073/pnas.98.1.331 [DOI] [PMC free article] [PubMed] [Google Scholar]
- Schoch S, Castillo PE, Jo T, Mukherjee K, Geppert M, Wang Y, Schmitz F, Malenka RC, Sudhof TC (2002) RIM1alpha forms a protein scaffold for regulating neurotransmitter release at the active zone. Nature 415:321–326. 10.1038/415321a [DOI] [PubMed] [Google Scholar]
- Seino S, Shibasaki T (2005) PKA-dependent and PKA-independent pathways for cAMP-regulated exocytosis. Physiol Rev 85:1303–1342. 10.1152/physrev.00001.2005 [DOI] [PubMed] [Google Scholar]
- Sosa R, Hoffpauir B, Rankin ML, Bruch RC, Gleason EL (2002) Metabotropic glutamate receptor 5 and calcium signaling in retinal amacrine cells. J Neurochem 81:973–983. 10.1046/j.1471-4159.2002.00883.x [DOI] [PubMed] [Google Scholar]
- Stellwagen D, Shatz CJ, Feller MB (1999) Dynamics of retinal waves are controlled by cyclic AMP. Neuron 24:673–685. 10.1016/s0896-6273(00)81121-6 [DOI] [PubMed] [Google Scholar]
- Ster J, De Bock F, Guérineau NC, Janossy A, Barrère-Lemaire S, Bos JL, Bockaert J, Fagni L (2007) Exchange protein activated by cAMP (Epac) mediates cAMP activation of p38 MAPK and modulation of Ca2+-dependent K+ channels in cerebellar neurons. Proc Natl Acad Sci USA 104:2519–2524. 10.1073/pnas.0611031104 [DOI] [PMC free article] [PubMed] [Google Scholar]
- Stožer A, Paradiž Leitgeb E, Pohorec V, Dolenšek J, Križančić Bombek L, Gosak M, Skelin Klemen M (2021) The role of cAMP in beta cell stimulus-secretion and intercellular coupling. Cells 10:1658. 10.3390/cells10071658 [DOI] [PMC free article] [PubMed] [Google Scholar]
- Strettoi E, Raviola E, Dacheux RF (1992) Synaptic connections of the narrow-field, bistratified rod amacrine cell (AII) in the rabbit retina. J Comp Neurol 325:152–168. 10.1002/cne.903250203 [DOI] [PubMed] [Google Scholar]
- Strettoi E, Masri RA, Grunert U (2018) AII amacrine cells in the primate fovea contribute to photopic vision. Sci Rep 8:16429. 10.1038/s41598-018-34621-2 [DOI] [PMC free article] [PubMed] [Google Scholar]
- Trudeau LE, Emery DG, Haydon PG (1996) Direct modulation of the secretory machinery underlies PKA-dependent synaptic facilitation in hippocampal neurons. Neuron 17:789–797. 10.1016/s0896-6273(00)80210-x [DOI] [PubMed] [Google Scholar]
- Tzounopoulos T, Janz R, Sudhof TC, Nicoll RA, Malenka RC (1998) A role for cAMP in long-term depression at hippocampal mossy fiber synapses. Neuron 21:837–845. 10.1016/s0896-6273(00)80599-1 [DOI] [PubMed] [Google Scholar]
- Urschel S, Hoher T, Schubert T, Alev C, Sohl G, Worsdorfer P, Asahara T, Dermietzel R, Weiler R, Willecke K (2006) Protein kinase A-mediated phosphorylation of connexin36 in mouse retina results in decreased gap junctional communication between AII amacrine cells. J Biol Chem 281:33163–33171. 10.1074/jbc.M606396200 [DOI] [PubMed] [Google Scholar]
- Vaden JH, Banumurthy G, Gusarevich ES, Overstreet-Wadiche L, Wadiche JI (2019) The readily-releasable pool dynamically regulates multivesicular release. Elife 8:e47434. 10.7554/eLife.47434 [DOI] [PMC free article] [PubMed] [Google Scholar]
- Vaney DI, Gynther IC, Young HC (1991) Rod-signal interneurons in the rabbit retina: 2. AII amacrine cells. J Comp Neurol 310:154–169. 10.1002/cne.903100203 [DOI] [PubMed] [Google Scholar]
- Vardi N, Smith RG (1996) The AII amacrine network: coupling can increase correlated activity. Vision Res 36:3743–3757. 10.1016/0042-6989(96)00098-3 [DOI] [PubMed] [Google Scholar]
- Veruki ML, Oltedal L, Hartveit E (2010) Electrical coupling and passive membrane properties of AII amacrine cells. J Neurophysiol 103:1456–1466. 10.1152/jn.01105.2009 [DOI] [PubMed] [Google Scholar]
- Veruki ML, Wässle H (1996) Immunohistochemical localization of dopamine D1 receptors in rat retina. Eur J Neurosci 8:2286–2297. 10.1111/j.1460-9568.1996.tb01192.x [DOI] [PubMed] [Google Scholar]
- Vickers E, Kim MH, Vigh J, von Gersdorff H (2012) Paired-pulse plasticity in the strength and latency of light-evoked lateral inhibition to retinal bipolar cell terminals. J Neurosci 32:11688–11699. 10.1523/JNEUROSCI.0547-12.2012 [DOI] [PMC free article] [PubMed] [Google Scholar]
- Vigh J, Lasater EM (2003) Intracellular calcium release resulting from mGluR1 receptor activation modulates GABAA currents in wide-field retinal amacrine cells: a study with caffeine. Eur J Neurosci 17:2237–2248. 10.1046/j.1460-9568.2003.02652.x [DOI] [PubMed] [Google Scholar]
- Vigh J, Li GL, Hull C, von Gersdorff H (2005) Long-term plasticity mediated by mGluR1 at a retinal reciprocal synapse. Neuron 46:469–482. 10.1016/j.neuron.2005.03.027 [DOI] [PMC free article] [PubMed] [Google Scholar]
- Vincent P, Gervasi N, Zhang J (2008) Real-time monitoring of cyclic nucleotide signaling in neurons using genetically encoded FRET probes. Brain Cell Biol 36:3–17. 10.1007/s11068-008-9035-6 [DOI] [PubMed] [Google Scholar]
- Voigt T, Wässle H (1987) Dopaminergic innervation of AII amacrine cells in mammalian retina. J Neurosci 7:4115–4128. 10.1523/JNEUROSCI.07-12-04115.1987 [DOI] [PMC free article] [PubMed] [Google Scholar]
- von Gersdorff H, Matthews G (1996) Calcium-dependent inactivation of calcium current in synaptic terminals of retinal bipolar neurons. J Neurosci 16:115–122. [DOI] [PMC free article] [PubMed] [Google Scholar]
- Warrier A, Borges S, Dalcino D, Walters C, Wilson M (2005) Calcium from internal stores triggers GABA release from retinal amacrine cells. J Neurophysiol 94:4196–4208. 10.1152/jn.00604.2005 [DOI] [PubMed] [Google Scholar]
- Wässle H (2004) Parallel processing in the mammalian retina. Nat Rev Neurosci 5:747–757. 10.1038/nrn1497 [DOI] [PubMed] [Google Scholar]
- Wässle H, Heinze L, Ivanova E, Majumdar S, Weiss J, Harvey RJ, Haverkamp S (2009) Glycinergic transmission in the mammalian retina. Front Mol Neurosci 2:6. 10.3389/neuro.02.006.2009 [DOI] [PMC free article] [PubMed] [Google Scholar]
- Williams CL, Smith SM (2018) Calcium dependence of spontaneous neurotransmitter release. J Neurosci Res 96:335–347. 10.1002/jnr.24116 [DOI] [PMC free article] [PubMed] [Google Scholar]
- Witkovsky P, Svenningsson P, Yan L, Bateup H, Silver R (2007) Cellular localization and function of DARPP-32 in the rodent retina. Eur J Neurosci 25:3233–3242. 10.1111/j.1460-9568.2007.05571.x [DOI] [PMC free article] [PubMed] [Google Scholar]
- Yang Y, Calakos N (2011) Munc13-1 is required for presynaptic long-term potentiation. J Neurosci 31:12053–12057. 10.1523/JNEUROSCI.2276-11.2011 [DOI] [PMC free article] [PubMed] [Google Scholar]
- Yao L, Sakaba T (2010) cAMP modulates intracellular Ca2+ sensitivity of fast-releasing synaptic vesicles at the calyx of Held synapse. J Neurophysiol 104:3250–3260. 10.1152/jn.00685.2010 [DOI] [PubMed] [Google Scholar]
- Zandt BJ, Veruki ML, Hartveit E (2018) Electrotonic signal processing in AII amacrine cells: compartmental models and passive membrane properties for a gap junction-coupled retinal neuron. Brain Struct Funct 223:3383–3410. 10.1007/s00429-018-1696-z [DOI] [PubMed] [Google Scholar]
- Zhong N, Zucker RS (2005) cAMP acts on exchange protein activated by cAMP/cAMP-regulated guanine nucleotide exchange protein to regulate transmitter release at the crayfish neuromuscular junction. J Neurosci 25:208–214. 10.1523/JNEUROSCI.3703-04.2005 [DOI] [PMC free article] [PubMed] [Google Scholar]
- Zhong N, Beaumont V, Zucker RS (2004) Calcium influx through HCN channels does not contribute to cAMP-enhanced transmission. J Neurophysiol 92:644–647. 10.1152/jn.00112.2004 [DOI] [PubMed] [Google Scholar]