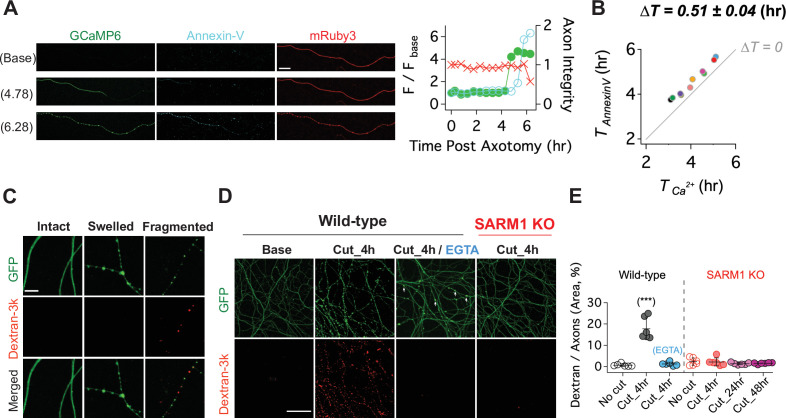
Figure 6. Calcium influx disrupts membrane integrity.
(A) (Left) Snapshots of representative live axon images for GCaMP6, mRuby3, and Alex647-conjugated Annexin-V at baseline, and 4.78 and 6.28 hr after axotomy. (Right) Representative single axon analysis. Y-axis (left) is plotted by the fold increase of fluorescent intensity (F / F base) of either GCaMP6 (green color dots) or Annexin-V (cyan color dots) from the baseline after axon injury. Axon integrity (y-axis, right) is calculated by the relative mRuby3 intensity from the baseline. Note that calcium influx precedes Annexin-V exposure in an injured axon. Scale bar = 50 µm (B) After axotomy, the time until calcium influx is plotted vs the time until the rise in Annexin-V. Dashed line (∆T = 0) represents the values if phosphatidylserine exposure (Annexin-V staining) and calcium influx occurred simultaneously. Calcium influx precedes phosphatidylserine exposure by an average of 0.51 ± 0.04 hr. n = 10 axons. (C) (Top) Representative images of intact, swollen, and fragmented axons during the process of axon degeneration. The axonal morphology is labeled with GFP that was transduced through GFP-lentivirus. Texas Red conjugated Dextran-3kDa was pre-incubated 30 min prior to image acquisition. Note that Dextran-3kDa is only observed in the fragmented axons, not in swollen axons. Scale bar = 10 µm (D) Representative images of GFP-expressing axotomized wild-type and SARM1 KO axons. The membrane impermeable Dextran-3k enters injured wild-type axons, but after injury is excluded from both EGTA-treated wild-type axons and SARM1 KO axons (GFP labels axons). Scale bar = 100 µm (E) Group data. Quantification of dextran-3k staining intensity in the indicated genotypes and times. Data represent the mean ± SEM; n = 6 embryos for each condition; one-way ANOVA with post hoc Tukey test, F(6,35) = 46.16, p < 0.0001; NS, not significant; *, p < 0.05; **, p < 0.01 and ***, p < 0.001.

