Abstract
In this study, Ti 6Al-4 V (grade 5) ELI alloy was machined with minimum energy and optimum surface quality and minimum tool wear. The appropriate cutting tool and suitable cutting parameters have been selected. As a result of the turning process, average surface roughness (Ra), tool wear and energy consumption were measured. The results have been analyzed by normality test, linear regression model, Taguchi analysis, ANOVA, Pareto graphics and multiple optimization method. It has been observed that high tool wear value increases Ra and energy consumption. In multiple optimization, it was concluded that it made predictions with 89,1% accuracy for Ra, 58,33% for tool wear, 96,75% for energy consumption. While the feed rate was the effective parameter for Ra and energy consumption, the effective parameter in tool wear was the cutting speed. Our study has revealed that by controlling energy consumption, surface quality can be maintained and tool wear can be controlled.
Keywords: Turning, Applied statistics, Multiple optimization, Surface roughness, Tool wear, Energy consumption
Introduction
Machining methods are preferred in many industrial and academic studies. Turning is an important metal removal operation. Tool wear significantly affects the surface quality of the machined products. Increasing tool wear affects energy consumption and reduces surface quality. Energy consumption is an important factor affecting the production cost. Therefore, energy consumption should be minimized.
With the development of materials science, many different materials are produced. The machinability of the produced materials has gained importance. Titanium alloys are frequently used in aviation, chemical industry, automotive and medical products [1]. Titanium Grade 5 materials are recognized as the most widely used titanium alloy. These materials are called Ti-6Al-4 V, according to EN norm as 37,164 or 37,165 and according to UNS norm as R56400. These materials contain approximately 90% titanium, 6% aluminum and 4% vanadium elements. Titanium Grade 5 has a low weight like other titanium alloys and have high mechanical strength, high corrosion resistance and biocompatibility [2]. Grade 5 Titanium material also has Eli, ie “Extra Low Interstitials (ELI)” version. The development of materials science has positively affected titanium materials. Ti-6Al-4 V (ELI) titanium alloy is widely used in academic and industrial applications due to its heat treatment ability.
When it comes to machining methods, we think of turning, milling, grinding, drilling etc. processes [3]. Machining methods are preferred in industrial production and academic studies. The surface quality of the product obtained as a result of machining, machining time, machining cost, tool wear, cutting forces, delamination, energy consumption, temperature changes during machining, sound intensity, vibration, acoustic emission, etc. are examined [4]. As a result of the correct evaluation of the examined values, the quality of the machining is increased or the effective parameters that cause low quality are determined. Good surface quality and low energy consumption are required in manufacturing. In addition, low tool wear is required to reduce costs. Since the machining of titanium alloys is difficult, many studies have been carried out on the machining of titanium alloys in the literature [5–7].
The most widely used method of machining is turning. Although there are many parameters that affect the turning process, the most important of these are cutting speed, feed rate and depth of cut. Change in cutting speed affects metal removal performance. High feed creates strong chips. It is known to facilitate chip breakage and chip control in some cases. According to the workpiece material, larger cutting depth affects chip breakage and creates larger forces [8–11].
An important measure of the quality of the product obtained as a result of machining is the surface roughness. There are many studies on surface roughness. When these studies are examined, it is seen that the effective parameter for surface roughness is feed rate [12].
Due to mechanical and chemical factors, wear is observed in the cutting tools used in machining. Tool wear means that the cutting tool loses its function as a result of detaching small parts from the cutting edge or building of small parts [13]. As a result of the loss of the cutting tool geometry, the desired surface quality cannot be achieved in the produced part. At the same time, the cutting power required for cutting increases in the deformed tool [14, 15]. Increasing cutting power means increasing energy consumption. By controlling energy consumption, protection of surface quality and control of tool wear can be achieved.
Considering the difficult conditions such as drought, population increase, epidemic diseases (such as COVID-19 pandemic) in our country and world, saving gains importance in every field. Efficient use of energy comes to mind when it comes to saving in machining. The main source of electrical energy consumption in machining is the machine tools used. For this reason, energy efficient and clean production methods are preferred in manufacturing to reduce production costs. It is also known that high energy consumption causes short tool life [16].
Optimization of processes is extremely important in machining applications. Thanks to optimization, available resources are used economically [17]. Various studies have been done to optimize processing responses under different processing conditions. When the studies are examined, it is seen that optimum results, when the optimum values of the parameters are used, improve the surface quality, reduce wear and minimize energy consumption [18]. Many different optimization techniques have been used in studies. Taguchi-based signal-to-noise (S/N) ratio method, regression equations, pareto graphs, ANOVA results, Response surface methodology (RSM), grey relational analysis, neural networks, genetic algorithms are among the most used techniques to obtain reliable results for optimization [19–21].
In present work, it is aimed to demonstrate experimentally and statistically the interaction between Ra, tool wear and energy consumption during turning of titanium alloy. The specific feature of this study is the investigation of how Ra and tool wear affect energy consumption in titanium machinability. Our study has revealed that by controlling energy consumption, surface quality can be maintained and tool wear can be controlled. In this context, the accuracy of the results was compared using different optimization methods.
Material Method
In Table 1, workpiece dimensions, cutting parameters, measured values, lathe model, measuring devices, used statistical programs are clearly given. Detailed information is given in the introduction about the workpiece used in this study. The parameter ranges were determined from the catalog values of the company that produced the cutting tool and from the studies in the literature. The first trial experiments were chosen slightly above these values and it was aimed to keep the processing time short.
Table 1.
Descriptive information about the experimental study
| No | Machining Conditions | Definitions |
|---|---|---|
| 1 | Workpiece | 6A1-4 V ELI (grade 5) titanium alloy |
| 2 | Workpiece hardness | 290 HB |
| 3 | Workpiece dimensions | Ø60x200 mm |
| 4 | Machining length | 85 mm |
| 5 | CNC Lathe | CNC Lathe LT-20C |
| 6 | A-Cutting speed (m/min) [V] | 55–80 - 105 |
| 7 | B-Feed rate (mm/rev) [f] | 0,15–0,30 - 0,45 |
| 8 | C-Depth of cut (mm) [a] | 1–2 - 3 |
| 9 | Cutting fluid | Cutting fluid is not used |
| 10 | Cutting insert | Sangeo DNMG 150608R-ST PS7220S |
| 11 | Tool holder | SMOXH TDJNR 2525 M15 |
| 12 | Experimental design method | Taguchi L9 (33) |
| 13 | Measured values |
Average surface roughness (Ra) Tool wear Energy consumption |
| 14 | Roughness measuring device | Mitutoyo SJ-210 V.1.008 |
| 15 | Tool wear measurement | Dino-Lite AM2111 Digital Basic USB Microscope |
| 16 | Energy consumption measuring device | Hioki Power Quality Analyzer PW3198 |
| 17 | Hardness tester | Proceq equotip 3 portable hardness tester |
| 18 | Used programs | Minitab, Word, Excell, AutoCAD |
| 19 | Evaluation of the results | Taguchi, regression analysis, pareto plot, ANOVA, multiple optimization |
Ra values were measured after machining was finished. The Mitutuyo SJ-210 surface roughness measuring device with a needle that can measure consecutive profile changes was used in the roughness measurement process. Measurements were made according to the ISO 4287 standard [22]. The device is set to 2,5 mm measuring step, 4 measuring numbers. The unit of Ra values is measured in “μm”. Measurements were carried out parallel to the workpiece rotation axis on three different surfaces at an angle of 120 degrees and averaged.
In tool wear, different insert was used for each process, and it was measured after the experiments were finished. The inserts were cleaned with a polisher before tool wear was measured. With the cleaning process, micron-level contaminants on the cutting edge were removed from the surface. After cleaning, images of cutting tools were obtained with Dino-Lite AM2111 Digital Basic USB Microscope. Since the measuring feature of the existing microscope is not open, the images were processed with the AutoCAD program and tool wears were determined. Tool wear is measured in “mm”.
Hioki Power Quality Analyzer PW3198 device is connected to the fuse panel of the lathe to determine the amount of electricity consumed by the machine. Energy consumption is measured simultaneously during the machining operation. Energy consumption is measured in “kWh”. The energy consumption amount consumed during the machining period is determined.
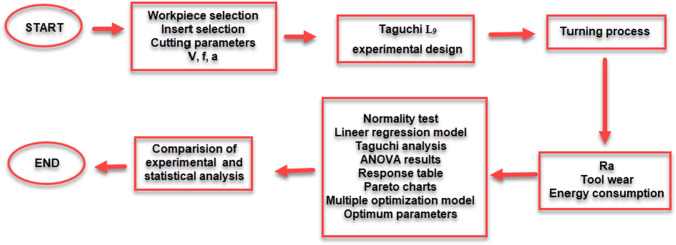
A flow chart has been created to better understand the work done. The flow chart created is given in Fig. 1.
Fig. 1.
Flow chart
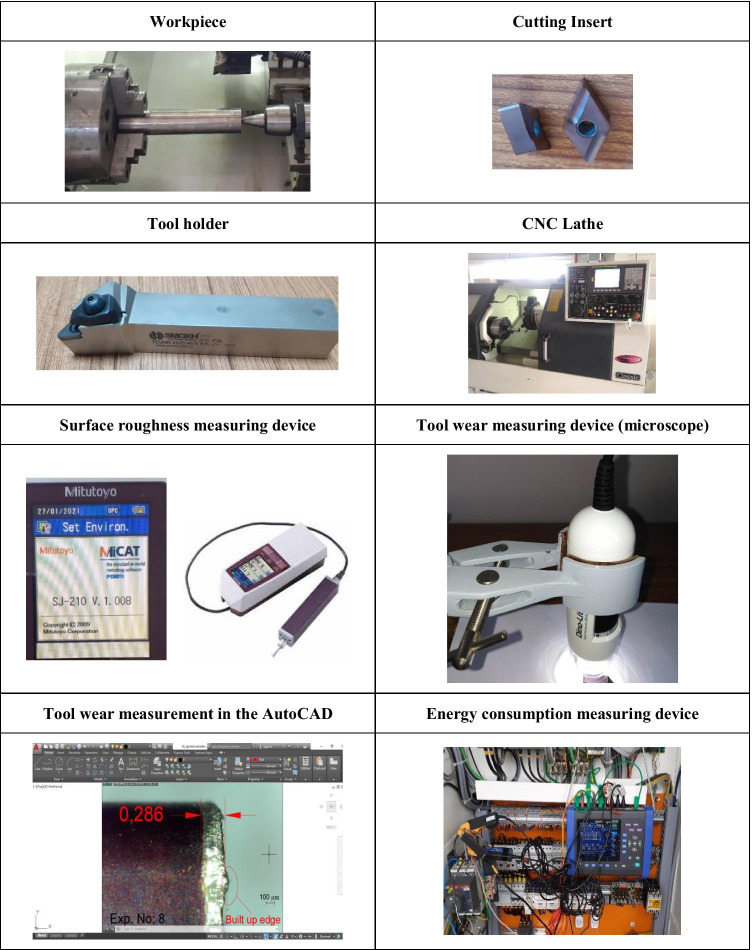
Figure 2 shows the workpiece, cutting tool, tool holder, CNC lathe, surface roughness measuring device, microscope, AutoCAD image on the computer, energy consumption device placed on the fuse panel used in the experiments. Turning operations were carried out under dry cutting conditions. Because the use of cutting fluids has an important place in production costs. It also threatens the environment and human health. For this reason, the use of cutting fluids is undesirable in order to reduce production costs, protect worker health and the environment [23, 24]. In this study, it was tried to determine the optimum cutting conditions without using cutting fluid.
Fig. 2.
Experiment equipment
Experiment Results
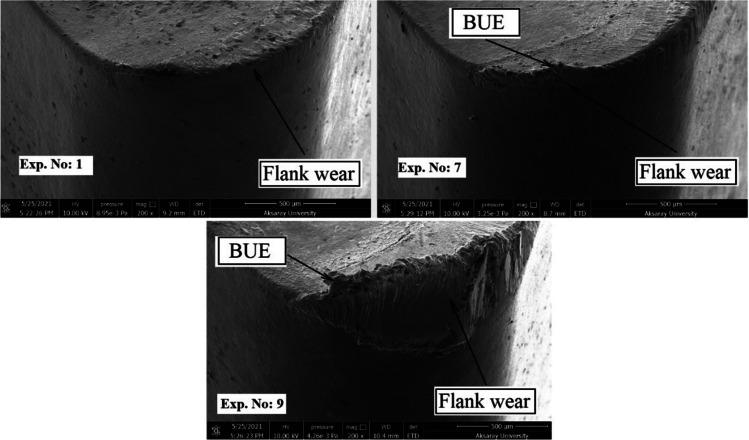
In some machining operations, SEM analyzes were performed in order to investigate how the tool tips wear. Figure 3 shows the SEM images of the experiments where the smallest, medium and maximum tool wear occurred. In Fig. 3, it was seen that there was the smallest flank wear and no BUE in experiment number 1. However, in 7th experiment, BUE and flank wear were large. Also, in the 9th experiment, flank wear and bue were the biggest. In the 7th and 9th experiments, tool wear occurred more because the cutting speed was high. Titanium 6A1-4 V ELI material has a ductile structure due to its high aluminum content. BUE increased at high cutting speeds.
Fig. 3.
SEM images of experiments 1, 7 and 9
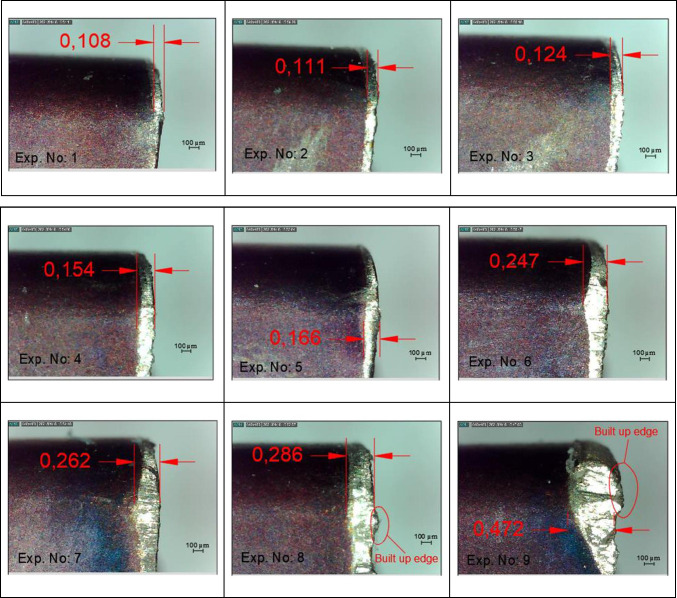
Measurements regarding tool wear are given in Fig. 4. When the tool wear microscope images are examined, it is seen that also flank wear and BUE were occurred in the cutting tools. The smallest flank wear appeared in the 1st experiment, and the largest in the 9th experiment. In addition, it was observed that BUE was higher in the 8th and 9th experiments, where the cutting speed was high.
Fig. 4.
Tool wear images and measured values
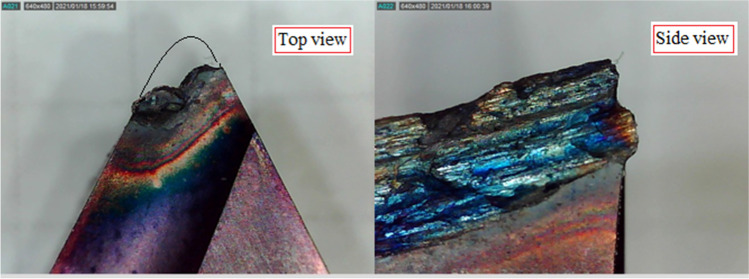
Choosing the optimum cutting parameters is difficult when machining titanium materials. In order to keep the machining time short, cutting parameters were initially set at high values. Figure 5 shows the tool wear image of the cutting tool during the turning process with 200 m/min, the feed rate 0,4 mm/rev and the depth of cut 3 mm. Due to excessive tool wear and low surface quality, cutting parameters have been updated as in Table 2. As a result of this update, excessive tool wear has been eliminated.
Fig. 5.
Excessive tool wear occurring at high values of cutting parameters (V:200 m/min, f:0,4 mm/rev, a:3 mm)
Table 2.
Experiment list and values obtained as a result of the experiment
| Experiment No |
V (m/min) |
f (mm) |
a (mm/rev) |
Ra (μm) |
Tool wear (mm) |
Energy consumption (kWh) |
|---|---|---|---|---|---|---|
| 1 | 55 | 0,15 | 1 | 1871 | 0,108 | 9752 |
| 2 | 55 | 0,30 | 2 | 4708 | 0,111 | 14,852 |
| 3 | 55 | 0,45 | 3 | 7251 | 0,124 | 17,628 |
| 4 | 80 | 0,15 | 2 | 2315 | 0,154 | 10,035 |
| 5 | 80 | 0,30 | 3 | 4414 | 0,166 | 14,661 |
| 6 | 80 | 0,45 | 1 | 6878 | 0,247 | 17,021 |
| 7 | 105 | 0,15 | 3 | 2912 | 0,262 | 12,254 |
| 8 | 105 | 0,30 | 1 | 4184 | 0,286 | 12,365 |
| 9 | 105 | 0,45 | 2 | 8305 | 0,472 | 19,025 |
In Table 2, the list of experiments created with Taguchi L9 design and Ra, tool wear and energy consumption values are given.
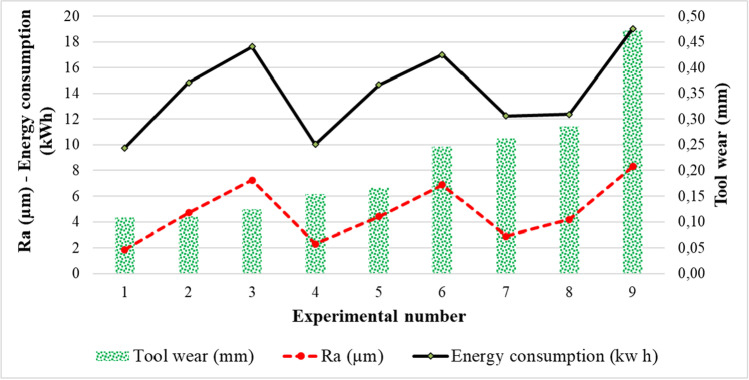
The Ra, tool wear and energy consumption obtained as a result of the experiment are shown graphically in Fig. 6. When Fig. 6 is examined, it is clearly seen that Ra, tool wear and energy consumption are linearly proportional to each other. In other words, the reason for the increase of Ra is tool wear. We can say that as Ra increases, energy consumption increases, energy consumption increases as wear increases.
Fig. 6.
Combined graph of Ra, tool wear and energy consumption results
Statistical Analysis
Statistical analysis constitutes the most important stage of research in many scientific studies. There is a very common mistake in research: Researchers miscalculate their results or cannot reach any conclusions due to the wrong analysis method. It is very important to know which analysis methods are used under which conditions in order to analyze the data properly. Improper method selection will result in incorrect interpretation of the data. It is important to know what you want to do in choosing the right analysis method, as well as your choice of method according to your data type.
Minitab 19 program was used in statistical tests. In this part of our study, the results of Ra, wear and energy consumption were examined by normality test, linear regression model, Taguchi analysis, ANOVA, pareto graphs and multiple optimization method.
Test of Normality
Most of the statistical methods are based on normality assumption. For this reason, it is necessary to test whether the distribution of the data sets is normal before starting the analysis. Minitab offers Anderson-Darling, Ryan-Joiner (similar to Shapiro-Wilk) and Kolmogorov-Smirnov options for normality testing. We carried out our tests according to Anderson-Darling option among these presented normality tests. The normality test results obtained for Ra, tool wear and energy consumption are given in Fig. 7. We can see the mean, StDev (standard deviation), N (sample number), AD (Anderson-Darling) and p values on the figures.The result of the normality test should be p > 0.05 [21]. p values were obtained as 0,535 for Ra, 0,119 for tool wear and 0,686 for energy consumption. It was concluded that the values we obtained as a result of the test have a normal distribution.
Fig. 7.
Normality test results for Ra, wear and energy consumption
Linear Regression Models
Regression models were created for the operations to be performed in the same cutting parameters and threshold ranges in the experimental results obtained. Linear, quadratic and logarithmic regression models have been tested. Linear regression equations and determination coefficients are given in Table 3 in accordance with the study. The closer the R2 values to 1, the more reliable the resulting model.
Table 3.
Regression equations for Ra, tool wear and energy consumption
| Equation | R2 (%) | |
|---|---|---|
| Ra | -1738 + 0,01047*V + 17,04*f + 0,274*a | 96,64 |
| Tool wear | −0,223 + 0,004514*V + 0,354*f-0,0149*a | 85,26 |
| Energy consumption | 4,41 + 0,0094*V + 24,04*f + 0,901*a | 94,64 |
Comparison of the real experimental results with Ra, tool wear and energy consumption values by using linear regression model is given in Fig. 8. It can be seen in Fig. 8 that there is a good correlation between real experimental results and predicted values.
Fig. 8.
Comparison of experimental results and predicted values
Taguchi Analysis
In Taguchi analysis about Ra, tool wear and energy consumption, “smaller is better” option was selected in Minitab program. The S/N ratios obtained as a result of the analysis were given in Table 4. When Table 4 was examined, the S/N ratio for Ra was −5,44, the S/N ratio for tool wear was 19,34, S/N ratio for energy consumption was found to be −19,78.
Table 4.
S/N values obtained for Ra, tool wear and energy consumption
| Experiment no | Ra | Tool wear | Energy consumption |
|---|---|---|---|
| 1 | −5,44 | 19,34 | −19,78 |
| 2 | −13,46 | 19,09 | −23,44 |
| 3 | −17,21 | 18,13 | −24,92 |
| 4 | −7,29 | 16,25 | −20,03 |
| 5 | −12,90 | 15,62 | −23,32 |
| 6 | −16,75 | 12,16 | −24,62 |
| 7 | −9,28 | 11,64 | −21,77 |
| 8 | −12,43 | 10,87 | −21,84 |
| 9 | −18,39 | 6,52 | −25,59 |
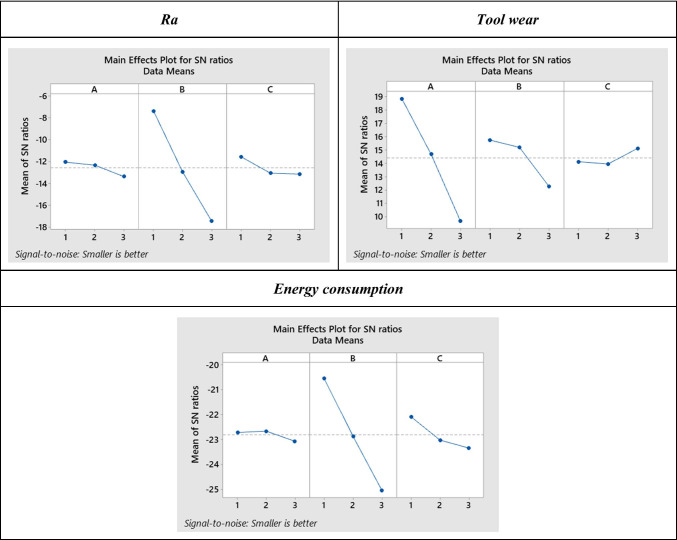
The response graphs of the S/N ratio obtained for Ra, tool wear and energy consumption are given in Fig. 9. When Fig. 9 is examined, the cutting parameters at which the optimum Ra values were obtained were determined as 55 m/min, which is the first level of the cutting speed, 0,15 mm/rev, which is the first level of the feed rate, and 1 mm, which is the first level of depth of cut.
Fig. 9.
Response graphs of S/N ratio for smaller-better analysis
When Fig. 9 is examined, the cutting parameters for which optimum tool wear values were obtained were determined as 55 m/min at the first level of the cutting speed, the first level of the feed rate was 0,15 mm/rev and the third level of the depth of cut was 3 mm.
When Fig. 9 is examined, the cutting parameters for which optimum energy consumption values are obtained were determined as the second level of the cutting speed as 80 m/min, the first level of the feed rate as 0,15 mm/rev and the first level of the depth of cut as 1 mm. Also, according to Fig. 9, Ra, tool wear and energy consumption increased as the cutting speed and feed rate increased. As the depth of cut increased, Ra and energy consumption increased, but tool wear decreased slightly.
The response table of the S/N ratio obtained for Ra, tool wear and energy consumption is given in Table 5. The most effective parameters and levels of Ra, tool wear and energy consumption are plotted in the table. The delta value indicates the first parameter that is high. It is seen that the feed rate for Ra and energy consumption and the cutting speed for tool wear are the effective parameters. The highest value is taken into account to determine the factor levels.
Table 5.
Response table for S/N ratios
| Ra | Tool wear | Energy consumption | |||||||
|---|---|---|---|---|---|---|---|---|---|
| Level | V | f | a | V | f | a | V | f | a |
| 1 | −12,04 | −7,34 | −11,54 | 18,86 | 15,74 | 14,12 | −22,71 | −20,53 | −22,08 |
| 2 | −12,31 | −12,93 | −13,05 | 14,68 | 15,20 | 13,96 | −22,66 | −22,87 | −23,02 |
| 3 | −13,37 | −17,45 | −13,13 | 9,68 | 12,27 | 15,13 | −23,07 | −25,04 | −23,34 |
| Delta | 1,33 | 10,11 | 1,59 | 9,18 | 3,47 | 1,18 | 0,41 | 4,52 | 1,26 |
| Rank | 3 | 1 | 2 | 1 | 2 | 3 | 3 | 1 | 2 |
ANOVA Results
ANOVA results obtained for Ra, tool wear and energy consumption are given in Table 6. Percentage values in the tables show the effect values of the cutting parameters in this model. The fact that P values are less than 0,05 indicates whether the values are meaningful for this model. Since P < 0,05, the regression models created are also significant [20]. When Table 6 is examined, it is seen that the feed rate for Ra is 94,57%, cutting speed for tool wear is 68,82% and feed rate for energy consumption is 88,73% efficient and significant.
Table 6.
ANOVA results
| Source | DF | Seq SS | Contribution | Adj SS | Adj MS | F-Value | P Value |
|---|---|---|---|---|---|---|---|
| Ra | |||||||
| Regression | 3 | 40,061 | 96,64% | 40,061 | 13,354 | 48,00 | 0,0004 |
| V | 1 | 0,411 | 0,99% | 0,411 | 0,411 | 1,48 | 0,2783 |
| f | 1 | 39,199 | 94,57% | 39,199 | 39,199 | 140,90 | 0,0001 |
| a | 1 | 0,451 | 1,09% | 0,451 | 0,451 | 1,62 | 0,2592 |
| Error | 5 | 1391 | 3,36% | 1391 | 0,278 | ||
| Total | 8 | 41,452 | 100,00% | ||||
| Tool wear | |||||||
| Regression | 3 | 0,095 | 85,26% | 0,095 | 0,032 | 9,64 | 0,0161 |
| V | 1 | 0,076 | 68,82% | 0,076 | 0,076 | 23,34 | 0,0048 |
| f | 1 | 0,017 | 15,25% | 0,017 | 0,017 | 5,17 | 0,0721 |
| a | 1 | 0,001 | 1,19% | 0,001 | 0,001 | 0,40 | 0,5529 |
| Error | 5 | 0,016 | 14,74% | 0,016 | 0,003 | ||
| Total | 8 | 0,111 | 100,00% | ||||
| Energy consumption | |||||||
| Regression | 3 | 83,199 | 94,64% | 83,199 | 27,733 | 29,44 | 0,0013 |
| V | 1 | 0,332 | 0,38% | 0,332 | 0,332 | 0,35 | 0,5784 |
| f | 1 | 77,998 | 88,73% | 77,998 | 77,998 | 82,81 | 0,0003 |
| a | 1 | 4869 | 5,54% | 4869 | 4869 | 5,17 | 0,0721 |
| Error | 5 | 4710 | 5,36% | 4710 | 0,942 | ||
| Total | 8 | 87,909 | 100,00% | ||||
Pareto Analysis
Pareto analysis is used for reasons such as determining the most important reason on the problem, listing all problems, seeing the rates and degrees of importance of the problems, and directing a team work [25].
In this study, Pareto analysis was used to determine the important cause on Ra, tool wear and energy consumption. Pareto charts for Ra, tool wear and energy consumption are given in Fig. 10. When Fig. 10 is examined, it is seen that the feed rate is important for Ra and energy consumption, and the cutting speed is important for tool wear.
Fig. 10.
Pareto charts for Ra, tool wear and energy consumption
Multiple Optimization Model
In studies measuring more than one result, the optimization of the parameters should not be performed separately. The optimum parameters for Ra, tool wear and energy consumption, which we examined above, determined by Taguchi, were determined as different levels. Multiple optimization is done for a common result when more than one result is measured.
Since Ra, tool wear and energy consumption values are desired to be low, the goal has been selected as minimum while performing multiple optimization [17, 26]. Table 7 shows the selected objective functions for multiple optimization and their results. At the same time, the table shows low values, high values, target values, weight and importance values for the test results.
Table 7.
Objective function selections and results for multiple optimization
| Response | Goal | Lower | Target | Upper | Weight | Importance |
|---|---|---|---|---|---|---|
| Ra | Minimize | 1871 | 1871 | 8305 | 1 | 1 |
| Tool wear | Minimize | 0,108 | 0,108 | 0,472 | 1 | 1 |
| Energy consumption | Minimize | 9752 | 9752 | 19,025 | 1 | 1 |
As a result of multiple optimization, suitable cutting parameters were obtained as 55 m/min, 0,15 mm/rev, 1 mm. Since the obtained parameters were included in the experiment list, the existing results were used. The experiment has not been repeated. Test and prediction results were given in Table 8. Predictions were made with an accuracy of 89,1% for Ra, 58,33% for tool wear and 96,75% for energy consumption. The reason for the high error rate of tool wear prediction as a result of multiple optimization is that while feed rate is the effective parameter for Ra and energy consumption, the effective parameter in tool wear is the cutting speed.
Table 8.
Multiple optimization and experiment results
| Experimental result | Predict result | Absolute difference | Error (%) | |
|---|---|---|---|---|
| Ra | 1871 | 1667 | 0,204 | 10,90 |
| Tool wear | 0,108 | 0,063 | 0,045 | 41,67 |
| Energy consumption | 9752 | 9435 | 0,317 | 3,25 |
Debhnath et al. and Akkus stated in their study that optimum cutting conditions for the desired surface roughness and tool wear were obtained with high cutting speed, medium cutting depth level and low feed rate [27, 28]. The results of our study are also in this direction.
Results, Discussion and Suggestions
In this study, titanium alloy 6A1-4 V ELI (grade 5) cylindrical workpiece was machined on CNC lathe. Ra, tool wear and energy consumption values obtained in turning process were analyzed experimentally and statistically. The results obtained below are given in order.
Cost and time savings have been achieved with the Taguchi L9 experiment design.
Ra, tool wear and energy consumption values generated during turning of the titanium alloy have been determined.
The microscope images of the tool wear have been measured with the help of AutoCAD program.
When the wears on the cutting tools are examined, the wears appear as flank wear and BUE. BUE and flank wear amount increases at high cutting speeds.
It is concluded that Ra, tool wear and energy consumption are linearly proportional to each other. In other words, the reason for Ra increase is tool wear. As Ra increases, energy consumption increases. Energy consumption increases as tool wear increases.
As a result of Anderson-Darling normality test, p values have been determined as 0,535 for Ra, 0,119 for tool wear and 0,686 for energy consumption. It is concluded that the values of Ra, tool wear and energy consumption have normal distribution.
Linear regression equations have been created. The coefficients of determination (R2) have been determined as 96,64% for Ra, 85,26% for tool wear and 94,64% for energy consumption.
S/N ratios have been found as −5,44 for Ra, 19,34 for tool wear and − 19,78 for energy consumption.
The optimum cutting parameters for the minimum Ra have been determined as 55 m/min - 0,15 mm/ rev −1 mm.
Optimum cutting parameters for minimum tool wear have been determined as 55 m/min - 0,15 mm/rev - 3 mm.
Optimum cutting parameters for minimum energy consumption have been determined as 80 m/min - 0,15 mm/rev - 1 mm.
Created regression models, Taguchi and Pareto plots have shows that feed rate for Ra and energy consumption and cutting speed for tool wear are the active parameters.
It is pleasing that the prediction results correspond to the experimental data.
As a result of multiple optimization, it has been concluded that it has made predictions with 89,1% accuracy for Ra, 58,33% for tool wear, 96,75% for energy consumption.
It was concluded that the reason for the high error rate of the tool wear prediction as a result of multiple optimization is that the feed rate is the effective parameter for Ra and energy consumption, and that the factor in tool wear is the cutting speed.
Since the information obtained about Ra, tool wear and energy consumption is positive, it can be used in future scientific and industrial applications.
Our study has been an important research examining the relationship between Ra, tool wear and energy consumption experimentally and statistically.
This study has revealed that by controlling energy consumption, surface quality can be maintained and tool wear can be controlled.
It is recommended to use parameter changes, different statistical and numerical methods in future studies.
Acknowledgements
This study was supported by Amasya University Scientific Research Projects Coordination Unit with the project of FMB-BAP 19-0412.
Footnotes
Publisher’s Note
Springer Nature remains neutral with regard to jurisdictional claims in published maps and institutional affiliations.
References
- 1.Kumar A, Sehrawat G. Investigation of surface roughness and tool wear during turning of titanium alloy grade 5 (Ti-6Al-4V) by using coated carbide tool and optimization of process parameters. IOP Conference Series: Mater Sci Eng. 2021;1033(1):012067. doi: 10.1088/1757-899X/1033/1/012067. [DOI] [Google Scholar]
- 2.Agrawal C, Wadhwa J, Pitroda A, Pruncu CI, Sarikaya M, Khanna N. Comprehensive analysis of tool wear, tool life, surface roughness, costing and carbon emissions in turning Ti–6Al–4V titanium alloy: cryogenic versus wet machining. Tribol Int. 2021;153:106597. doi: 10.1016/j.triboint.2020.106597. [DOI] [Google Scholar]
- 3.Lee SK, Ko SL. Development of simulation system for machining process using enhanced Z map model. J Mater Process Technol. 2002;130:608–617. doi: 10.1016/S0924-0136(02)00761-6. [DOI] [Google Scholar]
- 4.Kuntoğlu M, Aslan A, Pimenov DY, Usca ÜA, Salur E, Gupta MK, Sharma S. A review of indirect tool condition monitoring systems and decision-making methods in turning: critical analysis and trends. Sensors. 2021;21(1):108. doi: 10.3390/s21010108. [DOI] [PMC free article] [PubMed] [Google Scholar]
- 5.Ramesh S, Karunamoorthy L, Palanikumar K. Surface roughness analysis in machining of titanium alloy. Mater Manufact Processes. 2008;23(2):174–181. doi: 10.1080/10426910701774700. [DOI] [Google Scholar]
- 6.Ramesh S, Karunamoorthy L, Senthilkumar VS, Palanikumar K. Experimental study on machining of titanium alloy (Ti64) by CVD and PVD coated carbide inserts. Int J Manufact Technol Manag. 2009;17(4):373–385. doi: 10.1504/IJMTM.2009.023954. [DOI] [Google Scholar]
- 7.Ramesh S, Karunamoorthy L (2013) Turning investigations on machining of Ti64 alloy with different cutting tool inserts. In Materials Science Forum (Vol. 763, pp. 1–27). Trans Tech Publications Ltd
- 8.Yang WHP, Tarng YS. Design optimization of cutting parameters for turning operations based on the Taguchi method. J Mater Process Technol. 1998;84(1–3):122–129. doi: 10.1016/S0924-0136(98)00079-X. [DOI] [Google Scholar]
- 9.Li X. A brief review: acoustic emission method for tool wear monitoring during turning. Int J Machine Tools Manufact. 2002;42(2):157–165. doi: 10.1016/S0890-6955(01)00108-0. [DOI] [Google Scholar]
- 10.Siddhpura M, Paurobally R. A review of chatter vibration research in turning. Int J Machine Tools Manufact. 2012;61:27–47. doi: 10.1016/j.ijmachtools.2012.05.007. [DOI] [Google Scholar]
- 11.Dhal AK, Panda A, Kumar R, Sahoo AK (2021) Different machining environments impact analysis for Ti-6Al-4V alloy (Grade 5) turning process: A scoping review. Materials Today: Proceedings
- 12.Kumar SL. Measurement and uncertainty analysis of surface roughness and material removal rate in micro turning operation and process parameters optimization. Measurement. 2019;140:538–547. doi: 10.1016/j.measurement.2019.04.029. [DOI] [Google Scholar]
- 13.Kopač J. Influence of cutting material and coating on tool quality and tool life. J Mater Process Technol. 1998;78(1–3):95–103. doi: 10.1016/S0924-0136(97)00469-X. [DOI] [Google Scholar]
- 14.Shoba C, Prasad DS, Sucharita A, Abishek M, Koundinya MS. Investigations of surface roughness, power consumption, MRR and tool wear while turning hybrid composites. Mater Today: Proc. 2018;5(8):16565–16574. [Google Scholar]
- 15.Akkuş H, Duzcukoglu H, Seri̇n, F. Experimental investigation of Wear behavior of borax-added mineral oil at various temperatures. Surface Rev Lett (SRL) 2021;28(04):1–12. [Google Scholar]
- 16.Younas M, Jaffery SHI, Khan A, Khan M. Development and analysis of tool wear and energy consumption maps for turning of titanium alloy (Ti6Al4V) J Manufact Processes. 2021;62:613–622. doi: 10.1016/j.jmapro.2020.12.060. [DOI] [Google Scholar]
- 17.Parida AK, Maity K. Modeling of machining parameters affecting flank wear and surface roughness in hot turning of Monel-400 using response surface methodology (RSM) Measurement. 2019;137:375–381. doi: 10.1016/j.measurement.2019.01.070. [DOI] [Google Scholar]
- 18.Mia M, Dey PR, Hossain MS, Arafat MT, Asaduzzaman M, Ullah MS, Zobaer ST. Taguchi S/N based optimization of machining parameters for surface roughness, tool wear and material removal rate in hard turning under MQL cutting condition. Measurement. 2018;122:380–391. doi: 10.1016/j.measurement.2018.02.016. [DOI] [Google Scholar]
- 19.Ramesh S, Karunamoorthy L, Palanikumar K. Measurement and analysis of surface roughness in turning of aerospace titanium alloy (gr5) Measurement. 2012;45(5):1266–1276. doi: 10.1016/j.measurement.2012.01.010. [DOI] [Google Scholar]
- 20.Vinayagamoorthy R, Xavior MA. Parametric optimization on multi-objective precision turning using grey relational analysis. Procedia Eng. 2014;97:299–307. doi: 10.1016/j.proeng.2014.12.253. [DOI] [Google Scholar]
- 21.Akkuş H, Yaka H. Experimental and statistical investigation of the effect of cutting parameters on surface roughness, vibration and energy consumption in machining of titanium 6Al-4V ELI (grade 5) alloy. Measurement. 2021;167:108465. doi: 10.1016/j.measurement.2020.108465. [DOI] [Google Scholar]
- 22.Clausen R, Stangenberg J (1999) Roughness of shot-peened surfaces-definition and measurement. In Proceedings of the 7th international conference on shot peening, 69–77
- 23.Klocke F, Eisenblatter G. Dry cutting. CIRP Annals Manufact Technol. 1997;46(2):519–526. doi: 10.1016/S0007-8506(07)60877-4. [DOI] [Google Scholar]
- 24.Ozlu B. Investigation of the effect of cutting parameters on cutting force, surface roughness andchip shape in turning of Sleipner cold work tool steel. Journal of the Faculty of Engineering and Architecture of Gazi University. 2021;36(3):1241–1252. [Google Scholar]
- 25.Ab Talib MS, Hamid ABA, Thoo AC. Critical success factors of supply chain management: a literature survey and Pareto analysis. Euro Med Journal of Business. 2015;10(2):234–263. doi: 10.1108/EMJB-09-2014-0028. [DOI] [Google Scholar]
- 26.Camposeco-Negrete C. Optimization of cutting parameters for minimizing energy consumption in turning of AISI 6061 T6 using Taguchi methodology and ANOVA. Journal of Cleaner Production. 2013;53:195–203. doi: 10.1016/j.jclepro.2013.03.049. [DOI] [Google Scholar]
- 27.Debnath S, Reddy MM, Yi QS. Influence of cutting fluid conditions and cutting parameters on surface roughness and tool wear in turning process using Taguchi method. Measurement. 2016;78:111–119. doi: 10.1016/j.measurement.2015.09.011. [DOI] [Google Scholar]
- 28.Akkuş H (2021) Multiple optimizatıon analysis of MRR, surface roughness, sound intensity, energy consumption, and vibration values in machinability of TC4 tıitanium alloy. Surface Rev Lett, 2150072


