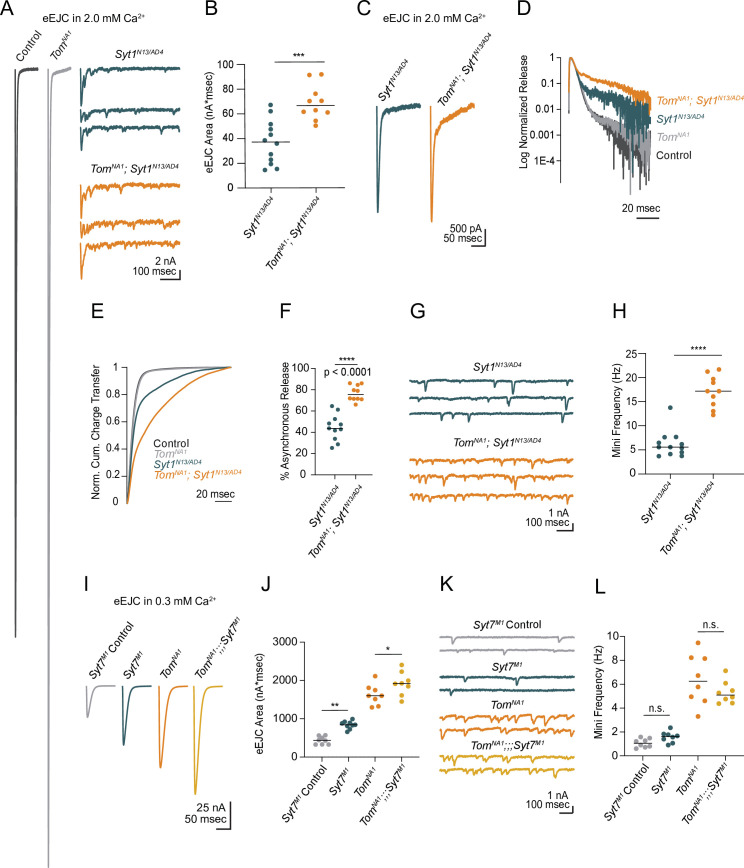
Figure 4. Tomosyn inhibits release independent of Synaptotagmin 1 and 7.
(A) Average evoked response in 2.0 mM Ca2+ for control and tomosynNA1 (left) compared to representative traces of syt1 nulls (Syt1N13/AD4) and tomosyn/syt1 double mutants (TomNA1;Syt1N13/AD4, right). (B) Quantification of average evoked response area (nA*msec) per NMJ in 2.0 mM Ca2+ (syt1N13/AD4: 37.22, 37.13 ± 5.139, n = 12; tomosynNA1/syt1N13/AD4: 66.59, 69.05 ± 4.471, n = 10; p = 0.0002; ≥ 5 larvae per group). (C) Average EJC response in 2.0 mM Ca2+. (D) Log normalized average evoked response in 2.0 mM Ca2+. (E) Normalized cumulative charge transfer for the average evoked response in 2.0 mM Ca2+. (F) The slow component of evoked release was identified by fitting a double logarithmic function to the average normalized cumulative charge transfer per NMJ in 2.0 mM Ca2+ and plotted as a percent of total charge transfer (syt1N13/AD4: 43.69, 44.55 ± 3.717, n = 11; tomosynNA1/syt1N13/AD4: 75.38, 76.72 ± 2.295, n = 10; p < 0.0001; ≥ 5 larvae per group). (G) Representative mEJC traces. (H) Quantification of mEJC rate (Hz) per NMJ (syt1N13/AD4: 5.567, 6.192 ± 0.7904, n = 12; tomosynNA1, syt1N13/AD4: 17.17, 17.17 ± 1.034, n = 10; p < 0.0001; ≥ 5 larvae per group). (I) Average evoked response in 0.3 mM Ca2+ of control (Syt7M1 control), syt7 null (Syt7M1), tomosyn null (tomosynNA1), and tomosyn/syt7 double null (tomosynNA1;;;Syt7M1). (J) Quantification of average evoked response area (nA*msec) per NMJ in 0.3 mM Ca2+ (control: 437.4, 437.4 ± 36.11, n = 8; syt7M1: 844.6, 840.4 ± 33.77, n = 9; tomosynNA1: 1602, 1627 ± 94.19, n = 8; tomosynNA1, syt7M1: 1920, 1923 ± 108.4, n = 8; p < 0.0001; ≥ 5 larvae per group). (K) Representative mEJC traces. (L) Quantification of mEJC rate per NMJ (Hz) (control: 1.056, 1.070 ± 0.1290, n = 8; syt7M1: 1.617, 1.569 ± 0.161, n = 8; tomosynNA1: 6.256, 6.404 ± 0.7475, n = 8; tomosynNA1, syt7M1: 5.092, 5.304 ± 0.3292, n = 8; p < 0.0001; ≥ 5 larvae per group). Complete data for this figure provided in Figure 4—source data 1.


