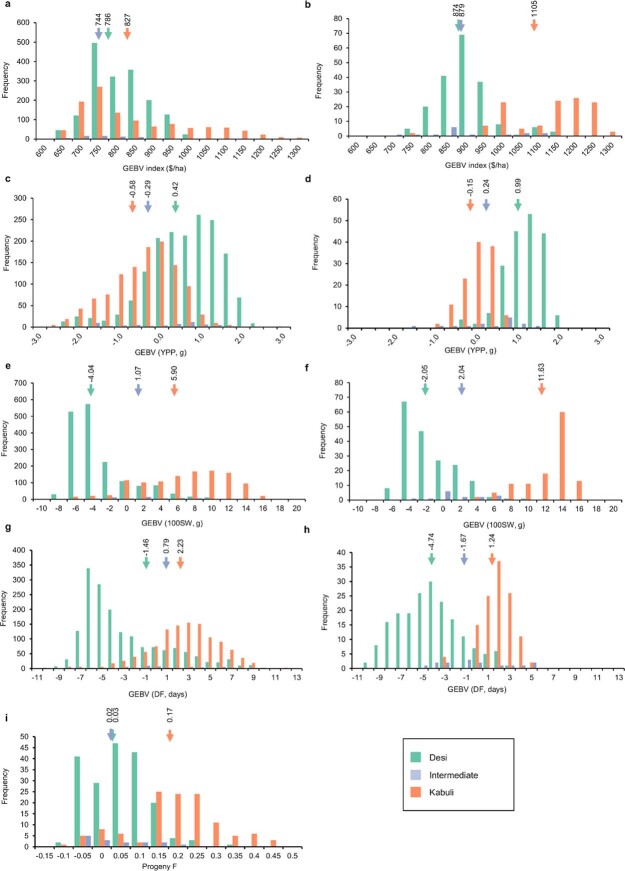
Extended Data Fig. 10. Response to OCS based on mating allocation for candidate parents and predicted cycle 1 progeny family means in economic index.
Index increased from parents to cycle 1 progeny in the kabuli group by US$274/ha, and in the desi group by US$94/ha, and reflects the high value of large seeds in the kabuli group. Arrows indicate the population mean GEBVs for desi (green), kabuli (orange) and intermediate (blue) groups. (a) Response to selection for candidate parents. (b) Response to selection for predicted cycle 1 progeny family. (c, d) Response to OCS among desi, kabuli and Intermediate accessions is shown for genomic estimated breeding values (GEBVs) for yield per plant (YPP, g). YPP increased by 0.6 g (4.5%) above the average candidate parent YPP (13.2 g) in the desi group, and by 0.4 g (3.3%) above the average candidate parent yield (12.2 g) in the kabuli group. Arrows indicate the population mean GEBVs for desi (green), kabuli (orange) and intermediate (blue) groups. (c) candidate parents. (d) predicted cycle 1 progeny family. (e, f) Response to OCS for GEBVs for 100 seed weight (100SW, g). 100SW increased by 2.0 g (12.7%) above the average candidate parent 100SW (15.0 g) in the desi group, and by 5.7 g (22.9%) above the average candidate parent 100SW (24.9 g) in the kabuli group. Arrows indicate the population mean GEBVs for desi (green), kabuli (orange) and intermediate (blue) groups. (e) candidate parents. (f) predicted cycle 1 progeny family. (g, h) Response to OCS for GEBVs for days to flower (DF). DF decreased by 3.3 d (−4.7%) below the average candidate parent DF (68.6 d) in the desi group, and by 1.0 d (−1.4%) below the average candidate parent DF (72.3 d) in the kabuli group. Arrows indicate the population mean GEBVs for desi (green), kabuli (orange) and intermediate (blue) groups. (g) candidate parents. (h) predicted cycle 1 progeny family. (i) Predicted average inbreeding (F) in cycle 1 progeny in among desi, kabuli and intermediate accessions. Progeny inbreeding increased by 0.170 in the kabuli group, by 0.025 in the desi group, and by 0.015 in intermediate group. Arrows indicate the population mean GEBVs for desi (green), kabuli (orange) and intermediate (blue) groups.

