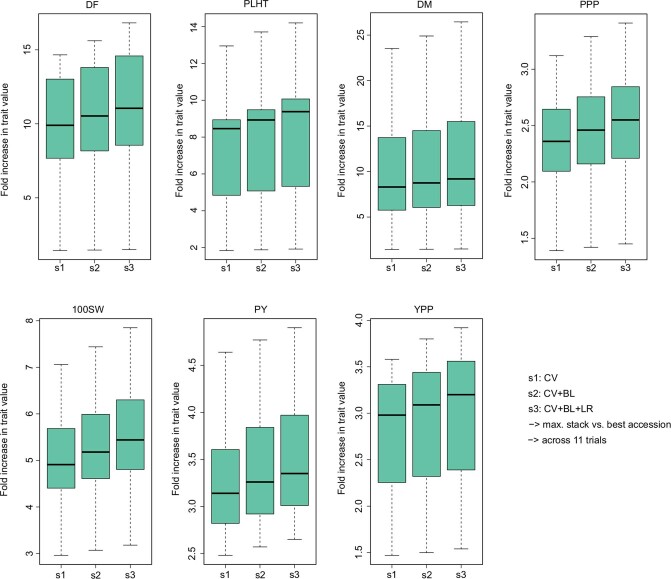
Extended Data Fig. 12. Assessment of trait improvement potential by stacking the superior haplotypes for target traits.
The genotypes were classified into three different groups (cultivars (CV, n = 152); breeding lines (BL, n = 396) and landraces (LR, n = 2,439)) and these genotypes were grouped in three subgroups s1 (CV), s2 (CV+BL) and s3 (CV+BL+LR). Local GEBVs for haplotypes were calculated by firstly grouping SNP markers based on their pairwise linkage disequilibrium, and then summing up allele effects for each haplotype of each block. The best possible genotype for each trait was generated in silico by adding up the best haplotypes across the whole genome. This in silico genotype was then compared to the accession with the highest GEBV. Each of the box plots shows the upper and lower whisker (indicated by dashed lines), the 25% and 75% quartiles and the median (as solid line)

