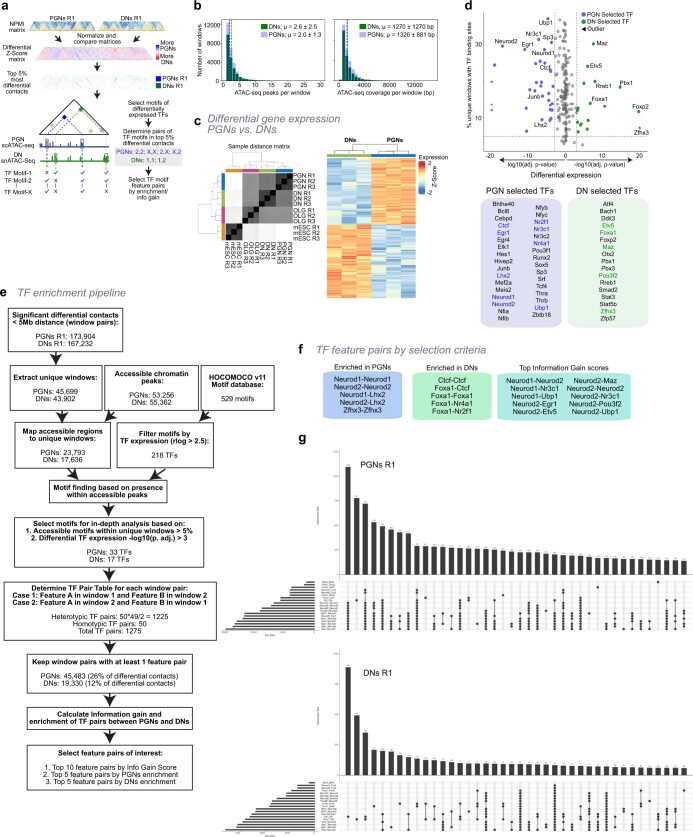
Extended Data Fig. 9. Analysis of transcription factor binding sites and differentially expressed genes in GAM differential contacts between DNs and PGNs.
a, GAM contacts from PGNs and DNs (mouse replicate 1) were normalized (Z-Score) and subtracted to produce differential contacts matrices. Top 5% differential contacts ranged 0.05-5 Mb. Contacts containing TF motifs within accessible chromatin on each contacting window were selected in most (top 5) enriched in PGNs or DNs or with highest discriminatory power (information gain). b, Distribution of the number of ATAC-seq peaks per 50kb GAM window in DNs and PGNs (upper panel; mean(μ) = 2.6 and 2.0 in DNs and PGNs, respectively). Number of base pairs covered by ATAC-seq peaks per 50kb GAM window in DNs and PGNs (lower panel; μ = 1270 and 1326 in DNs and PGNs, respectively). c, Correlation plot of cell type and replicates for differential gene expression analysis. Pseudobulk replicates correlate most highly with one another, followed by brain cell types. Right, heatmap of differentially expressed (DE) genes between PGNs and DNs, clustered by cell type. d, Selection of TF motifs based on percentage of TF motifs in accessible regions within unique windows (> 5%) and differential expression between PGNs (Benjamini-Hochberg corrected two-sided Wald test; log10(p. adj.) < 3) and DNs (-log10(p. adj.) > 3). PGN-selected TFs (33) are shown in blue, DN-selected TFs (17) are shown in green. A list of selected TFs are shown below, with TF motifs continuing after the TF enrichment analysis in (f) coloured in blue (PGNs) or green (DNs). e, Full pipeline to determine pairs of genomic windows in GAM differential contacts containing transcription factor binding sites9. GAM contacts from PGNs and DNs were normalized and compared to produce a differential Z-Score matrix with a 0.05-5 Mb distance range. The top 5% differential contacts with > 0.15 NPMI values for each dataset were extracted from the differential matrices. Accessible chromatin regions were mapped to the top differential contacts. Next, TF motifs were filtered based on expression in at least one cell type. Accessible regions in differential contacts were used to determine the percentage of TF motifs within unique windows. To find TFs with the potential to drive contact specificity between DNs and PGNs, we chose for further analyses the TF motifs that were found in DN or PGN accessible regions within differential contacts which (1) were present in at least 5% of contacts, and (2) the TFs were differentially expressed between DNs and PGNs (-log10(p.adj.) > 3). The 50 TFs which met the requirements were further investigated to determine the frequency of each motif pair (TF feature pair) in PGN and DN differential contacts. The top-20 TF feature pairs were selected for further analyses based: (a) on Information gain score (top 10 feature pairs selected), and (b) on enrichment in either PGNs (top 5 selected) or DNs (top 5 selected). f, TF motif pairs selected by enrichment scores in DNs or PGNs, or by the highest Information gain scores. g, Overlaps of top 20 TF feature pair contacts for PGN and DN significant differential contacts. The top 40 groups with overlapping TF features are shown for each cell type.

