Abstract
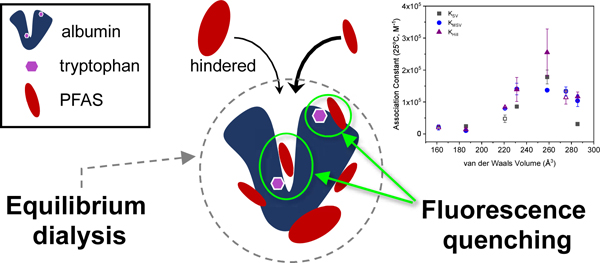
With an increasing number of health-related impacts of per- and polyfluoroalkyl substances (PFAS) being reported, there is a pressing need to understand PFAS transport within both the human body and the environment. As proteins can serve as a primary transport mechanism for PFAS, understanding PFAS binding to proteins is essential for predictive physiological models where accurate values of protein binding constants are vital. In this work we present a critical analysis of three common models for analyzing PFAS binding to bovine serum albumin (BSA) based on fluorescence quenching: the Stern-Volmer model, the modified Stern-Volmer model, and the Hill equation. The PFAS examined include perfluorooctanoic acid (PFOA), perfluorononanoic acid (PFNA), perfluorodecanoic acid (PFDA), perfluorobutanesulfonic acid (PFBS), perfluorohexanesulfonic acid (PFHxS), perfluorooctanesulfonic acid (PFOS), and the replacement compound 2,3,3,3-tetrafluoro-2-(heptafluoropropoxy)propanoate (HFPO-DA or GenX). While all three models capture the general effects of hydrophobicity and steric limitations to PFAS binding, the Hill equation highlighted a unique relationship between binding cooperativity and the number of fluorinated carbons, with PFOA exhibiting the greatest binding cooperativity. The significance of steric limitations was confirmed by comparing results obtained by fluorescence quenching, which is an indirect method based on specific binding, to those obtained by equilibrium dialysis where PFAS binding directly correlated with traditional measures of hydrophobicity. Finally, the binding constants were correlated with PFAS physicochemical properties where van der Waals volume best described the steric limitations observed by fluorescence quenching.
Keywords: PFAS, protein binding, albumin, equilibrium dialysis, fluorescence quenching
Graphical abstract
INTRODUCTION
Per- and polyfluoroalkyl substances (PFAS) are synthetic compounds produced for a wide range of applications including nonstick industrial and commercial products, textiles, and firefighting foams. Due to their persistence in the environment, human and ecosystem-related exposures can occur long after release (Domingo and Nadal, 2017). Ninety-eight percent of the United States population is expected to have detectable amounts of PFAS in their blood (Hu et al., 2016). Water treatment plants are not equipped to remove all PFAS from water and thus, drinking water creates another continuous exposure route (Ross et al., 2018). Although more robust remediation systems are being created for the legacy compounds such as perfluorooctanoic acid (PFOA) and perfluorooctanesulfonic acid (PFOS), shorter and longer PFAS may not respond to the new treatment systems (Ahrens and Bundschuh, 2014; Xiao et al., 2020). It is estimated that there are over 4,700 different PFAS and limited knowledge about even the simplest of compounds (Boston et al., 2019). Once these PFAS enter the body, they are linked to negative health effects such as immunosuppression, obesity, and insulin resistance (Cardenas et al., 2017; Grandjean and Budtz-Jørgensen, 2013; Hartman et al., 2017)
As the scientific community discovers more PFAS, there is a need to understand the effect on ecosystems and humans. Using bioaccumulation modeling, Ng and Hungerbühler (2014) explained that both protein and lipid association are vital to the adaptation of models for different PFAS. Dassuncao et al (2018) also used bioaccumulation modeling but were limited by information available related to protein binding and lipid association. Another predictive tool used is physiologically based pharmacokinetic/ pharmacodynamic (PBPK/PBPD) modeling but also requires accurate tissue-protein partitioning coefficients.
Due to the lack of PFAS protein binding data, researchers have used both computational models and laboratory experiments to obtain binding constants for different PFAS (Chen et al., 2015; Chen and Guo, 2009; Cheng and Ng, 2018; Fedorenko et al., 2021; Qin et al., 2010; Salvalaglio et al., 2010; Wu et al., 2009). Most of this work has been limited to legacy PFAS (PFOA and PFOS). Bovine serum albumin protein (BSA) and/or the human equivalent (HSA) are used because they are the most abundant in the blood and albumin has been shown to be the major carrier of PFAS in the body (Forsthuber et al., 2020). In addition to transport, serum protein binding of PFAS may provide insight into the effect of PFAS on the liver, as serum albumin is catabolized in the liver and kidneys (Gitlin et al., 1958). A limited number of studies have used equilibrium dialysis as a direct measure of the amount of PFAS bound to serum albumin (Allendorf et al., 2019; Bischel et al., 2010; Gao et al., 2019; Wu et al., 2009). This approach captures nonspecific interactions and specific binding events within the hydrophobic pocket of serum albumin.
A common but indirect method to determine PFAS binding to serum albumin has been fluorescence quenching (Chen et al., 2015; Chen and Guo, 2009; Hebert and Macmanus-spencer, 2010; Macmanus-spencer et al., 2010; Qin et al., 2010; Wu et al., 2009). Fluorescence quenching is a widely used spectroscopic technique that measures the binding of small organic molecules and ions to proteins based on the intrinsic fluorescence of amino acid residues within the protein structure. In bovine serum albumin (BSA, Figure S1), the fluorescence stems from two tryptophan (Trp) residues, one located within the hydrophobic cavity of the protein (Trp-213) and one closer the surface (Trp-134) and more accessible by the solvent (water) (Steinhardt et al., 1971). The quenching behavior of these Trp residues indicates the extent of proximal molecular binding and changes in the local polarity of the solvent environment, revealing information about the binding mechanism. Limitations to the fluorescence quenching method include the assumptions behind the quenching models and the apparent lack of consensus as to the appropriate ratio of PFAS to albumin.
In our previous work, Fedorenko et al. (2021) examined the entropic driving force for PFAS binding to BSA using fluorine nuclear magnetic resonance spectroscopy (19F-NMR) and concluded that binding occurs via both specific binding within the hydrophobic pocket as well as adsorption to the surface of the protein. Here, our aim was to examine how those different types of binding events influence the fluorescence quenching of BSA and to evaluate the three common models used to calculate PFAS-BSA association constants against equilibrium dialysis.
This work examined a range of perfluoroalkylcarboxylates (PFCA, C7,F to C9,F where Cx,F denotes the number of fluorinated carbons), perfluoroalkylsulfonates (PFSA; C4,F, C6,F and C8,F), and the replacement compound 2,3,3,3-tetrafluoro-2-(heptafluoropropoxy)propanoate (GenX; C5,F; note that only three carbons are perfluorinated) and established binding relationships for PFAS physicochemical properties (Scheme 1). Three different data analysis techniques were used to correlate fluorescence quenching with protein binding: the Stern-Volmer model, the modified Stern-Volmer model, and the Hill equation. Comparisons between fluorescence quenching and equilibrium dialysis results provided key insights into the underlying mechanisms. Relationships were established between octanol-water partitioning coefficients (log Kow) as well as van der Waals volume and the extent of BSA binding to aid in prediction tools for the wide range of PFAS.
Scheme 1.
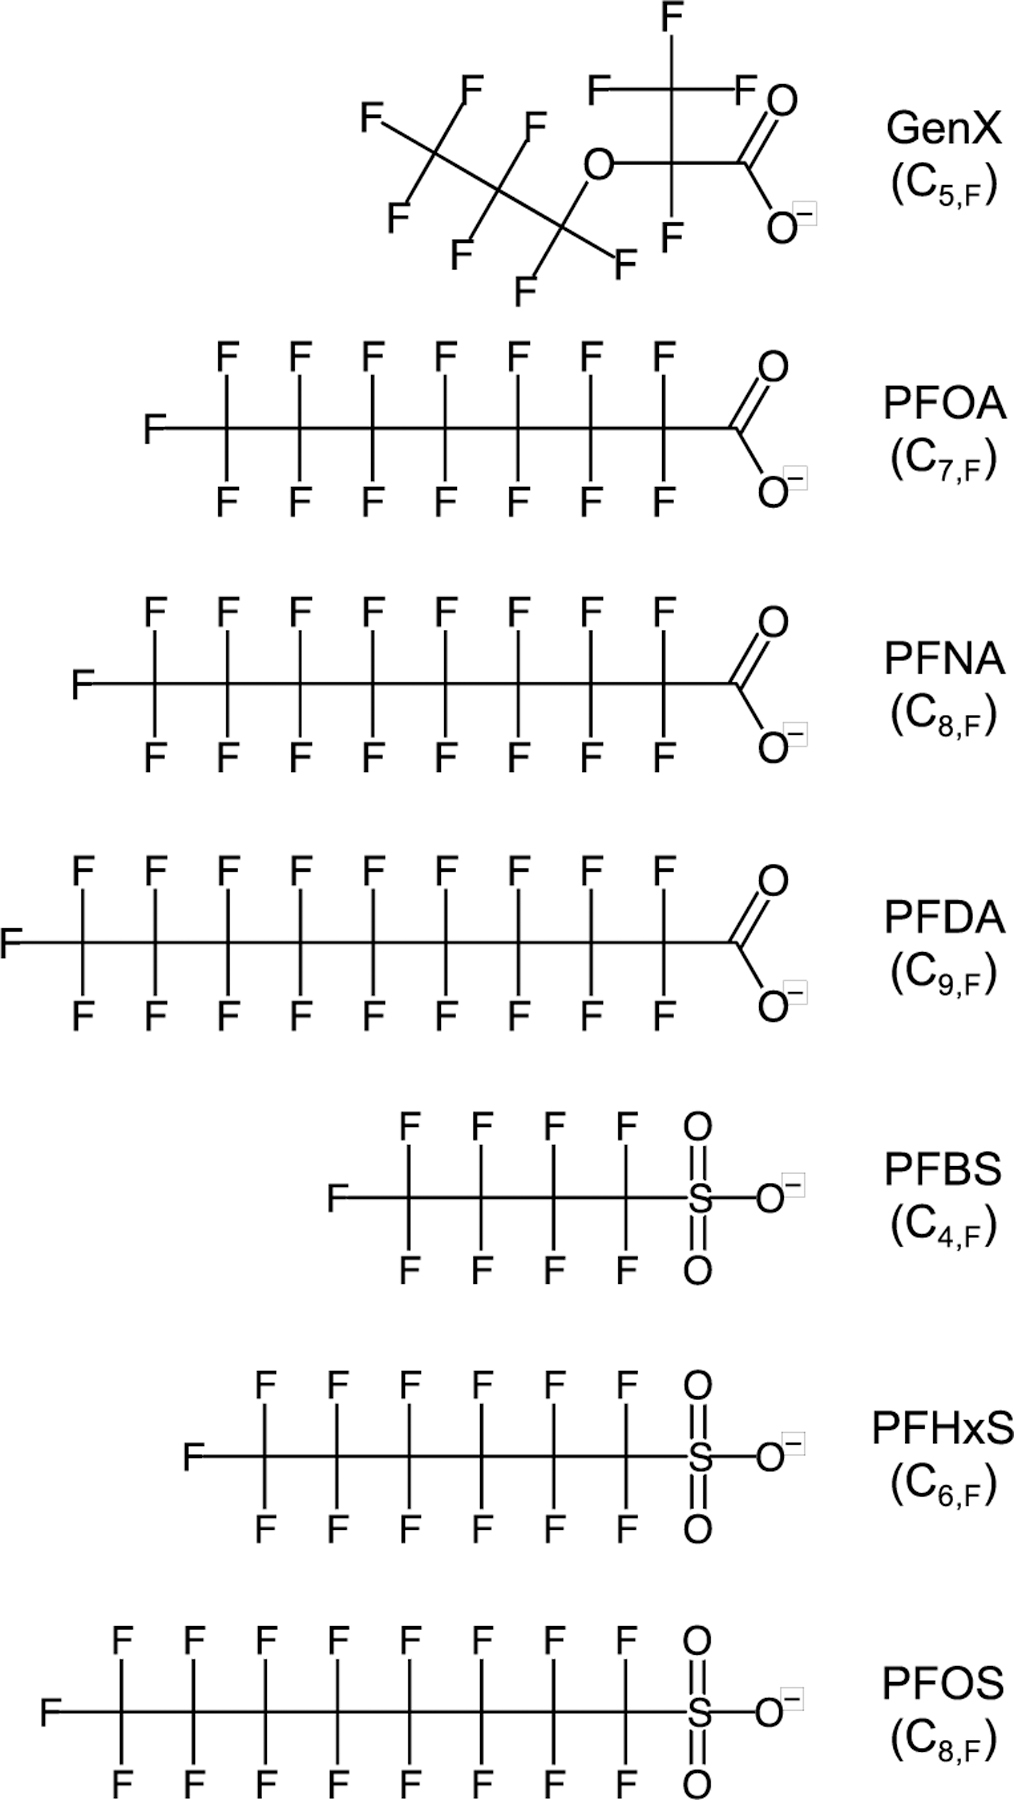
PFAS examined. Cx,F denotes the number of fluorinated carbons.
MATERIALS AND METHODS
Materials.
Bovine serum albumin (lyophilized powder, 99% fatty acid free) was obtained from Sigma-Aldrich (St. Louis, MO). A BSA concentration of 1.25 µM in pH 7.4 phosphate buffered saline (1X PBS) was used in each fluorescence quenching experiment. The solution of BSA was kept at 4°C prior to use.
Perfluorooctanoic acid, perfluorononanoic acid (PFNA), perfluorodecanoic acid (PFDA), 2,3,3,3-tetrafluoro-2-(heptafluoropropoxy)propanoate (Gen X), perfluorooctanesulfonic acid, perfluorohexanesulfonic acid (PFHxS), and perfluorobutanesulfonic acid (PFBS) were obtained from Accustandard, Inc (New Haven, CT). PFAS solutions in PBS were stored at room temperature in polypropylene containers.
Equilibrium Dialysis.
Samples were prepared in a rapid equilibrium dialysis device (RED; Thermo Fisher, Waltham, MA) such that the final concentrations of each mixture would contain 10 µM bovine serum albumin (BSA) with either 10 µM, 1 µM, or 20 µM PFAS in phosphate buffered saline (PBS). These samples were incubated for one hour at 37°C prior to experimentation. The RED procedure was followed as described previously and as recommended by the manufacturer (Gao et al., 2019; Waters et al., 2008). Controls of 10 µM of each PFAS were also added to the plate to account for PFAS adsorption onto the membrane or sides of the chamber. After four hours of incubation at 37°C under constant shaking, samples were collected from both sides. Samples from the buffer side, containing no protein, were prepared for analysis by liquid chromatography/mass spectrometry (LC/MS). Details of the full LC/MS procedure and association constant analysis can be found in the Supplementary Information.
The fraction of bound PFAS was determined by mass balance as f = ([PFAS]initial – [PFAS]unbound)/[PFAS]initial where [PFAS]initial – [PFAS]unbound = [PFAS]bound. From f, the protein/water partition coefficient, KPW (g bound PFAS mL−1 BSA)/(g free PFAS mL−1 water), was determined as
| (1) |
where ρP is the specific volume of the protein (0.733 mL g−1) and [P] is the total BSA concentration (10 µM or 6.6×10⁻³ g mL−1) (Bischel et al., 2011). The association constant, Ka (M−1), was calculated as (Allendorf et al., 2019)
| (2) |
where the term ([P] – [PFAS]bound) represents the residual unbound BSA protein assuming 1:1 molar binding.
Fluorescence Quenching.
Quenching experiments were conducted using a PerkinElmer LS 55 Fluorescence Spectrophotometer with a 150 W xenon discharge lamp. The temperature was set to 25°C, 30°C, 35°C, or 40°C using a PerkinElmer PTP-1 Peltier Temperature Programmer. The excitation wavelength was set to 295 nm, data was collected from an emission range of 300 nm to 500 nm at a rate of 100 nm/min, and the slit widths for both the emission and excitation were set to 6 nm.
A solution of BSA (2 mL) was added to a 1 cm quartz cuvette (Starna Cells, Atascadero, CA) and the fluorescence spectrum of BSA alone was measured to provide a baseline. Aliquots of PFAS stock solutions were added incrementally to achieve the desired concentration range. A linear calibration curve of BSA fluorescence intensity over a range of concentrations was used to correct for dilution of BSA. The quenching analyses performed herein were based on the emission intensity at a wavelength of 349 nm, which was the wavelength for maximum emission intensity for BSA alone.
RESULTS AND DISCUSSION
PFAS binding by equilibrium dialysis
Equilibrium dialysis provides a direct measure of PFAS-protein binding through specific and non-specific interactions, and a comparative basis for fluorescence quenching-based association constants. The fraction of bound PFAS f at 37°C, the resulting protein/water partition coefficient KPW, and the calculated association constants Ka are reported in Table 1. In addition to representing physiological temperature, 37°C was used in accordance with reported protocols for protein binding determined by equilibrium dialysis.
Table 1.
Equilibrium dialysis results for PFAS-BSA binding at 37°C.
| PFAS | f a | KPW (105)a | Ka (105 M−1)a | Ka (105 M−1)b |
|---|---|---|---|---|
| PFOA | 0.755 (0.038) | 0.66 (0.13) | 3.77 (0.80) | 11 (1.1) |
| PFNA | 0.975 (0.005) | 8.52 (1.62) | 44.05 (8.37) | 14 (2.2) |
| PFDA | 0.983 (0.004) | 12.66 (3.23) | 61.62 (15.72) | 36 (3.1) |
| PFBSc | 0.249 (0.064) | 0.07 (0.02) | 0.93 (0.55) | 1.1 (0.28) |
| PFHxS | 0.842 (0.008) | 1.11 (0.06) | 6.48 (0.39) | 44 (3.5) |
| PFOS | 0.942 (0.004) | 3.39 (0.27) | 17.99 (1.44) | 32 (4.9) |
| Gen Xc | 0.265 (0.006) | 0.07 (0.002) | 0.65 (0.04) | 0.23 (0.05) |
Standard error shown in parentheses
Reported by Allendorf et al. (2019)
KPW and Ka determined at a PFAS:BSA molar ratio of 2:1. All other values are determined at a 0.1:1 molar ratio (Additional details in the Supplemental Information).
The values for the fraction of bound PFAS, f, and the resulting KPW values obtained in this work are in agreement with Bischel et al (2011) for the longer compounds (PFNA, PFDA, and PFOS) but not for the shorter compounds where f values ≥0.99 were reported for PFOA, PFBS, and PFHxS. The f values for these shorter compounds fall between those reported by Bischel et al. (2011) and Allendorf et al. (2019), where low bound fractions were observed for PFOA and PFBS (f = 0.44), and PFHxS (f = 0.62). In this work, f increased with the number of fluorinated carbons from C4,F to C9,F. There was no apparent evidence for longer compounds adopting a helical structure that would result in maximum KPW values at C6,F with decreases in KPW above C7,F (Bischel et al., 2011).
A positive correlation was observed between the association constants and the logarithm of the octanol-water partition coefficient, log Kow, for non-ionic (associated; obtained from Pubmed; Figure 1A) and ionic (dissociated at pH 7.4; calculated using Marvin Sketch; Figure 1B) PFAS species, in agreement with values reported previously using PFAS chain length as a proxy for hydrophobicity (Table 1) (Allendorf et al., 2019). The PFCA correlation includes GenX, suggesting that binding of this alternative PFAS based on hydrophobicity is similar to the linear PFCA. Log Kow correlations are used to examine quantitative structure-activity relationships (QSAR) governing ligand binding to proteins, with the log Kow coefficient reflecting the strength of hydrophobic binding and depth of insertion into the protein structure (Hansch and Klein, 1986). A coefficient ≥ 1 indicates a strong dependence on hydrophobicity and deep insertion upon binding, which was observed for PFCA and PFSA. Larger log Kow coefficients were determined for PFCA, suggesting a stronger dependence on hydrophobicity.
Figure 1.
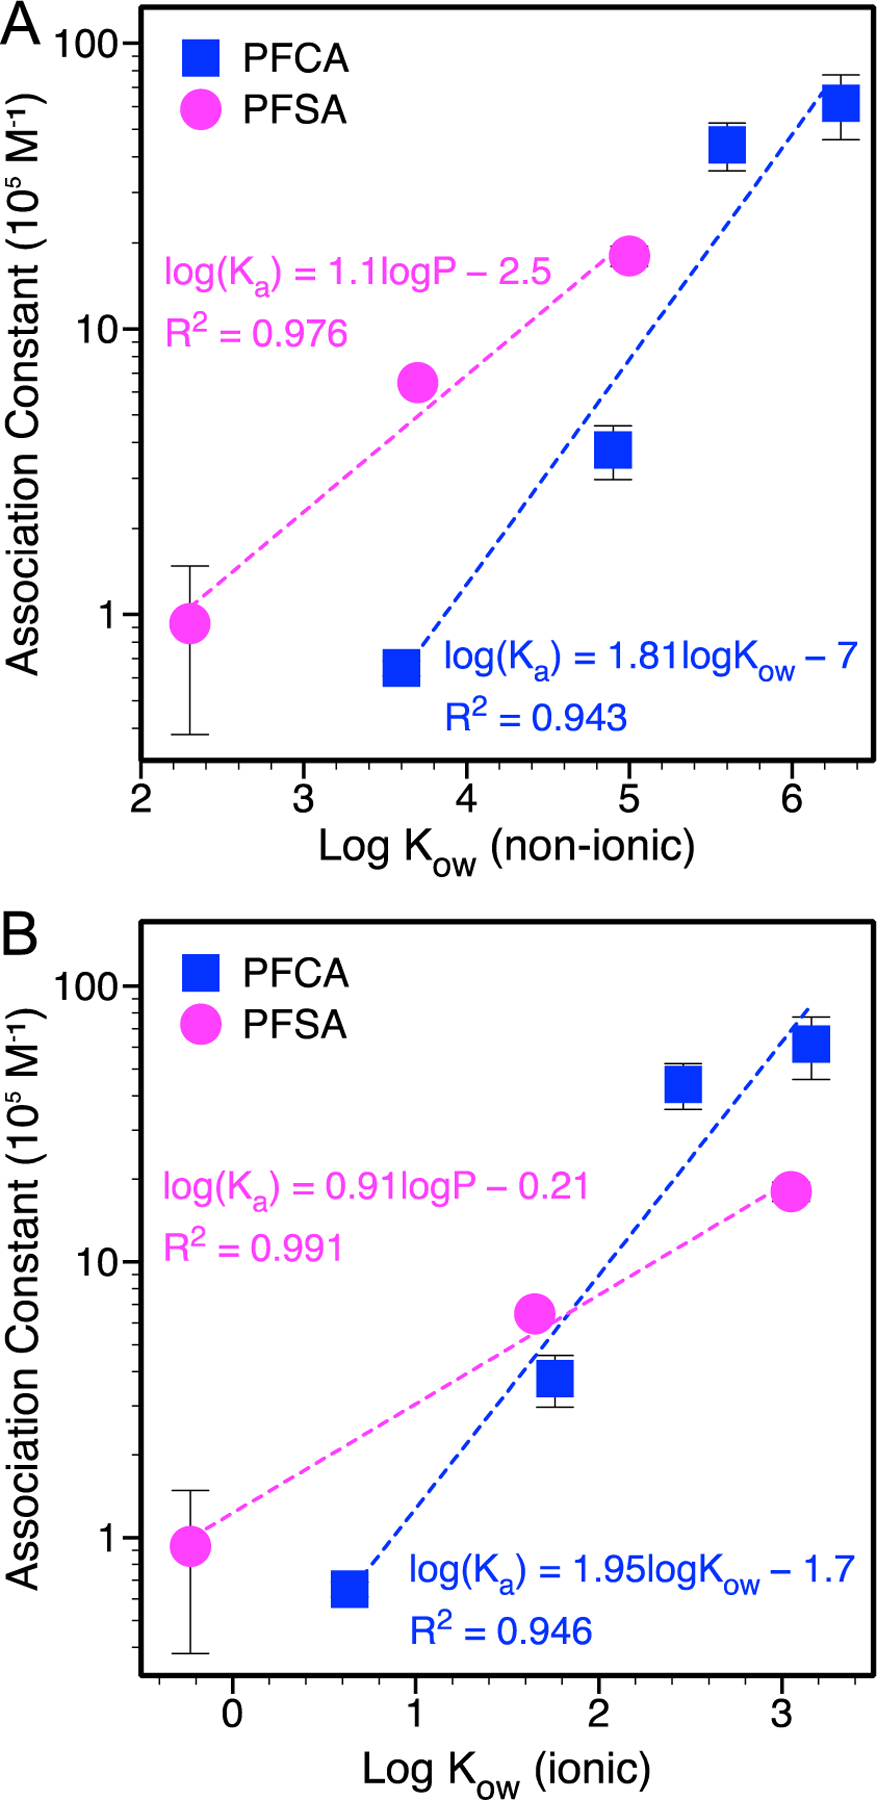
PFAS-BSA association constant determined by equilibrium dialysis as a function of the logarithm of the octanol-water partition coefficient, log Kow, for (A) non-ionic (associated; obtained from Pubmed) and (B) ionic (dissociated at pH 7.4; calculated using Marvin Sketch) PFAS species. Standard error bars not observed are smaller than the symbols. Ka in the fitted equations has units of 105 M−1.
PFAS binding by fluorescence quenching
In contrast to equilibrium dialysis measurements, fluorescence quenching-based measurements are based on PFAS binding to specific sites on BSA containing tryptophan (Trp) residues. The extent of fluorescence quenching can be directly related to PFAS concentration through the Stern-Volmer equation, which has been reported for PFAS-BSA binding (Bischel et al., 2011, 2010; Chen et al., 2015; MacManus-Spencer et al., 2010; Qin et al., 2010). The Stern-Volmer equation is written as (Lakowicz, 2006)
| (3) |
where F is the fluorescence emission intensity at a specified wavelength (349 nm) of the protein in the presence of the quencher, F0 is the fluorescence emission intensity of the protein in the absence of the quencher, KSV is the Stern-Volmer association constant, and [Q] is the concentration of the unbound quencher, [PFAS]unbound. In terms of BSA and PFAS, KSV is the degree of association between the quencher and the protein at equilibrium
| (4) |
| (5) |
where [BSA-PFAS] is the concentration of the bound complex. The Stern-Volmer equation is based on the following assumptions (Eftink and Ghiron, 1981; Lakowicz, 2006): (i) The concentration of the quencher is large relative to protein concentration such that [Q]total (or [PFAS]total) can be substituted for [Q] (or [PFAS]unbound), (ii) the protein-quencher complex is nonfluorescent, and (iii) binding is noncooperative.
Exemplary spectra and Stern-Volmer plots are shown in the Figures S2 and S3, respectively. With the exception of PFNA, equation 3 yielded a linear curve suggesting a static quenching process where the BSA-PFAS complex is non-fluorescent. However, fitted KSV values over [PFAS] from 0 to 6.8 μM did not change appreciably over the temperature range examined (Figure 2A; Table S2), in contrast with reported studies showing a strong temperature dependence indicative of enthalpic binding. This may reflect a more dominant entropic contribution as previously shown using 19F-NMR (Fedorenko et al., 2021) or an apparent combined static and dynamic quenching process, where elevated temperatures increase the diffusivity of binding ligands and thus the collision frequency with the binding site. Compared to previous studies, the KSV values obtained in this work at 25°C are on the same order of magnitude for PFOA and PFOS at reported temperatures ranging from 21°C to 27°C (Chen et al., 2015; Li et al., 2010; Qin et al., 2010).
Figure 2.
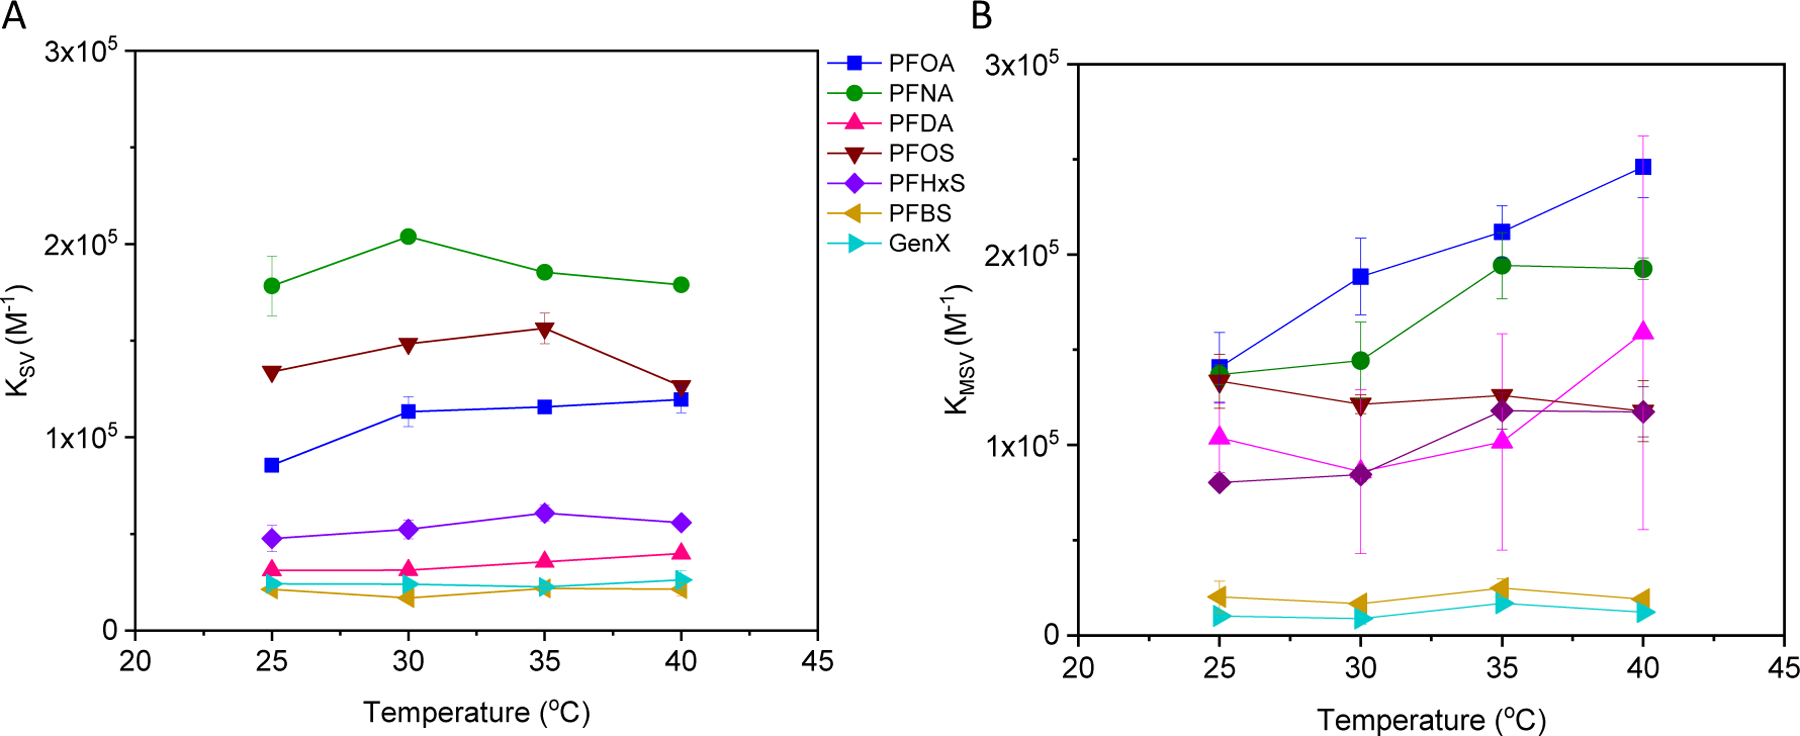
A) Stern-Volmer (KSV; equation 3, Figure S3) and B) modified Stern-Volmer (KMSV; equation 6, Figure S4) association constants for PFAS binding to BSA as a function of temperature. Standard error bars shown are based on two independent measurements.
The first limiting assumption of the Stern-Volmer equation is that [PFAS]total ≈ [PFAS]unbound. To test this assumption, [PFAS]total was increased ten-fold and [BSA] was held constant. Results for fluorescence quenching decayed exponentially with increasing [PFAS], displaying a plateau at high [PFAS]. In this case, the modified Stern-Volmer equation was required to account for saturation by incorporating a fractional accessibility term, fa, of the PFAS to the quenching site (Chen and Guo, 2009; Qin et al., 2010)
| (6) |
where KMSV is the modified Stern-Volmer association constant. Equation 6 accounts for downward curvature in Stern-Volmer plots and assumes that, as [Q] ➛ ∞, only the inaccessible fluorescent amino acid residues can fluoresce. Thus, it allows for two types of fluorescent residues in a protein—those accessible to the quencher and those not accessible to the quencher—with no allowance for a partially accessible fluorophore or for binding cooperativity (Lakowicz, 2006). For BSA this involves PFAS binding near Trp-214 and Trp-134, with one of these sites being inaccessible. The modified Stern-Volmer equation was applied over [PFAS] ranging from 14.7 to 68.2 μM for PFCAs and 7.4 to 74.2 μM or 35.7 to 74.2 μM for PFSAs. Data obtained below these lower [PFAS] limits led to poor fits.
Fitted KMSV were similar to KSV for many of the PFAS examined (Figure 2, Tables S2 and S3), which implies that the assumption [PFAS]total ≈ [PFAS]unbound is reasonable for the Stern-Volmer model and that ‘fractional accessibility’ accounts for saturation at high [PFAS] in the modified Stern-Volmer model. However, the trends in the association constants with PFAS size were different with the exception of the two smallest PFAS, GenX and PFBS. These trends are shown below for 25°C with the largest PFAS, PFDA, in bold and the sulfonates underlined to distinguish them.
The fa values (Table S3), ranged from approximately 0.5 to 0.7, with PFBS being the exception (~0.3). Mechanistically, this means that the binding sites with fluorescent Trp residues are less accessible to PFBS binding. Being the smallest and most water soluble PFAS examined, PFBS (Cn,F = 4) may have lacked the hydrophobicity needed to insert into the hydrophobic, tryptophan-containing regions of BSA. Interestingly, this argument does not apply to GenX (Cn,F = 5), which showed similarly small KMSV values with fa values that were two-fold higher than PFBS. Despite GenX having access to the binding sites, the affinity between GenX and the binding site was low. This may be due to the non-linear structure where the CF3 group near the carboxylic acid headgroup sterically hindered binding.
The third model applied to the fluorescence quenching data – the Hill equation – also accounts for the residual fluorescence upon saturation, Fres, but does not ascribe Fres to fractional accessibility. The model applied is based on the Hill approximation proposed by Hebert et al for PFAS-protein binding (Hebert and Macmanus-spencer, 2010)
| (7) |
where KHill and nHill are the Hill binding constant and coefficient, respectively. At high [PFAS] relative to [BSA], this model accurately reflects the quenching conditions, which are dependent upon the change in protein conformation with the type and concentration of PFAS (Hebert and Macmanus-spencer, 2010). This dependence is described by nHill, which accounts for binding cooperativity. Hill coefficients greater than 1, nHill > 1, denote positive binding cooperativity, nHill < 1 denote negative binding cooperativity, and nHill = 1 denote noncooperative binding. Unlike the Stern-Volmer and modified Stern-Volmer models where data sets were truncated to accommodate the models, excellent fits were obtained for the Hill model over the entire concentration range examined.
Comparisons between KHill, KMSV and KSV are shown in Figure 3 at the four temperatures examined (data presented in Table S3). Overall, the association constants based on KHill were similar to or greater than that for KMSV and KSV; or alternatively, the Stern-Volmer models underestimated PFAS-BSA binding compared to the Hill model. This was particularly true for the most hydrophobic carboxylic acids, PFOA, PFNA, and PFDA. There was comparatively better agreement between KHill, KMSV and KSV with the sulfonic acids.
Figure 3.
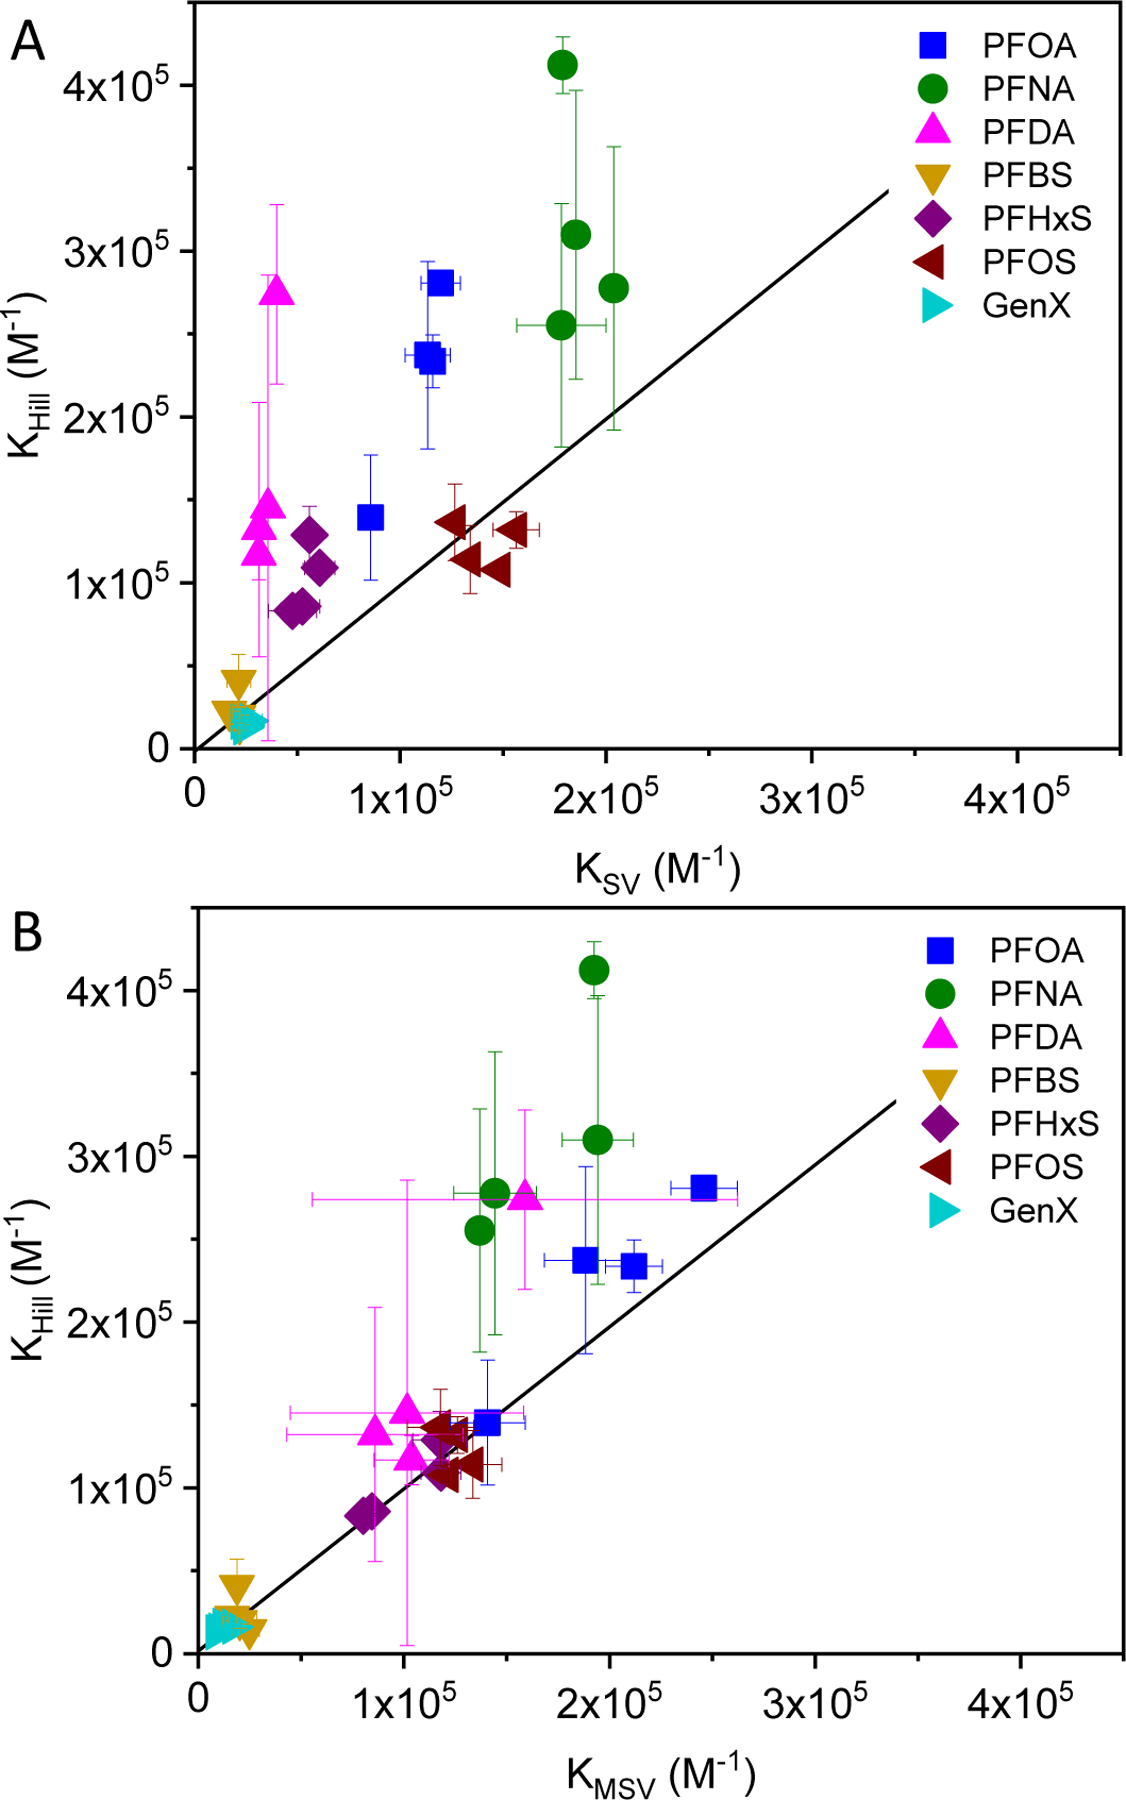
Comparison of PFAS-BSA association constants determined by fluorescence quenching from the Hill equation (KHill) to those determined using the (A) Stern-Volmer (KSV) and (B) modified Stern-Volmer (KMSV) equations. The data points for each PFAS were obtained at temperatures of 25°C, 30°C, 35°C, and 40°C (data shown in Table S3). The solid lines represent the condition where the association constants are equal.
Additional insight can be gained by analyzing the binding cooperativity described by nHill as a function of the number of fluorinated carbons (Figure 4). Results shown at 25°C and 35°C depict two regions – negative cooperativity or noncooperative/positive cooperativity – that are independent of temperature. Negative binding cooperativity (nHill < 1) was observed for small (PFBS, Cn,F = 4) and large (PFDA, Cn,F = 9) PFAS, while noncooperative (GenX, PFNA) or positive binding cooperativity (PFHxS, PFOA, PFOS) was observed for PFAS with Cn,F = 5 to 8 (nHill ≥ 1). The trend in binding cooperativity with Cn,F may reflect the ability for intermediate PFAS to ‘fit within’ and bind to the hydrophobic regions containing Trp, leading to conformational changes within the protein that further increases binding affinity (Bischel et al., 2011).
Figure 4.
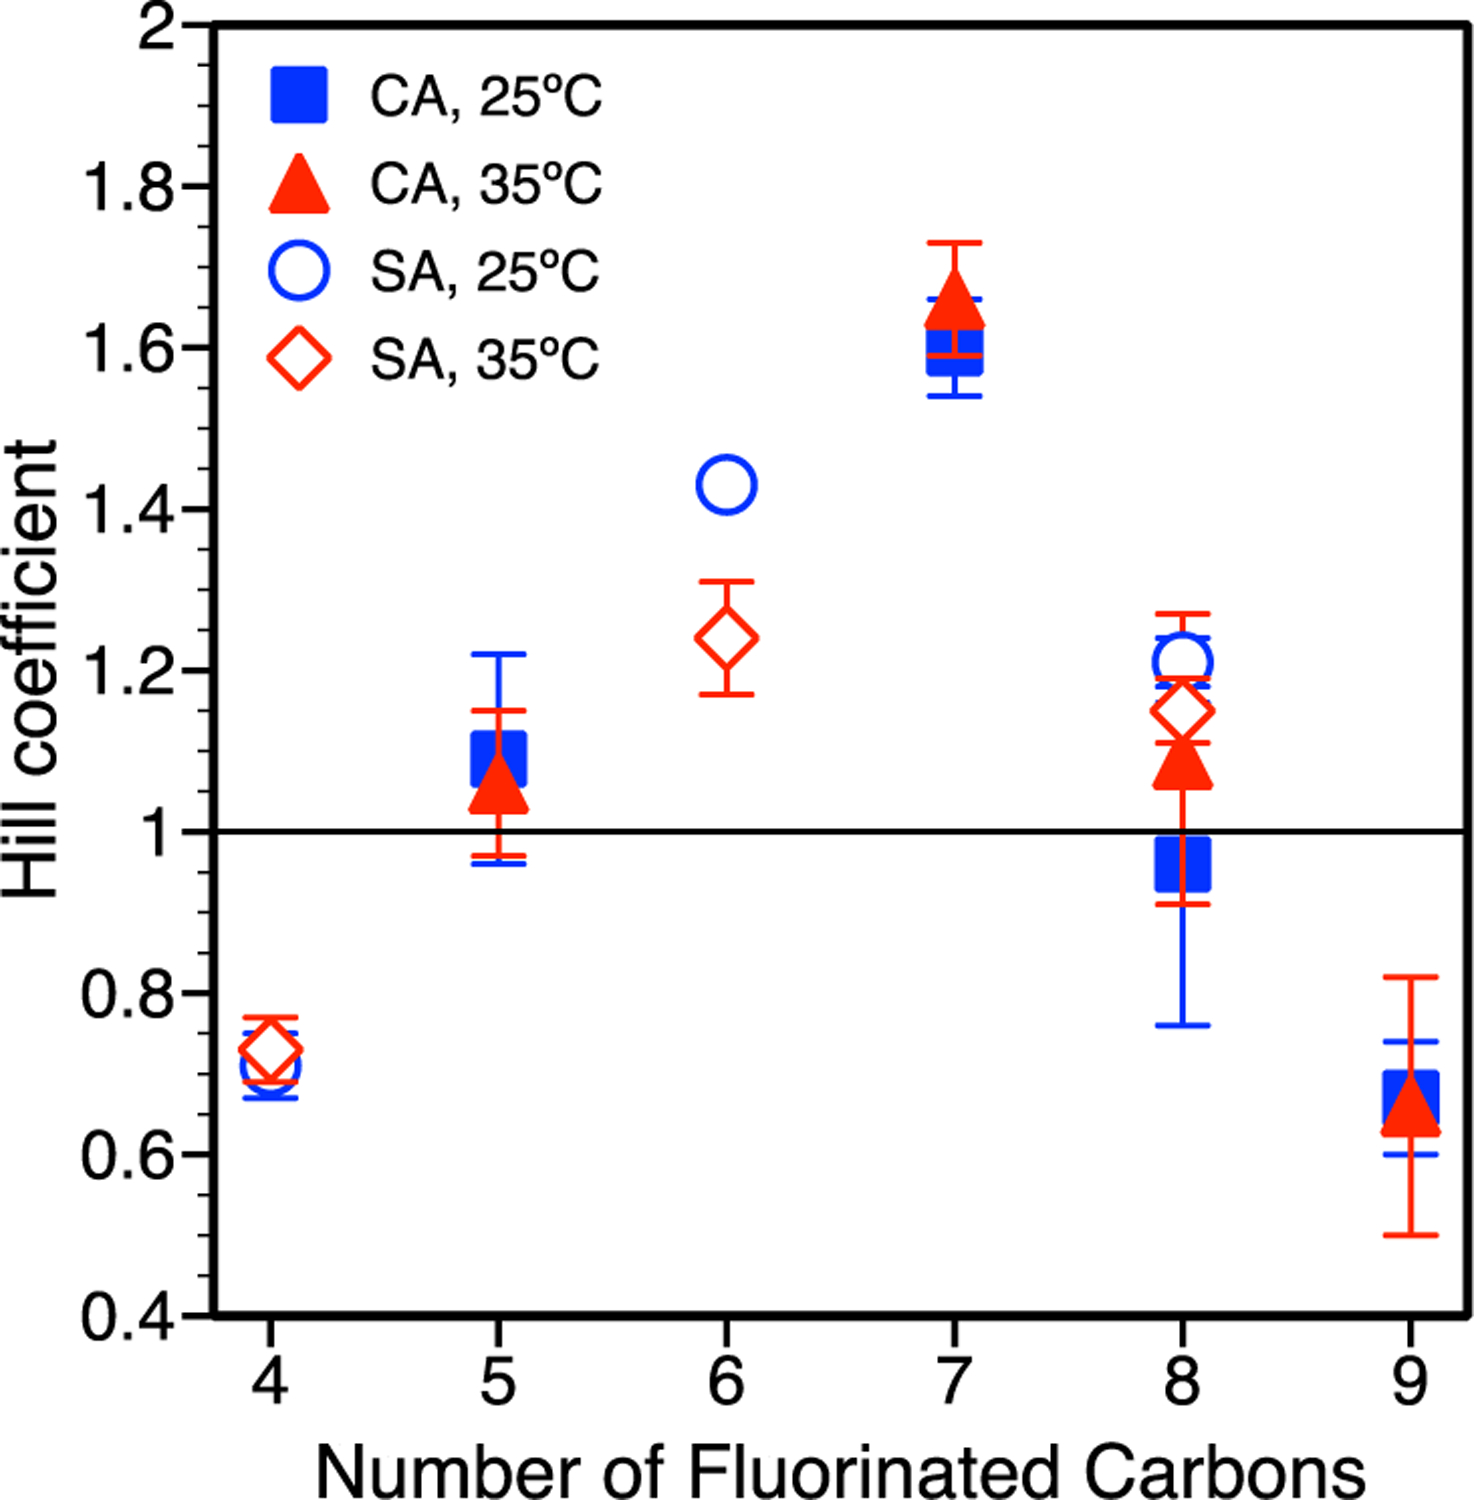
Hill coefficient, obtained from the Hill model fitting (equation 7), describing PFAS-BSA binding cooperativity. Standard error bars shown are based on three independent measurements for PFCAs and two independent measurements for PFSAs. PFCA and PFSA are abbreviated as CA and SA, respectively.
To further describe the trends in binding across the range of PFAS, the association constants obtained via fluorescence quenching were compared to molecular descriptors. Results for Ka versus the number of fluorinated carbons (Figure 5A) agree with previous work showing that PFOA and PFOS preferentially bind to a hydrophobic cavity within a serum albumin protein (Chen and Guo, 2009; Salvalaglio et al., 2010). However, the number of fluorinated carbons is not an adequate proxy for molecular size. PFNA showed the highest association constant, higher than PFOS, despite having the same number of fluorinated carbons. An analysis of the van der Waals volume, VvdW, shows that PFOS (C8,F) is larger than PFNA (C8,F) and similar in size to PFDA (C9,F), which also showed a lower Ka compared to PFNA (Figure 5B). The importance of steric hinderance is further denoted by PFOA (C7,F), which is less hydrophobic than PFOS and has a considerably smaller VvdW, but similar association with BSA. The trends in Ka with VvdW are similar to those with the ionic log Kow (Figure 5C), which takes into consideration the headgroup charge, where the two largest PFAS, PFOS and PFDA, are also the most hydrophobic yet exhibit a lower Ka than PFNA. This trend was not captured with the associated log Kow values (Figure 5D). Above an optimal size, described by VvdW, the PFAS molecules no longer ‘fit’ into the same location on BSA regardless of their hydrophobicity.
Figure 5.
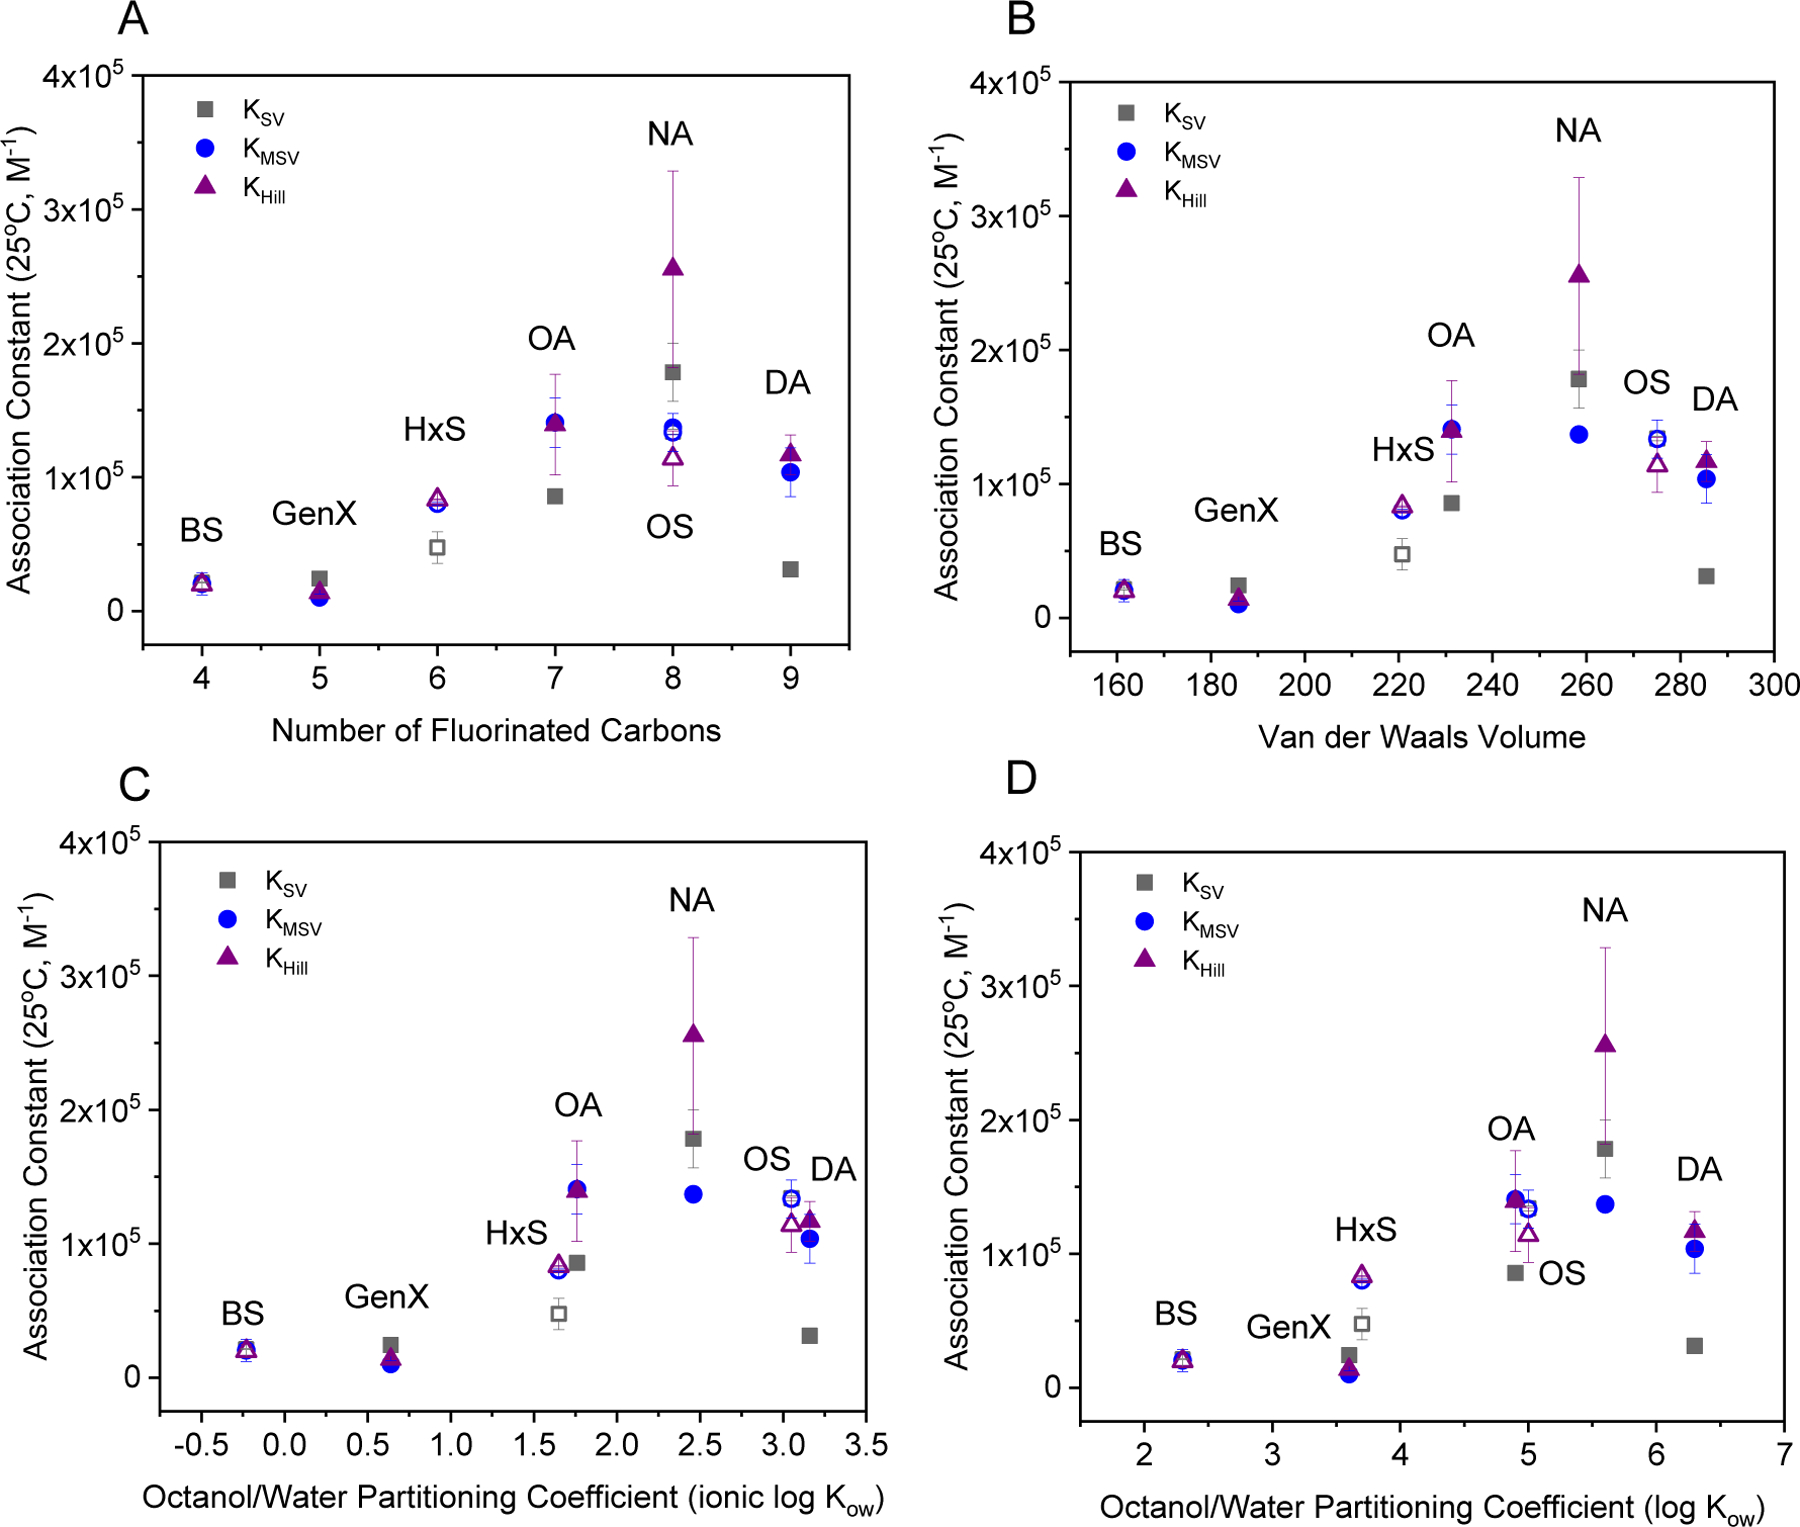
PFAS association constants determined by fluorescence quenching as a function of molecular descriptors: A) the number of fluorinated carbons, B) the calculated van der Waals volume, C) the logarithm of the ionic the octanol-water partitioning coefficient, or ionic log Kow, calculated at pH 7.4, and D) the logarithm of the octanol-water partitioning coefficient or log Kow obtained via PubChem as of March 22, 2021. Closed symbols correspond with PFCA and open symbols PFSA.
The hydrophobic nature of the PFAS-protein interactions can be explored further by evaluating the wavelength shift in the fluorescence spectra (Figure S5), consistent with previous studies of both BSA and HSA (Liu et al., 2017; Qin et al., 2010; Wu et al., 2009). A shift in the wavelength associated with maximum fluorescence emission indicates a change in the solvent environment surrounding the fluorescent Trp residues. PFBS and GenX do not show marked shifts in emission wavelength, consistent with low binding affinity within the hydrophobic cavity of BSA and/or their inability to dehydrate the cavity and cause local decreases in solvent polarity. For all other PFAS, the blue shift indicates that PFAS binding created a more hydrophobic environment as the conformation of the protein changes and bound water molecules are displaced by the PFAS (Vivian and Callis, 2001). The extent of wavelength shift roughly correlates with PFAS hydrophobicity. The maximum shifts occur for PFNA (−13 nm) for the carboxylates and PFHxS (−10 nm) for the sulfonates. The shift was not as great for the larger PFDA (−10 nm) or PFOS (−7 nm), supporting the concept that these molecules do not fit as well within the cavity, which has been reported for PFDA but not PFOS (Bischel et al., 2010; Macmanus-spencer et al., 2010).
Mechanistic insight comparing fluorescence quenching and equilibrium dialysis
The difference between the two experimental methods presented here is that fluorescence quenching reflects PFAS binding within the hydrophobic cavity of BSA, while equilibrium dialysis reflects all binding. Comparing these results can shed more light on the interaction of different PFAS with BSA. For PFDA (Figure 6), the Ka from equilibrium dialysis is an order of magnitude higher than Ka values determined by fluorescence quenching. As PFDA is the largest molecule studied (Figure 5B) based on VvdW, size exclusion from the hydrophobic pockets may make binding to the surface more energetically favorable. For sulfonates, PFOS shows a similar trend. Although PFOS and PFNA have the same number of fluorinated carbons, PFNA has a higher association constant than PFOS.
Figure 6.
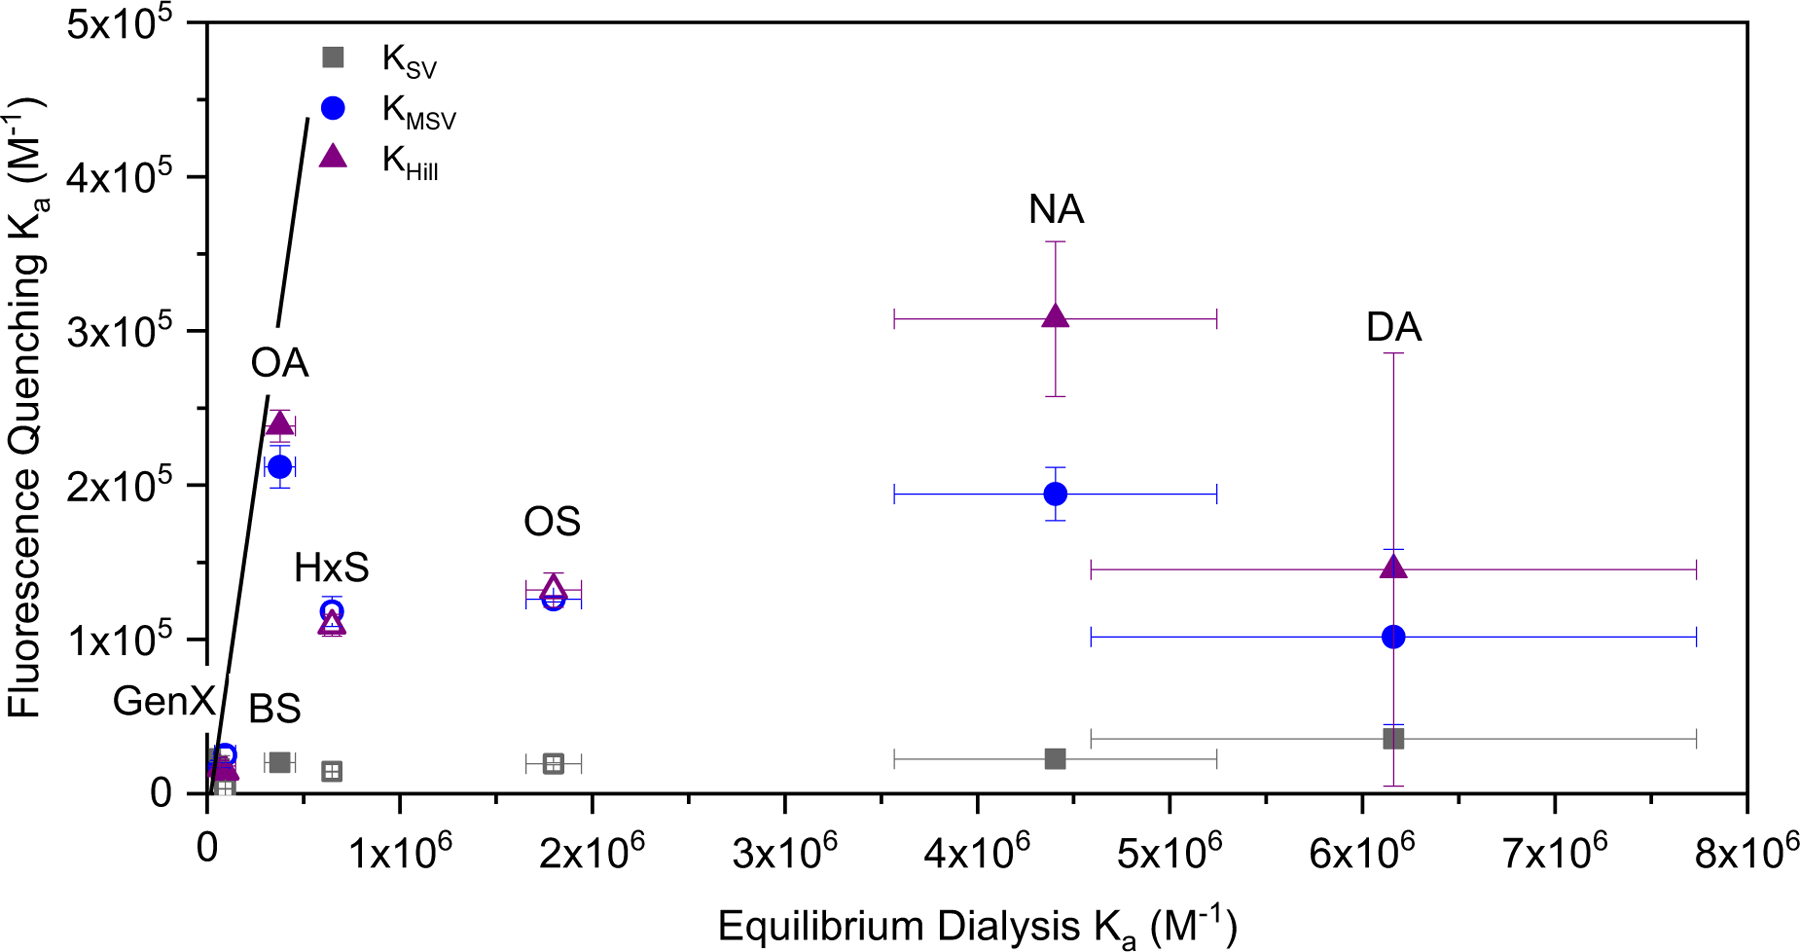
A comparison of association constants determined at 35°C by fluorescence quenching and equilibrium dialysis. The solid lines represent the condition where the association constants are equal. Closed symbols correspond with PFCA and open symbols PFSA.
Based on the comparison in Figure 6, protein binding based on the Hill equation, which accounts for binding cooperativity, is in closer agreement with the ‘true’ extent of binding based on equilibrium dialysis, particularly for the more hydrophobic PFAS. However, the results clearly demonstrate that both approaches should be combined to gain a mechanistic understanding of PFAS binding as a function of their physicochemical properties.
The importance of understanding the effect of physicochemical properties on protein binding becomes more apparent as industry producers move toward using shorter chain length PFAS. However, shorter chains do not necessarily result in lower protein binding affinities than longer chain PFAS (Allendorf et al., 2019). Our work shows, based on both experimental techniques, that PFHxS binds to BSA with similar affinity as PFOS. This is significant to exposure assessment and health risks as albumin has been shown to be the major carrier of PFAS in human blood (Forsthuber et al., 2020). As more PFASs are developed as alternatives to legacy compounds, there is a pressing need to continue to rigorously assess protein binding and identify correlations with PFAS molecular properties. One way to accomplish this is through the link between log Kow and degree of binding. For example, as log Kow (hydrophobicity) increases for the PFAS of C8,F and smaller in this study, the degree of binding to BSA increases. As is shown with PFDA (C9,F), this model parameter should be coupled with Van der Waals volume to account for steric hinderance to binding.
CONCLUSIONS AND IMPLICATIONS
With albumin being a major protein carrier for PFAS in vivo, accurate protein binding constants and mechanistic insight into binding are imperative to guide bioaccumulation models and physiologically based pharmacokinetic/pharmacodynamic (PBPK/PBPD) models. In this work, a systematic analysis of fluorescence-based protein binding models was conducted for an expanded range of PFAS and compared to equilibrium dialysis experiments. Both experimental methods provide valuable and complimentary insight into PFAS-BSA binding. While fluorescence quenching focuses on the hydrophobic pocket of the protein, equilibrium dialysis reports all types of binding, whether in specific locations or to the surface. By critically examining the differences between the equilibrium dialysis and fluorescence quenching, we can gain insight into binding mechanisms, especially for those PFAS-serum protein interactions that have not yet been characterized by crystal structure or other methods.
Fluorescence quenching has been used to evaluate PFAS binding to serum albumin proteins but there is no clear guidance on the applicability or limitations of the three models discussed in this work: the Stern-Volmer model, the modified Stern-Volmer model, and the Hill equation. By limiting analysis to one of these methods, valuable insight about binding cooperativity and fractional accessibility to binding sites may not be gained. Combining models affords another layer of mechanistic insight. As with any model, understanding the assumptions and limitations is vital to interpretation of the underlying mechanisms.
In addition, the trend in association constants with respect to physicochemical properties suggests that both hydrophobic and steric effects play a role in degree of binding to serum albumins. As models are developed to predict transport of PFAS through the human body, these intrinsic physicochemical properties are extremely useful. Additional work must be completed in this area, especially for PFAS of different structures than those studied herein.
Supplementary Material
Highlights:
PFAS-albumin binding measured by fluorescence and equilibrium dialysis.
Analysis of fluorescence quenching models suggests cooperative PFAS binding.
PFAS hydrophobicity and size collectively describe trends in albumin association.
Fluorescence and dialysis differentiate specific and non-specific binding.
ACKNOWLEDGEMENTS
This work was funded by the National Institute of Environmental Health Science Sources, Transport, Exposure & Effects of PFASs (STEEP) Superfund Research Program under grant P42ES027706. STEEP is a partnership of the University of Rhode Island, the Harvard T.H. Chan School of Public Health, and the Silent Spring Institute.
Footnotes
Publisher's Disclaimer: This is a PDF file of an unedited manuscript that has been accepted for publication. As a service to our customers we are providing this early version of the manuscript. The manuscript will undergo copyediting, typesetting, and review of the resulting proof before it is published in its final form. Please note that during the production process errors may be discovered which could affect the content, and all legal disclaimers that apply to the journal pertain.
Declaration of interests
The authors declare that they have no known competing financial interests or personal relationships that could have appeared to influence the work reported in this paper.
REFERENCES
- Ahrens L, Bundschuh M, 2014. Fate and effects of poly- and perfluoroalkyl substances in the aquatic environment: A review. Environ. Toxicol. Chem 33, 1921–1929. [DOI] [PubMed] [Google Scholar]
- Allendorf F, Berger U, Goss KU, Ulrich N, 2019. Partition coefficients of four perfluoroalkyl acid alternatives between bovine serum albumin (BSA) and water in comparison to ten classical perfluoroalkyl acids. Environ. Sci. Process. Impacts 21, 1852–1863. [DOI] [PubMed] [Google Scholar]
- Bischel HN, MacManus-Spencer LA, Luthy RG, 2010. Noncovalent interactions of long-chain perfluoroalkyl acids with serum albumin. Environ. Sci. Technol 44, 5263–5269. [DOI] [PubMed] [Google Scholar]
- Bischel HN, Macmanus-Spencer LA, Zhang C, Luthy RG, 2011. Strong associations of short-chain perfluoroalkyl acids with serum albumin and investigation of binding mechanisms. Environ. Toxicol. Chem 30, 2423–2430. [DOI] [PubMed] [Google Scholar]
- Boston CM, Banacos N, Heiger-Bernays W, 2019. Per- and Polyfluoroalkyl Substances: A National Priority for Safe Drinking Water. Public Health Rep 134, 112–117. [DOI] [PMC free article] [PubMed] [Google Scholar]
- Cardenas A, Gold DR, Hauser R, Kleinman KP, Hivert MF, Calafat AM, Ye X, Webster TF, Horton ES, Oken E, 2017. Plasma concentrations of per- and polyfluoroalkyl substances at baseline and associations with glycemic indicators and diabetes incidence among high-risk adults in the diabetes prevention program trial. Environ. Health Perspect 125, 1–11. [DOI] [PMC free article] [PubMed] [Google Scholar]
- Chen H, He P, Rao H, Wang F, Liu H, Yao J, 2015. Systematic investigation of the toxic mechanism of PFOA and PFOS on bovine serum albumin by spectroscopic and molecular modeling. Chemosphere 129, 217–224. [DOI] [PubMed] [Google Scholar]
- Chen YM, Guo LH, 2009. Fluorescence study on site-specific binding of perfluoroalkyl acids to human serum albumin. Arch. Toxicol 83, 255–261. [DOI] [PubMed] [Google Scholar]
- Cheng W, Ng CA, 2018. Predicting Relative Protein Affinity of Novel Per- and Polyfluoroalkyl Substances (PFASs) by An Efficient Molecular Dynamics Approach. Environ. Sci. Technol 52, 7972–7980. [DOI] [PubMed] [Google Scholar]
- Dassuncao C, Hu XC, Nielsen F, Weihe P, Grandjean P, Sunderland EM, 2018. Shifting Global Exposures to Poly- and Perfluoroalkyl Substances (PFASs) Evident in Longitudinal Birth Cohorts from a Seafood-Consuming Population. Environ. Sci. Technol 52, 3738–3747. [DOI] [PMC free article] [PubMed] [Google Scholar]
- Domingo JL, Nadal M, 2017. Per- and polyfluoroalkyl substances (PFASs) in food and human dietary intake: A review of the recent scientific literature. J. Agric. Food Chem 65, 533–543. [DOI] [PubMed] [Google Scholar]
- Eftink MR, Ghiron CA, 1981. Fluorescence quenching studies with proteins. Anal. Biochem 114, 199–227. [DOI] [PubMed] [Google Scholar]
- Fedorenko M, Alesio J, Fedorenko A, Slitt A, Bothun GD, 2021. Dominant entropic binding of perfluoroalkyl substances (PFASs) to albumin protein revealed by 19F NMR. Chemosphere 263, 128083. [DOI] [PMC free article] [PubMed] [Google Scholar]
- Forsthuber M, Kaiser AM, Granitzer S, Hassl I, Hengstschläger M, Stangl H, Gundacker C, 2020. Albumin is the major carrier protein for PFOS, PFOA, PFHxS, PFNA and PFDA in human plasma. Environ. Int 137, 105324. [DOI] [PubMed] [Google Scholar]
- Gao K, Zhuang T, Liu X, Fu Jianjie, Zhang J, Fu Jie, Wang L, Zhang A, Liang Y, Song M, Jiang G, 2019. Prenatal Exposure to Per- and Polyfluoroalkyl Substances (PFASs) and Association between the Placental Transfer Efficiencies and Dissociation Constant of Serum Proteins-PFAS Complexes. Environ. Sci. Technol [DOI] [PubMed]
- Gitlin D, Klinenberg JR, Hughes WL, 1958. Site of Catabolism of Serum Albumin. Nature 181, 1064–1065. [DOI] [PubMed] [Google Scholar]
- Grandjean P, Budtz-Jørgensen E, 2013. Immunotoxicity of perfluorinated alkylates: Calculation of benchmark doses based on serum concentrations in children. Environ. Heal. A Glob. Access Sci. Source 12, 1–7. [DOI] [PMC free article] [PubMed] [Google Scholar]
- Hansch C, Klein TE, 1986. Molecular graphics and QSAR in the study of enzyme-ligand interactions. On the definition of bioreceptors. Acc. Chem. Res 19, 392–400. [Google Scholar]
- Hartman TJ, Calafat AM, Holmes AK, Marcus M, Northstone K, Flanders WD, Kato K, Taylor EV, 2017. Prenatal Exposure to Perfluoroalkyl Substances and Body Fatness in Girls. Child. Obes 13, 222–230. [DOI] [PMC free article] [PubMed] [Google Scholar]
- Hebert PC, Macmanus-spencer LA, 2010. Development of a Fluorescence Model for the Binding of Medium- to Long-Chain Perfluoroalkyl Acids to Human Serum Albumin Through a Mechanistic Evaluation of Spectroscopic Evidence 82, 6463–6471. [DOI] [PubMed] [Google Scholar]
- Hu XC, Andrews DQ, Lindstrom AB, Bruton TA, Schaider LA, Grandjean P, Lohmann R, Carignan CC, Blum A, Balan SA, Higgins CP, Sunderland EM, 2016. Detection of Poly- and Perfluoroalkyl Substances (PFASs) in U.S. Drinking Water Linked to Industrial Sites, Military Fire Training Areas, and Wastewater Treatment Plants. Environ. Sci. Technol. Lett 3, 344–350. [DOI] [PMC free article] [PubMed] [Google Scholar]
- Lakowicz JR, 2006. Principles of fluorescence spectroscopy, 3rd Edition, i Joseph R., editor, Principles of fluorescence spectroscopy, Springer, New York, USA, 3rd edn, 2006. [Google Scholar]
- Li L, Song GW, Xu ZS, 2010. Study on the interaction between bovine serum albumin and potassium perfluoro octane sulfonate. J. Dispers. Sci. Technol 31, 1547–1551. [Google Scholar]
- Liu Y, Cao Z, Zong W, Liu R, 2017. Interaction rule and mechanism of perfluoroalkyl sulfonates containing different carbon chains with human serum albumin. RSC Adv 7, 24781–24788. [Google Scholar]
- Macmanus-spencer L. a, Tse ML, Hebert PC, Bischel HN, Luthy RG, 2010. Binding of Perfluorocarboxylates to Serum Albumin : A Comparison of Analytical Methods quantitative information about PFCA - albumin interac-. Anal. Chem 82, 974–981. [DOI] [PubMed] [Google Scholar]
- MacManus-Spencer LA, Tse ML, Hebert PC, Bischel HN, Luthy RG, 2010. Binding of perfluorocarboxylates to serum albumin: A comparison of analytical methods. Anal. Chem 82, 974–981. [DOI] [PubMed] [Google Scholar]
- Ng CA, Hungerbühler K, 2014. Bioaccumulation of perfluorinated alkyl acids: Observations and models. Environ. Sci. Technol [DOI] [PubMed]
- Qin P, Liu R, Pan X, Fang X, Mou Y, 2010. Impact of carbon chain length on binding of perfluoroalkyl acids to bovine serum albumin determined by spectroscopic methods. J. Agric. Food Chem 58, 5561–5567. [DOI] [PubMed] [Google Scholar]
- Ross I, McDonough J, Miles J, Storch P, Thelakkat Kochunarayanan P, Kalve E, Hurst J, Dasgupta S, S., Burdick J, 2018. A review of emerging technologies for remediation of PFASs. Remediation 28, 101–126. [Google Scholar]
- Salvalaglio M, Muscionico I, Cavallotti C, 2010. Determination of energies and sites of binding of PFOA and PFOS to human serum albumin. J. Phys. Chem. B 114, 14860–14874. [DOI] [PubMed] [Google Scholar]
- Steinhardt J, Krijn J, Leidy JG, 1971. Differences between bovine and human serum albumins. Binding isotherms, optical rotatory dispersion, viscosity, hydrogen ion titration, and fluorescence effects. Biochemistry 10, 4005–4015. [DOI] [PubMed] [Google Scholar]
- Vivian JT, Callis PR, 2001. Mechanisms of tryptophan fluorescence shifts in proteins. Biophys. J 80, 2093–2109. [DOI] [PMC free article] [PubMed] [Google Scholar]
- Waters NJ, Jones R, Williams G, Sohal B, 2008. Validation of a rapid equilibrium dialysis approach for the measurement of plasma protein binding. J. Pharm. Sci 97, 4586–4595. [DOI] [PubMed] [Google Scholar]
- Wu L-L, Gao H-W, Gao N-Y, Chen F-F, Chen L, 2009. Interaction of perfluorooctanoic acid with human serum albumin. BMC Struct. Biol 9, 31. [DOI] [PMC free article] [PubMed] [Google Scholar]
- Xiao F, Sasi PC, Yao B, Kubátová A, Golovko SA, Golovko MY, Soli D, 2020. Thermal Stability and Decomposition of Perfluoroalkyl Substances on Spent Granular Activated Carbon. Environ. Sci. Technol. Lett 7, 343–350. [Google Scholar]
Associated Data
This section collects any data citations, data availability statements, or supplementary materials included in this article.


