

Abstract
Mast cells are important effector cells in the immune system and undergo activation (i.e. degranulation) by two major mechanisms: IgE mediated and non-IgE mediated. While IgE mediated degranulation is well researched, the cellular mechanisms of non-IgE mediated mast cell activation are poorly understood despite the potential to induce similar pathophysiological effects. To better understand non-IgE mast cell degranulation, we characterized and compared cellular metabolic shifts across several mechanisms of degranulation (allergen-induced [IgE mediated], 20 nm silver nanoparticle mediated [non-IgE], and compound 48/80 mediated [non-IgE]) in murine bone marrow-derived mast cells (BMMCs). All treatments differentially impacted mitochondrial activity and glucose uptake, suggesting diverging metabolic pathways between IgE and non-IgE mediated degranulation. Non-IgE treatments depleted mast cells’ glycolytic reserve and compound 48/80 further inhibited the ability to maximize mitochondrial respiration. This cellular reprogramming may be indicative of a stress response with non-IgE treatments. Neither of these outcomes occurred with IgE mediated degranulation, hinting at a separate programmed response. Fuel flexibility between the three primary mitochondrial nutrient sources was also eliminated in activated cells and this was most significant in non-IgE mediated degranulation. Lastly, metabolomics analysis of BMMCs following degranulation was used to compare general metabolite profiles related to energetic pathways. IgE mediated degranulation upregulated metabolite concentrations for the TCA cycle and glycolysis compared to other treatments. In conclusion, mast cell metabolism varies significantly between IgE and non-IgE mediated degranulation suggesting novel cell regulatory mechanisms are potentially driving unexplored pathways of mast cell degranulation.
Keywords: Allergy, Seahorse, silver nanoparticle, compound 48/80, glycolysis, mitochondria, metabolism, metabolomics
INTRODUCTION
Mast cells are innate immune effector cells largely recognized for their role in type 1 hypersensitivity reactions. These reactions are commonly mediated through allergen crosslinking of IgE antibody bound to the high affinity IgE receptor (FcεR1) leading to allergy-related pathologies such as asthma and anaphylaxis (1–4). Following crosslinking of FcεR1 by allergen, mast cells undergo rapid degranulation resulting in immediate release of pre-formed inflammatory mediators such as histamine, proteases, and cytokines leading to local and systemic effects. For example, histamine released from mast cells affects pulmonary smooth muscle contraction and proliferation contributing to asthma (5). It also promotes vascular permeability thereby aiding in extravasation of other immune cells to the site of injury (6, 7). Consequences of mast cell degranulation are well documented to affect the pulmonary, cardiovascular, and nervous systems among others (8–11). Therefore, any inappropriate activation of mast cells has the potential to disrupt immune system homeostasis and induce or exacerbate pathophysiological outcomes beyond allergy-related disease.
The mechanism of mast cell degranulation induced via FcεR1 (IgE mediated pathway) is well described; however, less is known regarding mechanisms of non-IgE mediated degranulation of mast cells despite potential for similar physiological outcomes. In addition to FcεR1, mast cells express numerous receptors, such as pattern recognition receptors (e.g. TLRs), G-protein coupled receptors (e.g. C3aR, C5aR) and alarmin receptors (e.g. ST2) that allow quick response to a wide range of exogenous insults and endogenous signals (12). These receptors induce non-IgE mediated activation from foreign pathogens, endogenous peptides, and pharmaceuticals (allergic drug reactions) (12–14). Inappropriate activation through non-IgE pathways also contributes to mast cell activation syndromes (MCAS) (15). People suffering from this class of disorders undergo idiopathic mast cell degranulation leading to symptoms that include urticaria, difficulty breathing, and low blood pressure. These symptoms not only negatively impact quality of life, but they may also progress into more dangerous pathologies if unwarranted mast cell activation is not controlled. MCAS is idiopathic and symptoms mirror other diseases which makes it difficult to diagnose. Further, treatments for MCAS only deal with symptoms of acute episodes and not mechanisms leading to chronic issues, which only provide temporary relief for patients. To identify appropriate strategies for therapeutically treating individuals with MCAS, it is critical to understand the different mechanisms of mast cell activation (e.g. IgE vs. non-IgE mast cell activation). To investigate novel mechanisms of IgE vs non-IgE mast cell activation, we analyzed a core facet of cellular activation and function: cellular energy metabolism.
Previous research has demonstrated that IgE-mediated mast cell degranulation utilizes ATP and induces glycolysis, as indicated by increased lactic acid release (16, 17). Beyond this, little is known about cellular metabolic requirements for mast cell degranulation. All immune cells depend on glycolysis and mitochondrial respiration to generate ATP, particularly during activation, yet metabolic pathway preference differs by cell type. For example, activated neutrophils and dendritic cells strongly rely on glycolytic energy yield, whereas B cells demonstrate higher utilization from mitochondrial respiration (18–20). Glycolysis produces significantly less ATP per glucose molecule than does oxidative phosphorylation (2 ATP vs. 32 ATP) (21), yet there are some clear advantages to upregulating the glycolytic pathway. For one, glycolysis can metabolize many glucose molecules at once, producing short bursts of large amounts of ATP that respiration cannot. Also, respiration requires oxygen and glycolysis is anaerobic, thereby allowing utilization in more situations. Glycolysis also replenishes essential intermediates for fatty acid, specific amino acid, and ribose synthesis. The glycolytic pathway, and alternative glucose pathways such as pentose-phosphate pathway, also replenish the NADH pool and provide DNA precursors for proliferation (22, 23). These differences represent cellular metabolic pathway preference and shifts between them can provide important information on cell function and activation.
To investigate the importance of metabolic shifts in mast cells during degranulation, we compared IgE-mediated mast cell degranulation to two non-IgE triggers of degranulation: silver nanoparticles (AgNP) and compound 48/80. We have previously reported that 20 nm AgNP induce robust degranulation in bone-marrow derived mast cells (BMMCs) through a yet unrecognized non-IgE pathway (24, 25). Further, in vivo models have demonstrated that exposure to AgNP can induce and exacerbate mast-cell mediated pathologies such as atopic dermatitis (26). Importantly, AgNPs are being incorporated into many consumer and biomedical products thereby leading to increased human exposure to these materials (27). Compound 48/80 is an exogenous compound formed as a condensation product of N-methyl p-methoxyphenethylamine and formaldehyde which induces degranulation through activation of the Mas-related G protein coupled receptor (Mrgpr) (28). Mrgpr has been established as an important non-IgE receptor which responds to several drugs known to commonly cause allergic response, such as anesthetics (13, 14, 29). By utilizing compound 48/80, we can begin to establish a mechanism that can potentially be applicable to many other activating sources that associate with this receptor. To the best of our knowledge, characterization of basic metabolic function in response to IgE and non-IgE mediated degranulation has not been performed on BMMCs.
MATERIALS AND METHODS
Cell culture
Bone marrow derived mast cells (BMMCs) were derived from hematopoietic progenitor cells from femurs of C57BL/6J mice (Jackson Laboratories). Cells were pooled from femurs of two mice into one T75 cell culture flask and cultured for 4–6 weeks at 37°C and 5% CO2 in supplemented media containing IL-3 for mast cell differentiation. RPMI 1640 media (Corning Inc., Corning, NY) was supplemented with the following ingredients: 10% heat inactivated fetal bovine serum, 2 mM L-glutamine, 1 mM sodium pyruvate, 10 mM HEPES buffer, MEM nonessential amino acids (Corning Inc., Corning, NY), 100 U/mL penicillin, 100 μg/mL streptomycin, 50 μg/mL primomycin (Invitrogen, San Diego, CA), 0.000325% 2-mercaptoethanol, and 30 ng/mL recombinant mouse IL-3 (BioLegends, San Diego, CA). Maturity of BMMCs was confirmed between 4–6 weeks by measuring levels of surface receptors c-kit and FcεR1 via flow cytometry (BD Accuri, San Jose, CA) (Supplemental Figure 1A). Each biological replicate consists of a single flask of cells isolated from the femurs of two separate mice and combined. Therefore, each statistical N is a flask containing cells from two mice.
Silver nanoparticles
20 nm silver nanoparticles (AgNP) were purchased from nanoComposix (San Diego, CA) and characterized using dynamic light scattering (DLS) (Malvern Instruments, Malvern, Worchestershire, United Kingdom). Both the hydrodynamic size and zeta potential of the particles were analyzed. Measurements were done in triplicate in ddH2O, complete cell culture media, or HEPES biological buffer used in degranulation assays. Nanoparticle characterization was performed at a concentration of 10 μg/mL. A representative image of 20nm AgNPs taken by transmission electron microscopy (TEM) is included in Supplemental Figure 1B. AgNP sizing and zeta potential data is presented in Supplemental Figure 1C.
Treatments
Final concentration of treatments for all Seahorse XF, functional assays, and metabolomics analysis was 25 μg/mL for the 20nm AgNP, 50 μg/mL for compound 48/80 (SigmaAldrich, St. Louis, MO), or 100 ng/mL DNP-HSA (SigmaAldrich, St. Louis, MO) to a subset of BMMCs sensitized with 100 ng/mL anti-DNP IgE (SigmaAldrich, St. Louis, MO) for a minimum of one hour to induce IgE mediated degranulation. These concentrations have been identified to elicit the most robust mast cell response (measured by β-hexosaminidase release) with minimal toxicity (Supplement Figure 2) (30, 31).
Cytotoxicity
BMMCs were seeded at a concentration of 1×10⁶ cells/well in a 48-well plate and then exposed to treatments for 1 and 24 hrs. 10 mM hydrogen peroxide was used as a positive control. BMMCs were kept on ice and washed once with cold PBS and once with cold Stain Buffer (BD Pharmingen, San Jose, CA) before 15 min incubation with Propidium Iodide (Invitrogen, San Diego, CA) and Annexin V antibody (BD Pharmingen, San Jose, CA). Signal was read on BD Accuri flow cytometer at emissions of 575nm and 660 nm.
Degranulation
Mature BMMCs were plated at 6×10⁴ cells/well in a flat bottom 96-well plate (Thermo Fisher Scientific, Rochester, NY) in biological HEPES buffer containing 10 mM HEPES, 137 mM NaCl, 2.7 mM KCl, 0.4 mM Na2HPO47H2O, 5.6 mM glucose, 1.8 CaCl22H2O, and 1.3 mM MgSO47H2O. Following 1 h of treatments as described above, supernatant and lysed cell homogenate were separated and incubated for 90 min at 37°C with p-nitrophenyl-N-acetyl-β-d-glucopyranoside (PNAG), a substrate for N-acetyl-β-D-hexosaminidase (β-hexosaminidase). After incubation, signal from wells was read at 405nm using a 96 well plate reader (BioTek Instruments Inc., Winooski, VT). Total β-hexosaminidase was calculated as percent total cell content release after subtracting background interference from treatments alone. All pre-treatments in degranulation assays (Figure 2) were run concurrently with the same biological replicate using technical triplicates. These experiments were then repeated for every biological N that was included. Experiments were performed in triplicate and repeated at least three times with separate biological replicates. A biological replicate is a flask with pooled cells isolated from both femurs collected from two mice.
Fig 2:

Characterization of metabolic pathway functionality in BMMCs. Several metabolic function measurements after 1 h exposure to allergen, AgNP, or cmd 48/80: A) mitochondrial depolarization; B) WST-1; C) glucose uptake. One-way ANOVA. n=3–6. *signifies statistically significant (p<0.05) difference from control. †signifies statistically significant (p<0.05) difference from IgE/DNP. ‡signifies statistically significant (p<0.05) difference from AgNP. Each n consists of a flask of BMMCs pooled together from two individual mice.
Seahorse XF
Analysis of oxygen consumption rate (OCR) and extracellular acidification rate (ECAR), indicators of mitochondrial aerobic respiration and glycolytic activity respectively, were measured using the Seahorse XFe96 system (Agilent Technologies, Santa Clara, CA). BMMCs were seeded at 2×10⁵ cells/well. Cells were attached to the bottom of wells using 3.5 μg/cm2 CellTak (Corning Inc., Corning, NY) allowing data normalization by cell number. The XF cartridge was hydrated in ddH2O overnight at 37°C in non-CO2 containing incubator. Cells and treatments were done in Seahorse media supplemented similarly to BMMC cell media depending on assay performed (2 g/L glucose, 1mM sodium pyruvate, 2mM L-glutamine).
Acute injections were performed at set time periods according to manufacturer’s protocol. Port A injection exposed the cells to treatments as described above at a 10X concentration, resulting in the desired final well concentrations. Port B-D were different for each test that was performed as specified below. These ports also contained solutions at 10X concentration that were diluted in wells and resulted in the final concentrations described below.
Cell Energy Phenotype test only utilized port B which contained a mixture that resulted in a final well concentration of 3 μM FCCP (mitochondrial membrane depolarizer)/ 1 μM Oligomycin (ATP-Synthase inhibitor). Data is presented as % Control, with control set at 100%.
Cell Mitochondrial Stress test (acute injection) followed port A treatment injection (ACUTE) with port B injecting final well concentration of 1μM oligomycin (OLIGO), port C injecting final concentration 3 μM FCCP (FCCP), and port D injecting final concentration mixture of 0.5 μM rotenone (complex 1 inhibitor) and 0.5 μM antimycin A (complex 3 inhibitor) (ROT/AA). The basal mitochondrial respiration level is measured right after ACUTE treatment. After this was measured, we set individual basal respiration levels to 100% and all analysis was subsequently compared to basal OCR and presented as OCR (% Basal). Differences in non-mitochondrial oxygen consumption are factored into calculations for all parameters. All data presented for this assay is measured and presented as percent of basal oxygen consumption rate: OCR (% Basal).
Glycolysis Stress test (acute injection) followed port A treatment injection (ACUTE) with port B injecting final well concentration 10 mM glucose (GLU), port C injecting final concentration 1 μM oligomycin (OLIGO), and port D injecting final concentration 50 mM 2-deoxyglucose (hexokinase inhibitor) (2-DG). Media for this test does not contain glucose or sodium pyruvate. We took basal ECAR levels post-glucose injection (GLU timepoint) and set them to 100% in order to calculate changes as ECAR (% Basal). All data presented for this assay is measured and presented as percent of basal extracellular acidification rate: ECAR (% Basal).
The Mitochondrial Fuel Flexibility Stress test utilized sequential injections of metabolic fuel pathway inhibitors to test fuel flexibility. Final well concentration of inhibitors were 2 μM UK5099 (inhibitor of the glucose oxidation pathways), 4 μM Etomoxir (inhibitor of long chain fatty acid oxidation), and 3 μM BPTES (inhibitor of glutamine oxidation). For each nutrient, dependence was calculated by dosing cells with inhibitor of nutrient of interest in port B followed by mixture of other two inhibitors in port C. This will demonstrate the cell’s reliance on specific fuel source to maintain respiration. Capacity was calculated by dosing inhibitors in reverse: inhibit oxidation of two nutrients in port B and then inhibit nutrient of interest in port C. This demonstrates ability of cell to upregulate one specific fuel source when the other two are inhibited. Fuel flexibility is the difference of dependence and capacity and describes the cell’s ability to increase oxidation of a specific nutrient source to compensate for inhibition of the other two.
Mitochondrial membrane potential
Cells were seeded at 1×10⁶ cells/well in a 48-well plate (Thermo Fisher Scientific, Rochester, NY) and treated, as described above, for 1 h. Cells were collected and washed once each with phosphate-buffered saline (PBS) and Stain Buffer (BD Pharmingen, San Jose, CA). Cells were then incubated in either Stain Buffer (BD Pharmingen, San Jose, CA) containing no antibody (no stain control) or containing 10 μg/mL JC-1 (Thermo Fisher Scientific, Rochester, NY) for 30 min. After incubation, signal was read on a BD Accuri flow cytometer at emissions of 525 nm and 590 nm. JC-1 is a monomer the emits green fluorescence at ~525 nm that aggregates and shifts emission to red fluorescence at ~590 nm when it accumulates in the mitochondria based on potential. Mitochondrial membrane depolarization was calculated as the ratio of 590 (red, aggregate) signal to 525 (green, monomer) signal, with a decrease in this ratio indicating depolarization.
Mitochondrial activity assays
For WST-1 assays, BMMCs were plated at a concentration of 4×10⁴ cells/well in a 96 well plate. BMMCs were treated for 1 h and then 10 uL WST-1 dye (1:10 dilution) was added to media in wells. BMMCs were incubated in the dark for 1 h at room temperature before signal was read on 96 well plate reader (BioTek) at a wavelength of 450nm. Signal was normalized by subtracting signal of media and treatments without WST-1 dye.
Glucose uptake quantification
BMMCs were seeded at a concentration of 1×10⁶ cells/well in a 48-well plate. Treatments were given simultaneously with 100 μM 2-NBDG (Cayman Chemical, Ann Arbor, MI) for 1 h. This dye will irreversibly bind to hexokinase enzyme associated with glucose uptake. BMMCs were kept on ice and washed once with each cold PBS and cold Stain Buffer (BD Pharmingen, San Jose, CA) before being read at a wavelength of 450nm on a BD Accuri flow cytometer.
RNA isolation and qPCR
Mature BMMCs were plated at 1×10⁶ cells/well and treated as described above. Following treatments, total RNA from BMMCs was isolated using TRIzol reagent (Sigma Aldrich, St. Louis, MO). RNA was then purified utilizing a Direct-zol RNA miniprep kit (Zymo Research, Irvine, CA) according to manufacturer’s protocol. RNA quality and quantity was measured using a NanoDrop 2000 (Thermo Fisher Scientific, Rochester, NY) and converted through reverse transcription to cDNA using iScript cDNA Synthesis kit (Bio-Red, Hercules, CA) and a thermocycler (Eppendorf, Enfield, CT). cDNA was mixed with SYBR Green Supermix (Bio-Rad, Hercules, CA) and PrimePCR primer for Mrgprb2 (Bio-Rad, Hercules, CA). Real time PCR was performed in triplicate utilizing real time PCR cycler Applied Biosystems StepOnePlus (Thermo Fisher Scientific, Rochester, NY). Gene expression of Mrgprb2 and housekeeping gene (GAPDH) was measured and displayed as cycle threshold (CT).
Metabolomics
Metabolomics were performed after 1 h of treatments as described in (32). Heat maps and PCA graphs were created using MetaboAnalyst 4.0 (33). Statistical analysis was performed using one-way ANOVA with significance determined by a p-value<0.05.
Statistical analysis
Statistical comparisons were done using a one-way ANOVA or two-way ANOVA (clarified in figure legends) and significance determined by p<0.05. All experiments were run in triplicate and repeated a minimum of three times. A biological replicate was considered a flask of cells isolated from the femurs of two mice and pooled together. Two mice pooled together into one flask was considered N=1.
RESULTS
Blocking metabolic pathways inhibits non-IgE mast cell degranulation
IgE and non-IgE mediated degranulation of bone marrow derived mast cells (BMMC) was first confirmed using an allergen (dinitrophenol, DNP) (IgE-mediated), 20 nm silver nanoparticles (AgNP) (non-IgE mediated), or compound 48/80 (non-IgE mediated). Both IgE and non-IgE treatments led to minimal cytotoxicity (Supplemental Fig 2) and induced robust degranulation of BMMCs at 1 hr following treatment (Fig 1A). IgE mediated degranulation (anti-DNP IgE sensitized BMMCs followed by challenge with DNP) resulted in 31.4±0.5% β-hexosaminidase (β-hex) release. Non-IgE mediated BMMC degranulation induced by exposure to AgNP (25 μg/mL) resulted in 60.8±5.7% β-hex release while treatment with 50 μg/mL compound 48/80 resulted in 21.5±2.5% β-hex release. Compound 48/80 induced mast cell degranulation is reported to occur via the Mas-related G-protein coupled receptor (Mrgprb2) (28). To confirm expression of Mrgprb2, we measured mRNA expression and confirmed that Mrgprb2 expression was comparable to GAPDH (housekeeping gene) indicating presence of the receptor in mature BMMCs (Supplemental Figure 1D). All treatments resulted in statistically significantly higher β-hex release from BMMCs than untreated cells (5.1±0.6%).
Fig 1:
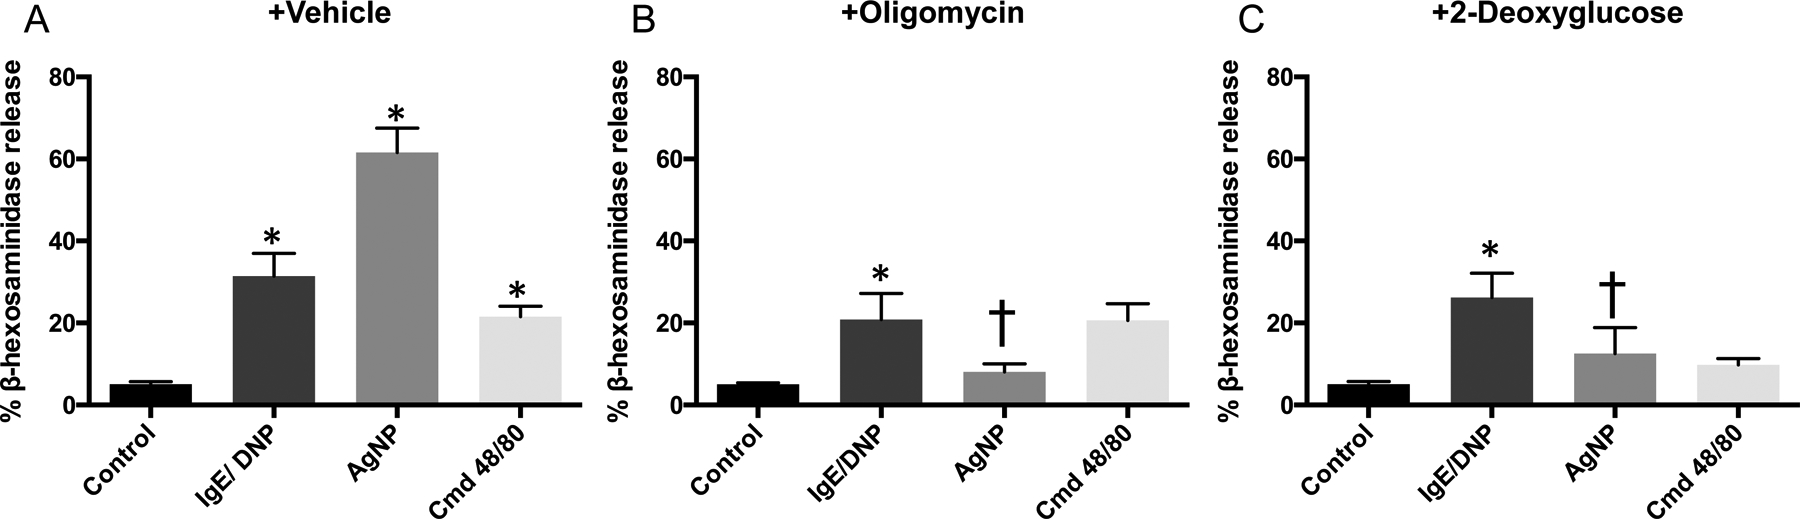
Mast cell degranulation measured by release of β-hexosaminidase after pre-treatment with metabolic pathway inhibitors. BMMCs were pre-treated with A) HEPES as vehicle control; B) oligomycin (OM) to inhibit respiration; or C) 2-deoxyglucose (2-DG) to inhibit glycolysis for 15 m before 1 h exposure to allergen, AgNP, or cmd 48/80. Two-way ANOVA (n=3–6). *signifies statistically significant (p<0.05) difference from control. †signifies statistically significant (p<0.05) difference from corresponding no pre-treatment group. Each n consists of a flask pooled together from two individual mice.
Second, we determined whether blocking specific metabolic energy production pathways (mitochondrial respiration or glycolysis) would impair IgE or non-IgE BMMC degranulation. When BMMCs were pre-treated with 1 μM oligomycin (OM) for 15 m, an ATP synthase inhibitor that will block mitochondrial ATP production, there was a significant decrease in β-hex release from AgNP treated BMMCs (Fig 1B). In contrast, OM did not significantly inhibit IgE- or compound 48/80-mediated β-hex release from BMMCs. Inhibition of glycolytic function by pretreatment of BMMCs with 50 mM 2-deoxyglucose (2-DG) for 15 m, a competitive inhibitor of glucose uptake that irreversibly binds to hexokinases associated with GLUT receptors to prevent glucose binding and metabolism, significantly inhibited non-IgE degranulation by AgNPs while having little effect on IgE mediated degranulation (Fig 1C). Both inhibitors at these concentrations and timepoint caused insignificant cytotoxicity compared to control (Supplemental Fig 2). 2-DG resulted in a reduction of β-hex release from compound 48/80 treated BMMCs but was not statistically significant. Overall, non-IgE mediated BMMC degranulation was more affected by modulating metabolic pathways than IgE mediated degranulation.
Non-IgE treatment results in mitochondrial membrane depolarization and increased glucose uptake.
We utilized the JC-1 dye to explore how treatments affected mitochondrial function and health by quantifying mitochondrial membrane depolarization. Compound 48/80 induced a significant decrease in mitochondrial membrane potential (depolarization) compared to control (Fig 2A). IgE-mediated activation resulted in a non-significant trend toward hyperpolarization and AgNP-mediated degranulation had no effect on mitochondrial membrane potential. We further analyzed mitochondrial results by utilizing WST-1, which quantitates NAD(P)H-dependent mitochondrial activity. All three treatments displayed a non-significant trend of increased WST-1 signal compared to basal BMMCs. Similar to mitochondrial membrane depolarization, allergen treatment had the largest increase in signal (169.9±26.3% of control), followed by AgNP at 123.6±13.1%, and compound 48/80 at 121.2±8.4% (Fig 2B).
After observing varying mitochondrial function following IgE and non-IgE activation, we briefly explored glucose uptake utilizing 2-NBDG, a fluorescently tagged 2-DG compound. Compound 48/80 induced a statistically significant increase in glucose uptake with a 1.24±0.06-fold change from control (Fig 2C). IgE-mediated and AgNP-mediated mast cell degranulation did not cause a significant change in glucose uptake (Fig 2C). We then turned to Seahorse technology to further explore in more detail the varying metabolic functionality between treatments.
Mitochondrial aerobic respiration is affected by non-IgE treatment
The mitochondrial stress test that measures OCR in response to stressors is shown in Fig 3A. The tracers show similar activity between control, allergen, and AgNP while only compound 48/80 induced a significant change in respiration. Compound 48/80 lowered OCR from treatment only (after ACUTE timepoint) and blocked maximal respiration after the FCCP timepoint. The OCR readings after stressors were further analyzed to identify specific parameter differences between treatments.
Fig 3:

Results of Seahorse XF Cell Mito stress test in C57Bl/6 BMMCs. Data is presented as percent of basal OCR (oxygen consumption rate) reading taken before the treatment injection. A) Tracer of OCR results in response to allergen, AgNP, or cmd 48/80 and stressors. Parameters calculated from the tracers follow: B) non-mitochondrial oxygen consumption, C) basal respiration, D) acute response, E) maximal respiration, F) spare respiratory capacity, G) ATP production. One-way ANOVA. n=4–5. *signifies statistically significant (p<0.05) difference from control. †signifies statistically significant (p<0.05) difference from IgE/DNP. ‡signifies statistically significant (p<0.05) difference from AgNP. Each n consists of a flask of BMMCs pooled together from two individual mice.
We first analyzed non-mitochondrial oxygen consumption which could indicate upregulation of oxidase enzymatic activity (Fig 3B). Control BMMCs displayed a non-mitochondrial dependent oxygen consumption of 22.2±3.5% and all treatments trended towards an increased reading. Compound 48/80 increased non-mitochondrial oxygen consumption the greatest (40.1±9.4%) as compared to the other treatments. However, none of these increases were statistically significant. There were also no significant differences between treatments for basal respiration levels (Fig 3C). We then analyzed acute effect of treatments on OCR, where only compound 48/80 significantly lowered OCR (−36.41±11.45% compared to control at 2.8±3.7%) (Fig 3D).
We further explored how treatments affect the cells’ ability to maximize mitochondrial respiration experimentally by uncoupling the mitochondria with FCCP. Basal cells retained the ability to maximize their respiration most with a maximal OCR of 374.0±38.3% of basal respiration (Fig 3E). IgE-mediated and AgNP-mediated degranulation did not greatly change this parameter while compound 48/80 significantly dampened maximal respiration in BMMCs to 143.7±54.6% (Fig 3E). Further, if we take this maximal respiration and subtract each treatment’s basal respiration, we can calculate the cell’s spare respiratory capacity. Once again, control BMMCs retained a substantial reserve at 298.7±35.5% while compound 48/80 significantly dropped spare respiratory capacity to 85.2±55.6%. There was no significant effect on spare respiratory capacity due to allergen or AgNP treatments (Fig 3F). ATP production solely from mitochondrial respiration can also be calculated from these readings. All treatments resulted in a trend of decreased ATP production compared to control (63.9±4.7%) with compound 48/80-mediated degranulation decrease being statistically significant (34.1±6.3%) (Fig 3G).
Glycolytic function is significantly blunted during non-IgE mast cell degranulation
The Seahorse XF Glycolysis Stress test utilizes ECAR measurements after stressors that modulate facets of the glycolytic pathway. Tracers in Figure 4A show that compound 48/80 had the largest effect after the ACUTE timepoint, while both non-IgE activators had a profound effect on maximal glycolytic function after the OLIGO timepoint. There appeared to be negligible changes between control and allergen mediated degranulation which matches OCR analysis. We were able to calculate several parameters from the tracers.
Fig 4:

Results of Seahorse XF Glycolysis stress test in C57Bl/6 BMMCs. Data is presented as percent of basal ECAR (extracellular acidification rate) reading taken after glucose injection. A) Tracer of results in response to allergen, AgNP, or cmd 48/80 and parameters calculated from the tracers: B) glycolysis, C) acute response, D) non-glycolytic acidification rate, E) glycolytic capacity, F) glycolytic reserve %. One-way ANOVA. n=3–5. *signifies statistically significant (p<0.05) difference from control. †signifies statistically significant (p<0.05) difference from IgE/DNP. Each n consists of a flask pooled together from two individual mice.
We first looked at glycolysis, which can be calculated by changes in ECAR after the GLU timepoint. Interestingly, there were minimal changes between all treatments. Control BMMCs and those treated with compound 48/80 performed glycolysis similarly at 66.8±1.3% and 62.8±0.7%, respectively, while the other treatments had no significant changes in ECAR (Fig 4B). We analyzed the acute effect of ECAR solely from treatments and observed a trend of increased ECAR with non-IgE degranulation that was not significant (Fig 4C). We explored non-glycolytic acidification to probe for any non-specific sources of ECAR changes. There were no differences between control and treatments (Fig 4D).
The most significant difference between treatments occurred when we experimentally maximized glycolytic function at the OLIGO timepoint. As is evident in the tracers, there was a drastic reduction of glycolytic ability with non-IgE treatments. Control and IgE-mediated degranulation demonstrate a glycolytic capacity of 145.0±2.8% and 135.4±23.1%, respectively, while glycolytic capacity was significantly diminished during AgNP-mediated degranulation (66.2±13.6%) and compound 48/80-mediated degranulation (57.1±9.5%) (Fig 4E). These decreases were statistically significantly from both control and allergen-mediated degranulation. Glycolytic reserve, which is the difference between glycolytic capacity and basal level of glycolysis, demonstrates the cells’ ability to maximize glycolysis beyond the level of glycolysis already performed. This parameter also demonstrated inhibition with non-IgE treatments. Allergen treatment had no effect compared to control while AgNP and compound 48/80 treatments significantly reduced glycolytic reserves (−7.6±13.2% and −5.6±9.6% respectively) (Fig 4F).
Mast cell activation eliminates fuel flexibility between mitochondrial respiration nutrients
The Seahorse XF fuel flexibility stress test utilizes combinations of inhibitors that block metabolism of nutrients necessary for mitochondrial respiration (glucose, long chain fatty acids, and glutamine). By dosing cells with different combinations of nutrient pathway inhibitors after treatments, we can explore how the mast cells’ ability to switch between fuel sources is compromised during degranulation. In Figure 5A, we explored glucose oxidation dependence and capacity. While basal mast cells have minimal dependence on glucose (−4.1±35.6%), this significantly increases after cells are treated with AgNP (139.4±13.6). Comparably, AgNP treatment also significantly decreases the mast cells’ capacity to upregulate glucose oxidation compared to control (−23.9±6.5% compared to control at 49.7±20.9). All activated mast cells followed this trend of increased glucose dependence and decreased capacity, but only AgNP treatment was statistically significant from basal mast cells.
Fig 5:
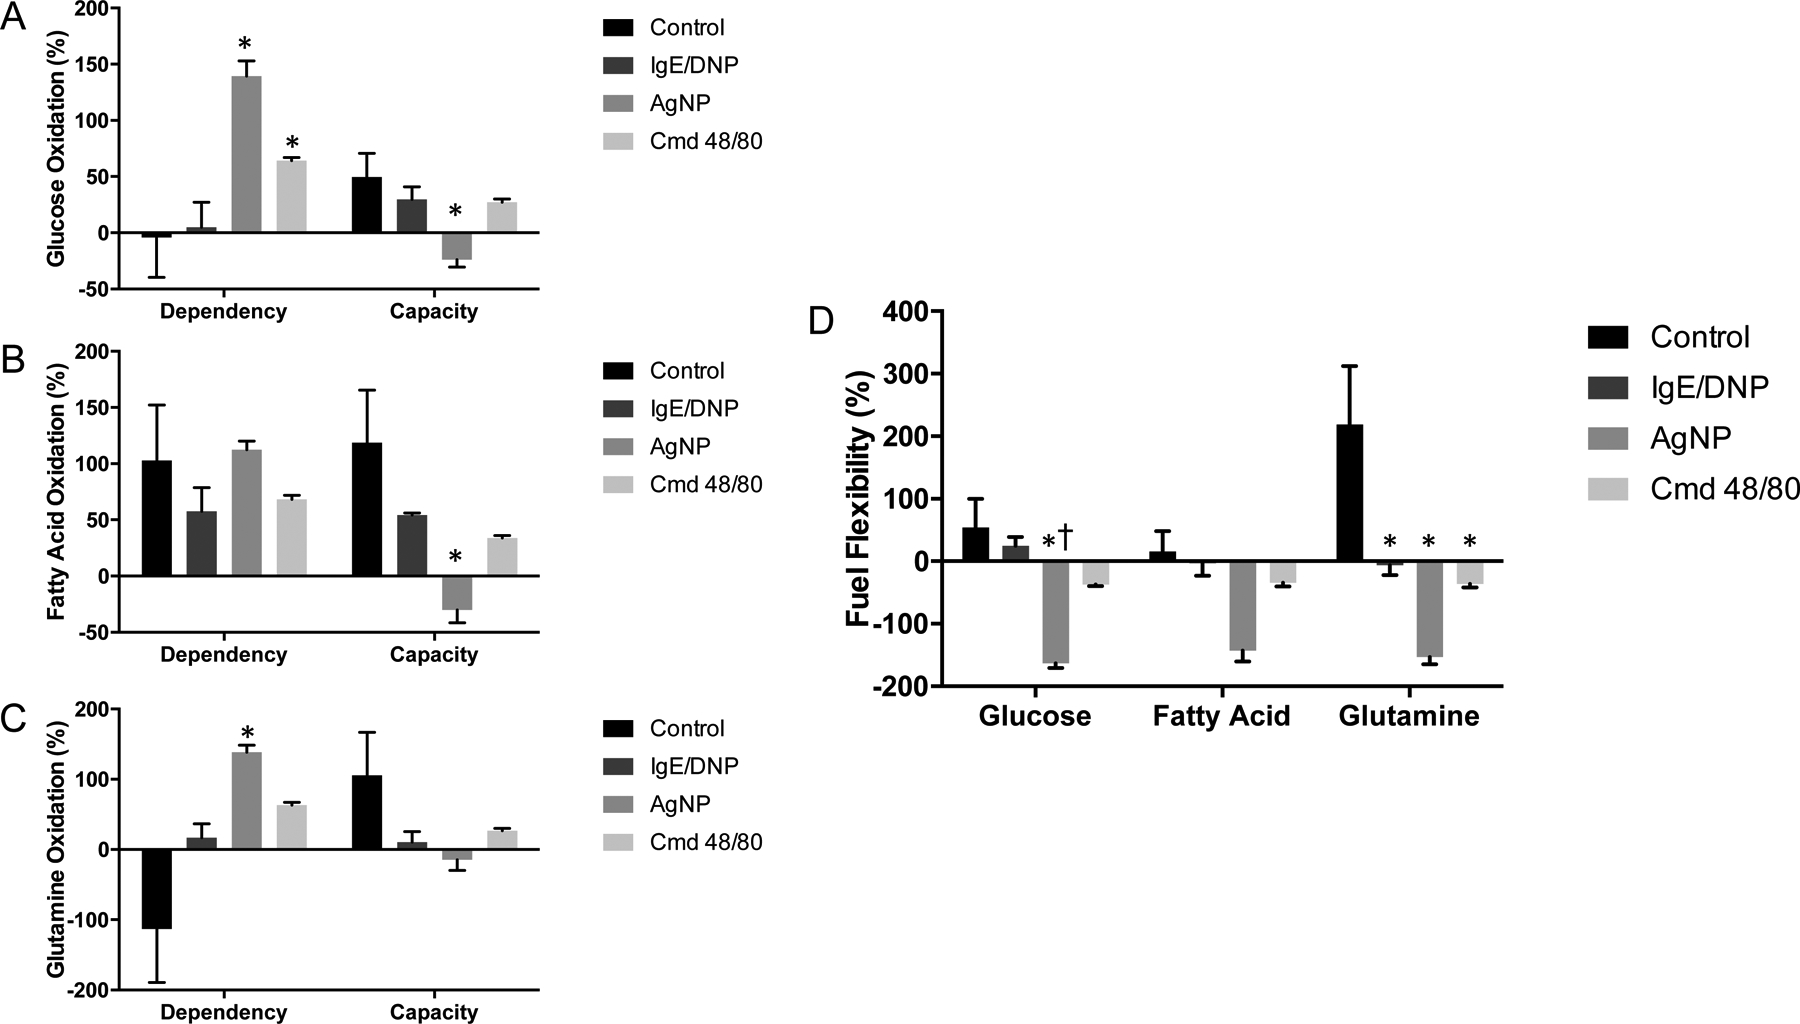
Results of Seahorse XF Fuel Flex stress test in C57Bl/6 BMMCs. Data is presented as percent baseline (OCR) readings taken before exposure to allergen, AgNP, or cmd 48/80. A) Glucose dependency and capacity, B) Fatty acid oxidation dependency and capacity, C) Glutamine oxidation dependency and capacity, D) Fuel flexibility for all three nutrients. One-way ANOVA. n=3. *signifies statistically significant (p<0.05) difference from control. †signifies statistically significant (p<0.05) difference from IgE/DNP. Each n consists of a flask pooled together from two individual mice.
Next, we analyzed fatty acid oxidation as shown in Figure 5B. There were no differences in nutrient dependence between basal mast cells and activated mast cells. There was a trend of decreased capacity with activated mast cells, similar to glucose oxidation, with AgNP-mediated degranulation significantly lowering capacity to −30.1±11.4% (compared to control at 118.7±46.9%). The last nutrient we tested was glutamine as shown in Figure 5C. Basal level of dependence for this nutrient was very low and variable (−113.3±75.81%) and capacity is high (105.5±61.3%). However, activated cells led to a trend of increased dependence and lowered capacity. Once again, AgNP treatment significantly increased dependence over control to an oxidation of 138.4±9.9% and decreased capacity more than other treatments to a non-significant level.
By combining dependence and capacity, we can calculate fuel flexibility (Fig 5D). There was a consistent pattern of decreased flexibility with any cellular activation across all three nutrients. AgNP treatment significantly lowered fuel flexibility from control for all three nutrients and was also significantly lower than allergen treatment for glucose oxidation. Compound 48/80 lowered fuel flexibility under 0% for all nutrients. All treatments significantly lowered flexibility for glutamine oxidation, which was the most flexible nutrient source for basal mast cells. Activated mast cells (despite treatment) displayed similar levels of fuel flexibility between all three nutrients whereas basal mast cells appear to have the ability to oxidize nutrients at different rates (glutamine>glucose>fatty acids).
IgE and non-IgE mediated mast cell degranulation induce diverging metabolomic profiles
IgE and non-IgE activated mast cells were collected and metabolomics was utilized to examine 138 targeted metabolites from a range of cellular pathways including purinergic, glycolysis, and TCA cycle among several others (Supplemental Table 1). We first analyzed the data on a large scale by comparing general trends of metabolite production between treatments. In Figure 6A and Figure 6B, heat maps show a clear distinction in metabolite profiles between treatments, particularly between basal mast cells and activated mast cells. A full heat map of metabolomics results is included as Supplemental Figure 3. Figure 6C contains a PCA chart which compares grouping of biological replicates based on treatments utilizing two principal components (PC). There are tight and overlapping groupings for all activated mast cell triplicates. The ‘no treatment’ mast cell population has two samples grouped closely outside the ‘activated’ mast cell grouping with one replicate drifting higher on the chart into treated mast cells groupings.
Fig 6:

Results of metabolomics analysis, showing differences between allergen, AgNP, or Cmd 48/80 treated BMMCs in quantification of 138 metabolites. A) Heat map showing general metabolite amount differences between treatments. Red indicates increased metabolite amount and blue indicates decreased metabolite amount compared to average concentrations across treatments, B) a representative selection of the heat map displaying differences in several metabolites based on treatment, C) 2D principal component analysis (PCA) graph showing grouping of biological replicate metabolite profiles between treatments based on two principal components. n=3. Each n consists of a flask pooled together from two individual mice.
Metabolite concentrations from analyses described in Figure 6 were graphed out along their relative pathways. Figure 7A shows treatment-mediated impact on glycolytic pathway metabolite concentrations. D-glucose uptake amounts were similar between treatments but all metabolites in the glycolytic pathway after this differed in concentrations. IgE-mediated degranulation trends towards having the highest concentration of all these glycolytically related metabolites (only significantly higher for D-Fructose-1,6 bisphosphate over non-IgE and basal mast cells). Compound 48/80 treatment consistently led to non-significantly higher levels of metabolites than control while AgNP treatment did not change metabolite amount from basal mast cells.
Fig 7:

Comparing metabolite concentrations across different pathways relating to cellular energy metabolism. A) Quantification of glycolysis intermediates, B) Quantification of TCA cycle intermediates, C) Quantification of adenosine-based intermediates in the purinergic pathway. One-way ANOVA. n=3. *signifies statistically significant (p<0.05) difference from control. Each n consists of a flask pooled together from two individual mice.
We next analyzed metabolite concentrations related to TCA cycle in Figure 7B. Except for citrate and succinate, these metabolites followed a similar pattern as glycolytic metabolites with allergen treatment inducing the highest concentration followed by non-IgE mediated activation. Citrate levels were similar between all treatments and succinate metabolite levels trended towards decreasing levels in IgE-mediated and compound 48/80 mediated mast cell degranulation (AgNP-mediated degranulation still trended with basal mast cells). IgE-mediated degranulation metabolite concentrations of fumarate and malate were significantly higher than no treatment. Lastly, we explored metabolite profile of molecules directly reflecting energy production and utilization in the purinergic pathway (Fig 7C). All activated mast cells had higher levels of ATP/ADP and decreased levels of AMP than basal mast cells. This change was most pronounced with AgNP treatment with resulted in a significantly higher concentration of ATP (compared to control). Calculating the ratios of ATP:ADP and ATP:AMP provides a quantification of the cellular shift towards energetic phenotype. Both ATP:ADP and ATP:AMP ratios trended toward an increase that was non-significant in activated cells with AgNP treatment increasing both ratios to the highest degree.
DISCUSSION
Cellular metabolism flexibility is essential for appropriate activation in many cell types, such as immune cells, that are highly phenotypically and metabolically variable. Despite this, there is a lack of literature on metabolic activity during activation of mast cells, a critical innate immune effector cell type. This adds to the uncertainty of whether varying mechanisms of activation, e.g. IgE vs. non-IgE, induce diverging cellular responses associated with mast cell degranulation. Therefore, this study explored the role of cellular metabolic shifts during degranulation.
Our major findings from this research demonstrate that 1) basal mast cells’ resting phenotype differ from activated cells’ energetic phenotype, 2) non-IgE activation induces a stress response compared to IgE activation, 3) the mechanism of compound 48/80 mediated mast cell degranulation involves mitochondrial dysfunction, 4) AgNP mediated degranulation strongly eliminates mitochondrial nutrient utilization flexibility. For the first time, we were able to define and compare mast cell metabolic function basally as well as during IgE-mediated and non-IgE mediated degranulation of mast cells. Our results add critical evidence that mast cell degranulation via different mechanisms occur through divergent metabolic pathways.
Our first confirmation of differences between IgE and non-IgE mediated mast cell degranulation was through modulating metabolic pathways prior to activation. When BMMCs were pre-treated with either oligomycin or 2-DG, the level of β-hexosaminidase release was decreased only in non-IgE pathways of degranulation. This suggests that non-IgE pathways are more vulnerable to metabolic disruption, whereas IgE mediated degranulation is more resilient to bioenergetic stress. While other studies utilized these inhibitors with several mast cell lines including BMMCs before, it is possible that 2-DG and oligomycin may be causing inhibition of degranulation from changing receptor expression or cytotoxicity. It should be further confirmed if this functional change is specifically from inhibition of metabolic pathways (34, 35). From this initial response, we hypothesize that degranulation of mast cells via a non-IgE mechanism may be inducing a stress response not allowing for pathway compensation in BMMCs whereas IgE mediated degranulation retains a stronger ability to compensate between catabolic pathways. This ability of BMMCs to compensate in activation despite metabolic shifts is an interesting feature and may be related to the cell’s wide range of physiological cellular environments and functional responses.
The concept of blocking functionality by modulating energetic pathways is important as metabolic activity, both glycolysis and mitochondrial respiration, of mast cells has been reported to drive phenotypic changes. Previous research has demonstrated that blocking glycolysis with 2-DG and blocking mitochondrial respiration with OM (separately) will lead to inhibition of histamine response in IgE-mediated degranulation which is a result we did not obtain here (36, 37). However, these previous experiments were performed in rat peritoneal mast cells and measured degranulation through histamine release while we utilized BMMCs and measured β-hexosaminidase release which is likely responsible for this discrepancy. BMMCs were utilized as the primary mast cell model in this manuscript because of our laboratory’s previous identification of AgNP exposure causing a novel pathway of activation in this cell type. It should be acknowledged that BMMCs (mucosal phenotype) have been shown to respond less robustly to compound 48/80 than peritoneal mast cells (connective tissue phenotype) and there is some debate to whether BMMCs express Mrgprb2 (13, 29). However, there is evidence in literature that show BMMCs can degranulate significantly in response to compound 48/80 with significant calcium activity and an even higher release of β-hexosaminidase than we observed (31). Another recent study by Akula et. al. compared the transcriptome of BMMCs and peritoneal mast cells and while they found significantly more transcripts for the receptor in peritoneal mast cells than BMMCs, they demonstrated significantly more transcripts in BMMCs than other immune cells such as macrophages and B cells (38). Further, our functional degranulation assays in this study show a significant degranulation functional response to compound 48/80 in BMMCs with a low level of cytotoxicity which indicates activation. We also performed qPCR and observed levels of Mgprb2 mRNA expression comparable to that previously reported (38).
We observed that IgE mediated degranulation trends with basal mast cell function when analyzing metabolic function such as mitochondrial membrane potential, oxygen consumption rate (OCR), and extracellular acidification rate (ECAR). This is interesting because it was previously reported that allergen induced degranulation will lead to an increase in oxygen consumption (in rat peritoneal mast cells) and a significant acute increase in extracellular acidification rate as measured using Seahorse (in BMMCs) (34, 39). While the first difference can again be explained by cell model utilized, the latter can be explained by the concentration of DNP dose in experiments. The concentration used in our experiments (100ng/mL) more closely matches the low concentration of DNP (50ng/mL) used by Phong et. al. which resulted in no increases in ECAR. In contrast, differences in ECAR were primarily demonstrated with a much higher dose (500ng/mL) of DNP. Further, we have reported that using higher doses than 100ng/mL induces lower levels of degranulation, so the ECAR response in this paper may not be correlated with activation (30).
We observed that compound 48/80 treatment caused significant mitochondrial dysfunction while increasing glucose uptake compared to AgNP and IgE mediated degranulation, lending evidence to separate mechanisms of metabolism. This mitochondrial dysfunction is accompanied by an insignificant increase in cell death compared to control, but a higher proportion of cell death attributed to necrosis compared to other treatments. There is some evidence linking mitochondrial damage to necrosis, so this potentially adds to the unique mechanism of compound 48/80-mediated degranulation (40, 41). This dysfunction suggests the cell may be undergoing a stress response and losing its ability to properly utilize metabolic pathways. Interestingly, changes in the OCR and ECAR metabolic potentials for each treatment are nicely contrasted, where increases in OCR are mirrored with decreases in ECAR. This hints at a traditional compensatory phenotype change when one arm of ATP production is altered, particularly by activation which matches our earlier observation of mast cells’ ability to compensate for metabolic shifts. This demonstrates differences between an energetic phenotype induced by treatments compared to the resting phenotype of basal mast cells.
Seahorse XF demonstrated that compound 48/80 treatment resulted in both a blunted maximal glycolytic and maximal mitochondrial response along with significant acute effects on OCR and ECAR. Along with the observed mitochondrial membrane depolarization and mitochondrial activity dysfunction, these results demonstrate that compound 48/80 mediated degranulation leads to mitochondrial damage. These are likely linked as mitochondrial damage could induce full utilization of glucose mitochondrially (through pyruvate conversion to Acetyl-CoA) but inefficient mitochondrial energy output (demonstrated by lower mitochondrial ATP production). If mitochondria cannot properly produce energy during this stress response, the cell would upregulate D-glucose uptake to compensate which we showed using multiple techniques. If glycolysis and glucose uptake are overutilized, the cell would have no ability to further maximize this glycolytic pathway leading to an inability to increase ECAR by concerting pyruvate to lactic acid. Therefore, the lack of maximal ECAR in glycolytic Seahorse assays (measured by lactic acid export) could be accounted for by this shunting of pyruvate into the mitochondria and lower mitochondrial energy production from mitochondrial damage. Mitochondria dysfunction can strongly affect cell function. For example, mitochondria are known to act as a cellular calcium flux sensor and damage to the organelle can modulate levels of intracellular calcium (42–44). Calcium levels are critical for calcium-dependent SNARE proteins in regulating exocytosis in mast cells, a potential mechanism that compound 48/80 can be modulating during activation (45, 46). Differential activation of the SNARE protein family is a potential mechanism to explain the varying levels of degranulation seen between treatments and needs to be further explored. Mitochondrial damage is a unique toxicological endpoint with compound 48/80 treatment that most likely contributes to the treatment’s mechanism of degranulation. Like many other immune cells, including macrophages and neutrophils, mast cells can respond to mitochondrial damage-associated molecular patterns (DAMPS) with activation (47). Mitochondrial mediators—such as ROS, mtDNA, or cardiolipin—can interact with common immune cell receptors associated with TLR, NLRP3 inflammasome, and cGAS-STING pathways (48–50). Compound 48/80 may be activating mast cells through calcium modulation or from any of these inappropriately leaked mitochondrial mediators.
Like compound 48/80, AgNP treatment causes a non-IgE stress response but with different characteristics that indicate a separate mechanism of activation. AgNP mediated degranulation displayed no mitochondrial dysfunction or effect on OCR but there was significant inhibition of maximal ECAR. Our metabolomics analysis shows that AgNP treatment results in minimal lactate levels and slightly higher, compared to control, citrate production. If AgNP mediated degranulation caused the cell to metabolize pyruvate to Acetyl-CoA to citrate for utilization through the TCA cycle like compound 48/80 mediated degranulation, there could be a similar lack of lactic acid export and lower ECAR readings. This represents a stress response where the cell cannot appropriately utilize energy producing pathways and elements.
An important element to consider when analyzing mitochondrial cellular response is a fundamental metabolism step: nutrient utilization. Basal mast cells display high flexibility when oxidizing glucose and glutamine but have high dependence on (and little ability to upregulate) fatty acid oxidation which could be defined as the resting phenotype. All treatments lowered flexibility for nutrient sources to some extent, which is likely representative of activated mast cells’ energetic phenotype. The lowered ability for BMMCs to compensate for mitochondrial nutrient oxidation during non-IgE degranulation, compared to IgE degranulation, further confirms a stress response. AgNP treatment induced the most significant decrease in flexibility despite a lack of mitochondrial dysfunction. This adds to the hypothesis that AgNP treatment causes mitochondria to utilize all nutrients available, including pyruvate produced from glycolysis, leaving nothing left to maximize glycolysis and leading to reduced lactic acid formation and release. Therefore, both non-IgE stress response metabolic pathways appear to shunt pyruvate into the mitochondria for further oxidization in the TCA cycle instead of exporting as lactic acid when glycolysis is experimentally maximized by oligomycin; however, the root of this mechanism appears to be different. Compound 48/80 mediated degranulation induces this because of mitochondrial damage and AgNP mediated degranulation from restricting the cells’ ability to switch between nutrient utilization. Despite the diverging reasons leading to this change, this is a unique metabolic endpoint of non-IgE mediated degranulation compared to IgE mediated.
Metabolomics analysis of mast cells matches what we observe throughout all other assays. The grouping of activated mast cells in the PCA analysis demonstrates an energetic phenotype versus a resting phenotype in basal mast cells. Further, the general upregulation of metabolic intermediates in the glycolytic and TCA cycle pathway for IgE mediated degranulation fits into the hypothesis that this mechanism induces a degranulation response that upregulates catabolic pathways properly, which allows for compensation when one pathway is inhibited. This is compared to lack of metabolic increases in the non-IgE mediated degranulation stress response.
Identifying differences in the pattern of metabolite production provides potential targets to analyze in future mechanistic work when exploring the divergence in mechanisms of degranulation. For example, citrate and succinate metabolite levels are unique compared to all other intermediates of the TCA cycle which follow a pattern of allergen treatment producing more than other treatments. Citrate and succinate levels are dependent on acetyl-CoA and succinyl-CoA, respectively, whose production is reliant on several pathways including fatty acid metabolism and amino acid degradation (51, 52). These may be modulated differently depending on treatment, leading to the varying levels of intermediates. Further, this hints that mast cells convert pyruvate to citrate or pyruvate to lactate at different rates depending on treatment, which is essential for accurate ECAR readings. Another facet of this includes alternative fates of glucose including NADH replenishment, amino acid synthesis, and ribose-5-phosphate formation for DNA and RNA synthesis through induction of the pentose-phosphate pathway (22, 23). Further investigation into the fate of glucose in non-IgE mediated degranulation should lead to a better understanding of this stress response.
In this study, we were able to define basal mast cell resting metabolic function and compare it to metabolic function among several different energetic mechanisms of degranulation. We demonstrated a significant difference between these metabolic profiles, providing evidence that mast cells, like other immune cells, change their energetic phenotype during activation. These results demonstrate for the first time that mast cell activation will induce diverging cellular metabolic pathways between IgE mediated response and stressed non-IgE mediated response. We hope that further exploration of these metabolic pathways and targets discovered from metabolomics will help identify new therapeutic targets, as well as prevention and detection strategies, that can improve the quality of life for those suffering from mast cell disorders.
Supplementary Material
Key Points.
Mast cell metabolism varies between IgE and non-IgE mediated degranulation.
Non-IgE mast cell degranulation induces a stress response from metabolic insult.
Acknowledgements
The authors wish to acknowledge and thank the University School of Medicine Metabolomics Core for their contributions to this manuscript.
References
- 1.Brown JM, Wilson TM, Metcalfe DD. 2008. The mast cell and allergic diseases: Role in pathogenesis and implications for therapy. Clin Exp Allergy 38: 4–18 [DOI] [PubMed] [Google Scholar]
- 2.Zoltowska Nilsson AM, Lei Y, Adner M, Nilsson GP. 2018. Mast cell-dependent il-33/st2 signaling is protective against the development of airway hyperresponsiveness in a house dust mite mouse model of asthma. Am J Physiol Lung Cell Mol Physiol 314: L484–L492 [DOI] [PubMed] [Google Scholar]
- 3.Galand C, Leyva-Castillo JM, Yoon J, Han A, Lee MS, McKenzie ANJ, Stassen M, Oyoshi MK, Finkelman FD, Geha RS. 2016. Il-33 promotes food anaphylaxis in epicutaneously sensitized mice by targeting mast cells. J Allergy Clin Immunol 138: 1356–1366 [DOI] [PMC free article] [PubMed] [Google Scholar]
- 4.Varma R, Puri N. 2019. Dampening of mast cell secondary responses to allergen involves specific signalling and epigenetic changes. Cell Immunol 344: 103944. [DOI] [PubMed] [Google Scholar]
- 5.Bryce PJ, Mathias CB, Harrison KL, Watanabe T, Geha RS, Oettgen HC. 2006. The h1 histamine receptor regulates allergic lung responses. J Clin Invest 116: 1624–1632 [DOI] [PMC free article] [PubMed] [Google Scholar]
- 6.Ballesteros-Martinez C, Mendez-Barbero N, Montalvo-Yuste A, Jensen BM, Gomez-Cardenosa A, Klitfod L, Garrido-Arandia M, Alvarez-Llamas G, Pastor-Vargas C, Vivanco F, Garvey LH, Cuesta-Herranz J, Poulsen LK, Esteban V. 2017. Endothelial regulator of calcineurin 1 promotes barrier integrity and modulates histamine-induced barrier dysfunction in anaphylaxis. Front Immunol 8: 1323. [DOI] [PMC free article] [PubMed] [Google Scholar]
- 7.Mikelis CM, Simaan M, Ando K, Fukuhara S, Sakurai A, Amornphimoltham P, Masedunskas A, Weigert R, Chavakis T, Adams RH, Offermanns S, Mochizuki N, Zheng Y, Gutkind JS. 2015. Rhoa and rock mediate histamine-induced vascular leakage and anaphylactic shock. Nat Commun 6: 6725. [DOI] [PMC free article] [PubMed] [Google Scholar]
- 8.Wingard CJ, Walters DM, Cathey BL, Hilderbrand SC, Katwa P, Lin S, Ke PC, Podila R, Rao A, Lust RM, Brown JM. 2011. Mast cells contribute to altered vascular reactivity and ischemia-reperfusion injury following cerium oxide nanoparticle instillation. Nanotoxicology 5: 531–545 [DOI] [PMC free article] [PubMed] [Google Scholar]
- 9.Frangogiannis NG, Lindsey ML, Michael LH, Youker KA, Bressler RB, Mendoza LH, Spengler RN, Smith CW, Entman ML. 1998. Resident cardiac mast cells degranulate and release preformed tnf-alpha, initiating the cytokine cascade in experimental canine myocardial ischemia/reperfusion. Circulation 98: 699–710 [DOI] [PubMed] [Google Scholar]
- 10.Bhattacharya K, Farwell K, Huang M, Kempuraj D, Donelan J, Papaliodis D, Vasiadi M, Theoharides TC. 2007. Mast cell deficient w/wv mice have lower serum il-6 and less cardiac tissue necrosis than their normal littermates following myocardial ischemia-reperfusion. Int J Immunopathol Pharmacol 20: 69–74 [DOI] [PubMed] [Google Scholar]
- 11.Dong H, Zhang X, Wang Y, Zhou X, Qian Y, Zhang S. 2017. Suppression of brain mast cells degranulation inhibits microglial activation and central nervous system inflammation. Mol Neurobiol 54: 997–1007 [DOI] [PubMed] [Google Scholar]
- 12.Yu Y, Blokhuis BR, Garssen J, Redegeld FA. 2016. Non-ige mediated mast cell activation. Eur J Pharmacol 778: 33–43 [DOI] [PubMed] [Google Scholar]
- 13.McNeil BD, Pundir P, Meeker S, Han L, Undem BJ, Kulka M, Dong X. 2015. Identification of a mast-cell-specific receptor crucial for pseudo-allergic drug reactions. Nature 519: 237–241 [DOI] [PMC free article] [PubMed] [Google Scholar]
- 14.Navines-Ferrer A, Serrano-Candelas E, Lafuente A, Munoz-Cano R, Martin M, Gastaminza G. 2018. Mrgprx2-mediated mast cell response to drugs used in perioperative procedures and anaesthesia. Sci Rep 8: 11628. [DOI] [PMC free article] [PubMed] [Google Scholar]
- 15.Frieri M 2018. Mast cell activation syndrome. Clin Rev Allergy Immunol 54: 353–365 [DOI] [PubMed] [Google Scholar]
- 16.Chakravarty N, Sorensen HJ. 1974. Stimulation of glucose metabolism in rat mast cells by antigen, dextran and compound 48–80, used as histamine releasing agents. Acta Physiol Scand 91: 339–353 [DOI] [PubMed] [Google Scholar]
- 17.Johansen T, Chakravarty N. 1975. The utilization of adenosine triphosphate in rat mast cells during histamine release induced by anaphylactic reaction and compound 48/80. Naunyn Schmiedebergs Arch Pharmacol 288: 243–260 [DOI] [PubMed] [Google Scholar]
- 18.Borregaard N, Herlin T. 1982. Energy metabolism of human neutrophils during phagocytosis. J Clin Invest 70: 550–557 [DOI] [PMC free article] [PubMed] [Google Scholar]
- 19.Waters LR, Ahsan FM, Wolf DM, Shirihai O, Teitell MA. 2018. Initial b cell activation induces metabolic reprogramming and mitochondrial remodeling. iScience 5: 99–109 [DOI] [PMC free article] [PubMed] [Google Scholar]
- 20.Guak H, Al Habyan S, Ma EH, Aldossary H, Al-Masri M, Won SY, Ying T, Fixman ED, Jones RG, McCaffrey LM, Krawczyk CM. 2018. Glycolytic metabolism is essential for ccr7 oligomerization and dendritic cell migration. Nat Commun 9: 2463. [DOI] [PMC free article] [PubMed] [Google Scholar]
- 21.Mookerjee SA, Gerencser AA, Nicholls DG, Brand MD. 2017. Quantifying intracellular rates of glycolytic and oxidative atp production and consumption using extracellular flux measurements. J Biol Chem 292: 7189–7207 [DOI] [PMC free article] [PubMed] [Google Scholar]
- 22.Hume DA, Radik JL, Ferber E, Weidemann MJ. 1978. Aerobic glycolysis and lymphocyte transformation. Biochem J 174: 703–709 [DOI] [PMC free article] [PubMed] [Google Scholar]
- 23.Lunt SY, Vander Heiden MG. 2011. Aerobic glycolysis: Meeting the metabolic requirements of cell proliferation. Annu Rev Cell Dev Biol 27: 441–464 [DOI] [PubMed] [Google Scholar]
- 24.Alsaleh NB, Persaud I, Brown JM. 2016. Silver nanoparticle-directed mast cell degranulation is mediated through calcium and pi3k signaling independent of the high affinity ige receptor. PLoS One 11: e0167366. [DOI] [PMC free article] [PubMed] [Google Scholar]
- 25.Johnson M, Alsaleh N, Mendoza RP, Persaud I, Bauer AK, Saba L, Brown JM. 2018. Genomic and transcriptomic comparison of allergen and silver nanoparticle-induced mast cell degranulation reveals novel non-immunoglobulin e mediated mechanisms. PLoS One 13: e0193499. [DOI] [PMC free article] [PubMed] [Google Scholar]
- 26.Kang H, Kim S, Lee KH, Jin S, Kim SH, Lee K, Jeon H, Song YG, Lee SW, Seo J, Park S, Choi IH. 2017. 5 nm silver nanoparticles amplify clinical features of atopic dermatitis in mice by activating mast cells. Small 13 [DOI] [PubMed] [Google Scholar]
- 27.Vance ME, Kuiken T, Vejerano EP, McGinnis SP, Hochella MF Jr., Rejeski D, Hull MS. 2015. Nanotechnology in the real world: Redeveloping the nanomaterial consumer products inventory. Beilstein J Nanotechnol 6: 1769–1780 [DOI] [PMC free article] [PubMed] [Google Scholar]
- 28.Kashem SW, Subramanian H, Collington SJ, Magotti P, Lambris JD, Ali H. 2011. G protein coupled receptor specificity for c3a and compound 48/80-induced degranulation in human mast cells: Roles of mas-related genes mrgx1 and mrgx2. Eur J Pharmacol 668: 299–304 [DOI] [PMC free article] [PubMed] [Google Scholar]
- 29.Subramanian H, Gupta K, Ali H. 2016. Roles of mas-related g protein-coupled receptor x2 on mast cell-mediated host defense, pseudoallergic drug reactions, and chronic inflammatory diseases. J Allergy Clin Immunol 138: 700–710 [DOI] [PMC free article] [PubMed] [Google Scholar]
- 30.Johnson MM 2017. Contribution of physiocochemical properties, cell phenotype and genetics to variability of engineered nanomaterial-induced mast cell activation. University of Colorado, Anschutz Medical Campus, Colorado [Google Scholar]
- 31.Tsvilovskyy V, Solis-Lopez A, Almering J, Richter C, Birnbaumer L, Dietrich A, Freichel M. 2020. Analysis of mrgprb2 receptor-evoked ca (2+) signaling in bone marrow derived (bmmc) and peritoneal (pmc) mast cells of trpc-deficient mice. Front Immunol 11: 564. [DOI] [PMC free article] [PubMed] [Google Scholar]
- 32.Nemkov T, Reisz JA, Gehrke S, Hansen KC, D’Alessandro A. 2019. High-throughput metabolomics: Isocratic and gradient mass spectrometry-based methods. Methods Mol Biol 1978: 13–26 [DOI] [PubMed] [Google Scholar]
- 33.Chong J, Soufan O, Li C, Caraus I, Li S, Bourque G, Wishart DS, Xia J. 2018. Metaboanalyst 4.0: Towards more transparent and integrative metabolomics analysis. Nucleic Acids Res 46: W486–W494 [DOI] [PMC free article] [PubMed] [Google Scholar]
- 34.Phong B, Avery L, Menk AV, Delgoffe GM, Kane LP. 2017. Cutting edge: Murine mast cells rapidly modulate metabolic pathways essential for distinct effector functions. J Immunol 198: 640–644 [DOI] [PMC free article] [PubMed] [Google Scholar]
- 35.Caslin HL, Abebayehu D, Abdul Qayum A, Haque TT, Taruselli MT, Paez PA, Pondicherry N, Barnstein BO, Hoeferlin LA, Chalfant CE, Ryan JJ. 2019. Lactic acid inhibits lipopolysaccharide-induced mast cell function by limiting glycolysis and atp availability. J Immunol 203: 453–464 [DOI] [PMC free article] [PubMed] [Google Scholar]
- 36.Chakravarty N 1967. Inhibition of histamine release from rat mast cells by 2-deoxyglucose. Acta Pharmacol Toxicol (Copenh) 25: Suppl 4:35. [DOI] [PubMed] [Google Scholar]
- 37.Johansen T 1979. Adenosine triphosphate levels during anaphylactic histamine release in rat mast cells in vitro. Effects of glycolytic and respiratory inhibitors. Eur J Pharmacol 58: 107–115 [DOI] [PubMed] [Google Scholar]
- 38.Akula S, Paivandy A, Fu Z, Thorpe M, Pejler G, Hellman L. 2020. How relevant are bone marrow-derived mast cells (bmmcs) as models for tissue mast cells? A comparative transcriptome analysis of bmmcs and peritoneal mast cells. Cells 9 [DOI] [PMC free article] [PubMed] [Google Scholar]
- 39.Chakravarty N 1968. Respiration of rat peritoneal mast cells during histamine release induced by antigen-antibody reaction. Exp Cell Res 49: 160–168 [DOI] [PubMed] [Google Scholar]
- 40.Nieminen AL 2003. Apoptosis and necrosis in health and disease: Role of mitochondria. Int Rev Cytol 224: 29–55 [DOI] [PubMed] [Google Scholar]
- 41.Gao M, Yi J, Zhu J, Minikes AM, Monian P, Thompson CB, Jiang X. 2019. Role of mitochondria in ferroptosis. Mol Cell 73: 354–363 e353 [DOI] [PMC free article] [PubMed] [Google Scholar]
- 42.Diaz-Vegas AR, Cordova A, Valladares D, Llanos P, Hidalgo C, Gherardi G, De Stefani D, Mammucari C, Rizzuto R, Contreras-Ferrat A, Jaimovich E. 2018. Mitochondrial calcium increase induced by ryr1 and ip3r channel activation after membrane depolarization regulates skeletal muscle metabolism. Front Physiol 9: 791. [DOI] [PMC free article] [PubMed] [Google Scholar]
- 43.Rizzuto R, Bastianutto C, Brini M, Murgia M, Pozzan T. 1994. Mitochondrial ca2+ homeostasis in intact cells. J Cell Biol 126: 1183–1194 [DOI] [PMC free article] [PubMed] [Google Scholar]
- 44.Robb-Gaspers LD, Burnett P, Rutter GA, Denton RM, Rizzuto R, Thomas AP. 1998. Integrating cytosolic calcium signals into mitochondrial metabolic responses. EMBO J 17: 4987–5000 [DOI] [PMC free article] [PubMed] [Google Scholar]
- 45.Yang Y, Kong B, Jung Y, Park JB, Oh JM, Hwang J, Cho JY, Kweon DH. 2018. Soluble n-ethylmaleimide-sensitive factor attachment protein receptor-derived peptides for regulation of mast cell degranulation. Front Immunol 9: 725. [DOI] [PMC free article] [PubMed] [Google Scholar]
- 46.Woska JR Jr., Gillespie ME. 2012. Snare complex-mediated degranulation in mast cells. J Cell Mol Med 16: 649–656 [DOI] [PMC free article] [PubMed] [Google Scholar]
- 47.Zhang Q, Raoof M, Chen Y, Sumi Y, Sursal T, Junger W, Brohi K, Itagaki K, Hauser CJ. 2010. Circulating mitochondrial damps cause inflammatory responses to injury. Nature 464: 104–107 [DOI] [PMC free article] [PubMed] [Google Scholar]
- 48.West AP, Khoury-Hanold W, Staron M, Tal MC, Pineda CM, Lang SM, Bestwick M, Duguay BA, Raimundo N, MacDuff DA, Kaech SM, Smiley JR, Means RE, Iwasaki A, Shadel GS. 2015. Mitochondrial DNA stress primes the antiviral innate immune response. Nature 520: 553–557 [DOI] [PMC free article] [PubMed] [Google Scholar]
- 49.Patrushev M, Kasymov V, Patrusheva V, Ushakova T, Gogvadze V, Gaziev A. 2004. Mitochondrial permeability transition triggers the release of mtdna fragments. Cell Mol Life Sci 61: 3100–3103 [DOI] [PMC free article] [PubMed] [Google Scholar]
- 50.Iyer SS, He Q, Janczy JR, Elliott EI, Zhong Z, Olivier AK, Sadler JJ, Knepper-Adrian V, Han R, Qiao L, Eisenbarth SC, Nauseef WM, Cassel SL, Sutterwala FS. 2013. Mitochondrial cardiolipin is required for nlrp3 inflammasome activation. Immunity 39: 311–323 [DOI] [PMC free article] [PubMed] [Google Scholar]
- 51.Wang T, Yao W, Li J, He Q, Shao Y, Huang F. 2018. Acetyl-coa from inflammation-induced fatty acids oxidation promotes hepatic malate-aspartate shuttle activity and glycolysis. Am J Physiol Endocrinol Metab 315: E496–E510 [DOI] [PubMed] [Google Scholar]
- 52.Newman JC, Verdin E. 2014. Beta-hydroxybutyrate: Much more than a metabolite. Diabetes Res Clin Pract 106: 173–181 [DOI] [PMC free article] [PubMed] [Google Scholar]
Associated Data
This section collects any data citations, data availability statements, or supplementary materials included in this article.