Abstract
Objectives
Importations of novel variants of concern (VOC), particularly B.1.617.2, have become the impetus behind recent outbreaks of SARS-CoV-2. Concerns around the impact on vaccine effectiveness, transmissibility and severity are now driving the public health response to these variants. This paper analyses the patterns of growth in hospitalisations and confirmed cases for novel VOCs by age groups, geography and ethnicity in the context of changing behaviour, non-pharmaceutical interventions (NPIs) and the UK vaccination programme. We seek to highlight where strategies have been effective and periods that have facilitated the establishment of new variants.
Design
We have algorithmically linked the most complete testing and hospitalisation data in England to create a data set of confirmed infections and hospitalisations by SARS-CoV-2 genomic variant. We have used these linked data sets to analyse temporal, geographic and demographic distinctions.
Setting and participants
The setting is England from October 2020 to July 2021. Participants included all COVID-19 tests that included RT-PCR CT gene target data or underwent sequencing and hospitalisations that could be linked to these tests.
Methods
To calculate the instantaneous growth rate for VOCs we have developed a generalised additive model fit to multiple splines and varying day of the week effects. We have further modelled the instantaneous reproduction number Rt for the B.1.1.7 and B.1.617.2 variants and included a doubly interval censored model to temporally adjust the confirmed variant cases.
Results
We observed a clear replacement of the predominant B.1.1.7 by the B.1.617.2 variant without observing sustained exponential growth in other novel variants. Modelled exponential growth of RT PCR gene target triple-positive cases was initially detected in the youngest age groups, although we now observe across all ages a very small doubling time of 10.7 (95% CI 9.1 to 13.2) days and 8 (95% CI 6.9 to 9.1) days for cases and hospitalisations, respectively. We observe that growth in RT PCR gene target triple-positive cases was first detected in the Indian ethnicity group in late February, with a peak of 0.06 (95% CI 0.07 to 0.05) in the instantaneous growth rate, but is now maintained by the white ethnicity groups, observing a doubling time of 6.8 (95% CI 4.9 to 11) days. Rt analysis indicates a reproduction number advantage of 0.45 for B.1.617.2 relative to B.1.1.7, with the Rt value peaking at 1.85 for B.1.617.2.
Conclusions
Our results illustrate a clear transmission advantage for the B.1.617.2 variant and the growth in hospitalisations illustrates that this variant is able to maintain exponential growth within age groups that are largely doubly vaccinated. There are concerning signs of intermittent growth in the B.1.351 variant, reaching a 28-day doubling time peak in March 2021, although this variant is presently not showing any evidence of a transmission advantage over B.1.617.2. Step 1b of the UK national lockdown easing was sufficient to precipitate exponential growth in B.1.617.2 cases for most regions and younger adult age groups. The final stages of NPI easing appeared to have a negligible impact on the growth of B.1.617.2 with every region experiencing sustained exponential growth from step 2. Nonetheless, early targeted local NPIs appeared to markedly reduced growth of B.1.617.2. Later localised interventions, at a time of higher prevalence and greater geographic dispersion of this variant, appeared to have a negligible impact on growth.
Keywords: epidemiology, COVID-19
Strengths and limitations of this study.
This study is unique in analysing the growth in hospitalisations by variants of concern in England and the impact of demographics, geography and behaviour for the introduction and growth of novel variants.
The study calculates growth rates and Rt and the conclusions regarding extrinsic factors are inferential and descriptive.
Geographic bias for laboratories that supplied RT-PCR CT data for the genes ORF1ab, N and S was evident in England, which led to greater uncertainty for the modelled growth rate estimates in some regions.
We did not algorithmically link vaccination status to each individual as this subset the data further and reduced the feasibility of meaningful growth rate analysis, and therefore age groups were used as a proxy indicator.
To calculate Rt by variant, we had to assume there to be reasonably consistent ascertainment bias in the testing data.
Introduction
The SARS-CoV-2 virus has had an unprecedented impact and global reach since the first officially confirmed case in December 2019.1 Periods of high global prevalence of the virus have allowed the emergence of novel mutations through antigenic drift, with evidence this is largely a reaction to the host immune response.2 Furthermore, we may now begin to see selective mutation in response to natural and vaccine-induced immunity. The rate of mutation for coronaviruses has been poorly understood; however, evidence from seasonal human coronaviruses HCoV-229E and HCoV-OC43 illustrates that the evolution of SARS-CoV-2 may have parallels with the influenza A virus, including more concerning adaptive changes to the receptor-binding domain (RBD).3 In addition, viruses akin to SARS-CoV-2, that are RNA based, tend to show high rates of mutation, which are likely to be related to insufficient proofreading abilities.4 Imports of novel variants of COVID-19 are now of great concern as they become the impetus behind localised outbreaks in the UK.5 A UK government modelling report from June 2021 highlighted the significance of importations6 and it was estimated that SARS-CoV-2 lineages derived from individuals who had recently travelled had a higher relative reproduction number.
The vaccination campaign began in England on 8 December 2020 with care home residents, the most clinically vulnerable and hospital staff. This was followed by an age-stratified structure that commenced with the over 80s on 17 January 2021 and reached the 21–30 age group by 16 June 2021.7 The vaccination campaign began with Pfizer/BioNTech and AstraZeneca with first doses prioritised. The age groups over 40 were primarily administered with AstraZeneca; Pfizer/BioNTech and Moderna were administered largely to the younger age groups in response to concerns over haemostatic side effects.8 The chief concerns around importations of novel variants have been driven by immunological escape. A recent trial in South Africa9 found that the AstraZeneca vaccine had a two-dose efficacy of 10% against infection from B.1.351 at preventing mild to moderate disease, although this study used very limited data. Further research found the B.1.617 variant, which was first detected in October 2020 in India, carries two mutations on the RBD and preliminary results indicated this may have an impact on vaccine effectiveness.10 11 B.1.617.2, a sublineage of B.1.617, has caused global concern due to the rate of growth that has been observed since it was first sequenced in India. A recent study12 that analysed the sera of patients infected with B.1.617.2 found that it has nine spike mutations on the N-terminal domain and the RBD. This study observed that B.1.617.2 is resistant to neutralisation with the efficacy of the Pfizer vaccine around three to six times less than observed with B.1.1.7. Nonetheless, further evidence suggests that doubly vaccinated individuals may still possess robust neutralisation titres against B.1.617.2 and there is still relatively high vaccine effectiveness against symptomatic disease.13 However, these results do not take into account that symptomatic status is poorly recorded for PCR tests in England and that sequenced B.1.617.2 variant cases were limited at the time.
The evidence of substantial viral epitopic mutation has necessitated a risk categorisation for novel mutant strains in the UK. Variants that display epidemiological and immunological characteristics of concern are defined as a variant under investigation (VUI)14 and after committee evaluation may be escalated to a variant of concern (VOC). As of 12 May 2021 there are eight VUIs and five variants defined as VOCs: B.1.1.7 (VOC-20DEC-01) Alpha, B.1.351 (VOC-20DEC-02) Beta, P.1 (VOC-21JAN-02) Gamma, B.1.1.7 with E484K (VOC-21FEB-02) and B.1.617.2 (VOC-21APR-02) Delta.15 The most concerning VOCs presently are B.1.351 and B.1.617.2 due to evidence of diminished vaccine effectiveness, particularly in the former. There is also growing evidence that B.1.617.2 has acquired mutations that have increased the viral fitness improving the transmissibility of this lineage.
In this paper we have used RT-PCR CT data for the genes ORF1ab, N and S and sequenced tests for COVID-19 that have been algorithmically linked to hospitalisation data sets. We assess the temporal variability in the growth of VOCs relative to the previously predominant B.1.1.7 variant across the geography of the UK. We further assess how the instantaneous growth rate has changed across ages, ethnicity and in response to the easing of non-pharmaceutical interventions (NPIs). Finally, we assess the relative difference in the reproduction number between B.1.617.2 and the established B.1.1.7 variant.
Methods
Epidemiological and clinical data
Accident and emergency (A&E) data set is from the Secondary Uses Service(SUS) suite of data sets. These data were linked with the PCR targets from the second generation surveillance system (SGSS). The linkage allows the patient’s pathway to be followed and provides additional information beyond what is obtainable from the stand-alone data sets. The linkage algorithm has evolved from research and development undertaken on the two data sets. The algorithm is primarily based on fields that:
Identify the patient using a pseudoidentifying number.
Report the outcome of the A&E attendance.
Report the method of admission.
Further, the basic principles behind the linkage method are where:
The unique patient pseudoidentifier is the same in A&E and SGSS data.
The SGSS specimen date is between 6 days before or 14 days after the A&E admissions date.
For multi-episode spells, the admission date used for the linkage comes from the first episode in a spell. Linkage was conducted in a secure research environment and with full anonymisation of the data. The linked hospitalisation data were subset nationally by age, region and lower tier local authority (LTLA).
RT-PCR testing for COVID-19 involves a detection of three genes ORF1ab, N and S. The S-gene mutation in B.1.1.7 results in a dropout of S-gene detection, providing an easier prevalence indicator for this variant where information is available on the RT-PCR gene target. Due to operational and logistical limitations, sequenced viral genomic data were limited and therefore we employed the S dropout in gene target CT value data to identify B.1.1.7 and triple-positive cases (ORF1ab, N and S gene positive) were used as a proxy for the identification of VOCs that include the B.1.351, P1 and B.1.617.2 variants considered in this analysis. However, from the end of March 2021, B.1.617.2 accounted for almost the entirety of triple-positive variant cases. We analysed S dropout and triple-positive cases from the Public Health England National Pathology Exchange (NPEx) data set, which was subset by travel status, ethnicity, age, region and LTLA. The RT-PCR data were linked to the SUS data set to acquire hospitalisations for triple-positive and S dropout variants. Further genomic sequenced data were acquired through SGSS and suspected variants from the reflex assays. The P.1, B.1.617.2, B.1.351 and B.1.1.7 variants were included in this analysis and other variants were excluded due to low numbers. Owing to limited data, analysis of genomic sequenced and reflex assay data was only conducted at a national spatial resolution.
Instantaneous growth rate and doubling times
The method for the estimation of the time-varying growth rates and doubling times is adapted from a generalised additive model with a canonical link.16 17 We allow for a varying day of the week fixed effect: no day, weekend or weekday effect. We further fit to cubic regression splines,18 P-splines,19 thin-plate splines (a low-rank isotropic smoother),20 Duchon splines (allowing for lower orders of the derivative in the penalty relative to the thin-plate splines)21 and Gaussian process smoothers. The model assumes the number of cases is proportional to for some smoother .22 The overdispersed noise inherent in both disease dynamics and surveillance data motivates the use of a negative binomial error structure. The instantaneous growth rate is obtained as the time derivative of the smoother, , and the instantaneous doubling time is calculated as . Asymptotic confidence intervals (CI) on are only indicative of uncertainty on , especially when the variance grows as approaches zero. The number of knots used by the spline is fixed as one-twentieth the length of the time series (for time series shorter than 200 days the default number of knots is used) to avoid oversmoothing the data or losing signal in the noise. The model for each group, fit to each spline and day of the week effect, is assessed by the leave-one-out and the Akaike information criterion metrics to select the best model fit.
Included in each plot is the date of the first confirmed case for B.1.1.7, B.1.617.2, B.1.351 and P.1 as they were considered of most concern at this time due to overall volume and phenotypic characteristics. In addition, each step of the national lockdown easing23 in England has been included:
Step 1a—schools and universities are to reopen, care homes allow visitors and recreation within households and support bubbles are allowed.
Step 1b—the ‘stay at home’ rule will end and outdoor sports to resume; furthermore, the rule of 6 begins and two households can meet outdoors.
Step 2—non-essential retail, gyms and outdoor hospitality will reopen.
Step 3—a lifting of most legal restrictions on mixing outdoors, events of up to 30 persons can be held and indoor hospitality can recommence.
Instantaneous reproduction number Rt
This model used the diagnostic RT-PCR gene target results for positive tests with the S dropout and triple-positive cases as a proxy for infections of the B.1.1.7 and B.1.617.2 variants. We calculate the instantaneous reproduction number24 that corresponds to the average quantity of secondary cases that develop from the primary cases infected at a time period we call t, if conditions remained constant; defined as:
Here It is defined as the quantity of incidence on day t and ws is the discretised generation time distribution.
This approach was used as it is a reflection of the instantaneous transmissibility at a given point in time of the SARS-CoV-2 variant. The limitation of this approach is that it assumes there is a reasonable consistency in the ascertainment bias in the testing data and tests with reported gene target CT values . Individuals who had a flag for recent travel were removed from the data set prior to analysis.
The serial interval pertains to the duration of time from the onset symptoms of a primary case to the onset of symptoms for a secondary case that was infected by the primary case. To account for uncertainty in the serial interval, we used a Markov chain Monte Carlo (MCMC) simulation model of data sourced from a meta-analysis25 that included studies which have published on the mean and standard deviations of the serial interval for SARS-CoV-2.
The most complete available testing data for England are recorded at the specimen date of the test. To calculate the instantaneous reproduction number, we would optimally use the symptom-onset date of positive cases at time t. Therefore, to adjust for this temporal discrepancy, we have adapted a Hamiltonian Bayesian MCMC doubly interval censored model from Ward and Johnsen26 to calculate temporal changes over time for the lag from symptom onset to specimen date fitting to a Weibull distribution.
Patient and public involvement
Patients were not involved in the development of the research question and study design.
Results
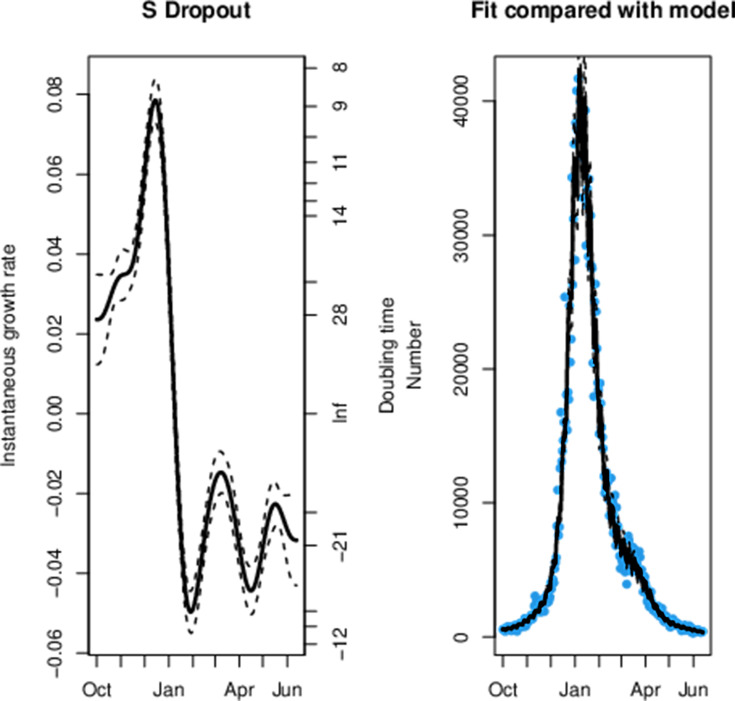
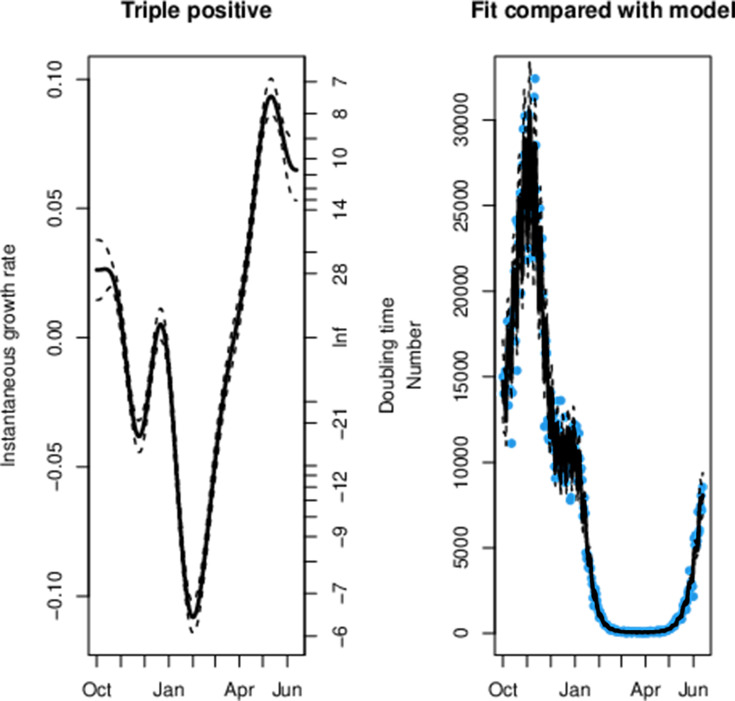
Across all age groups in England we can observe that the decay rate for triple-positive cases peaked at the start of February in figure 1. This was followed by a rapid reduction in the rate of exponential decay for triple-positive cases and subsequent exponential growth from 25 March, which is 10 days after the first confirmed case of B.1.617.2. Conversely, we observe exponential decay in the S dropout cases from 7 January. We can observe that step 1a occurred shortly before the exponential growth of triple-positive cases and a steeper gradient in the line can be seen after step 1b and step 2. This model had a sample size of 1 108 537 triple-positive and 1 051 205 S dropout cases and the model fit to the data can be seen in figures 2 and 3.
Figure 1.
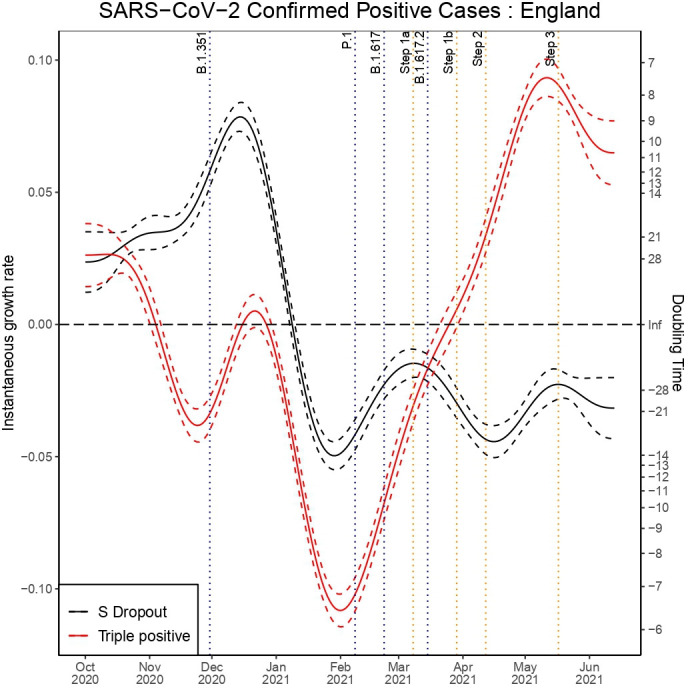
Instantaneous growth rate and doubling times for confirmed positive tests in England by triple-positive and S dropout variants.
Figure 2.
The maximum likelihood model fit to the S dropout confirmed positive testing data.
Figure 3.
The maximum likelihood model fit to the triple-positive confirmed positive testing data.
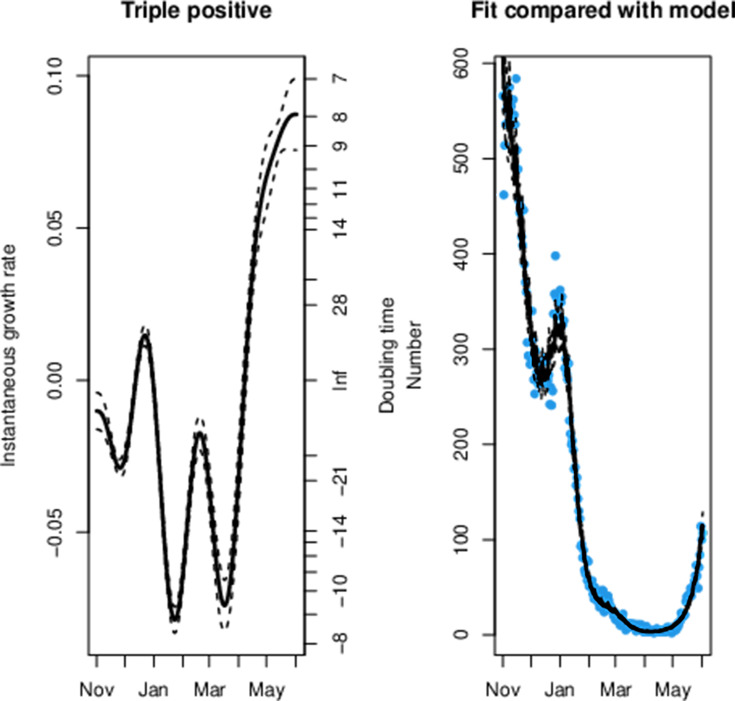
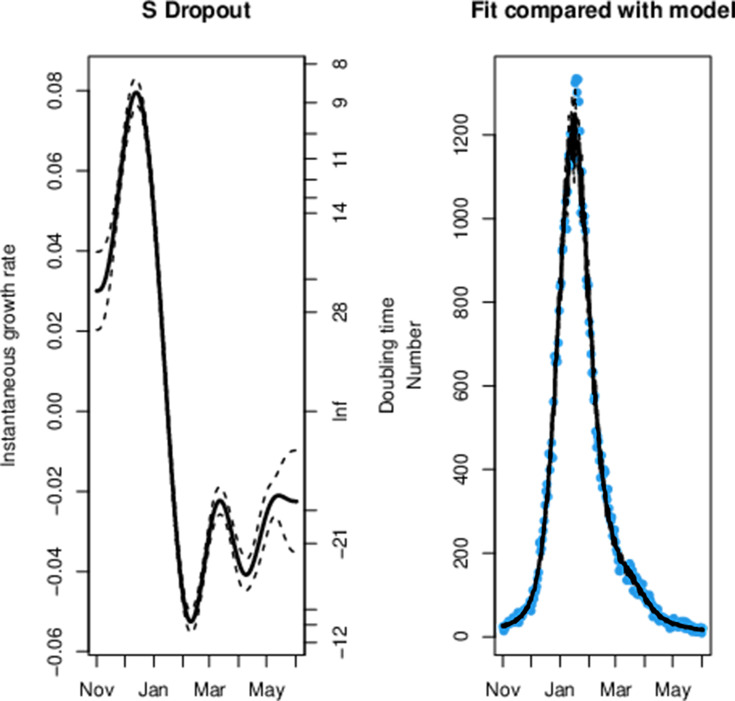
We can observe a sharp reduction in the rate of the exponential decay for triple-positive hospital admissions from 14 March in figure 4, which was 1 day before the first confirmed case of B.1.617.2. The data fit to the model can be seen in figures 5 and 6 for S dropout and triple-positive cases, respectively. After linkage with the RT-PCR gene target data we had a sample size of 35 435 triple-positive and 64 514 S dropout hospitalisations. We observe exponential growth in triple-positive hospitalisations from 8 April, which is 13 days later than exponential growth was detected in the testing data. S dropout admissions have been in exponential decay from 16 January after a peak in mid-December, which preceded the second wave of SARS-CoV-2 hospitalisations in England. Wider CIs in the growth rate estimates for S dropout hospitalisations in mid-June are a result of the low numbers now observed.
Figure 4.
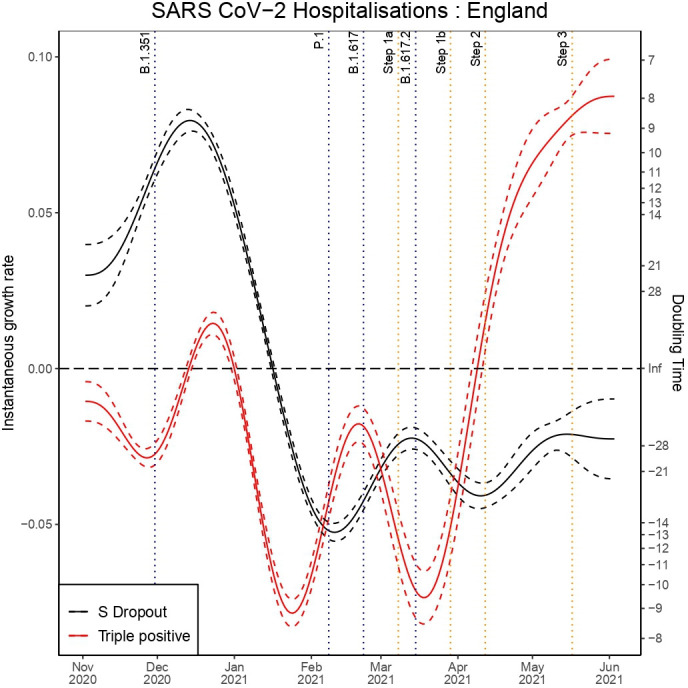
Instantaneous growth rate and doubling times of hospitalisations in England by variants.
Figure 5.
The maximum likelihood model fit to the S dropout confirmed hospitalisation data.
Figure 6.
The maximum likelihood model fit to the triple-positive confirmed hospitalisation data.
RT-PCR gene target data: SARS-CoV-2-positive tests
Age group
Analysis of the testing data across age groups, seen in online supplemental appendix A, illustrates that the earliest reduction in the decay rate for triple-positive variant cases was observed in the youngest age groups from the end of January. The earliest exponential growth was observed in the 25–34 age group and this was followed very shortly by exponential growth in triple-positive cases in all ages. The 0–24 age group experienced the largest growth rate in triple-positive cases reaching a doubling time of 6.30 (95% CI 6.74 to 5.90) days. Step 1a had a stark impact on the triple-positive variant growth rate for the 25–44 age groups and a negligible impact on the oldest age groups. It was not until step 2 that the over 75 year old age group began to experience exponential growth in triple-positive variant cases. We observe slightly wider CIs in the over 75 year old age group, which is due to smaller case numbers, at this time, producing greater uncertainty. In these age groups we also observe smaller numbers leading to larger CIs in S dropout growth estimates that overlap into positive growth.
bmjopen-2021-056636supp001.pdf (2.1MB, pdf)
Region
In the regional testing data we can observe that the North East 0.12 (95% CI 0.12 to 0.14), the North West 0.09 (95% CI 0.05 to 0.14) and Yorkshire and the Humber 0.15 (95% CI 0.13 to 0.17) are currently experiencing the largest exponential growth in triple-positive cases, which can be seen in online supplemental appendix B. We do, however, observe modest growth in the S dropout cases in these regions from the start of May with the largest growth observed in the South West where we observe a doubling time of 15.8 (95% CI 8.00 to 811.1) days. Nonetheless, these estimates produce extremely large CIs and the South West is known to have limited reporting for diagnostic RT-PCR gene target CT values, which will lead to greater uncertainty in growth rate calculations. London saw the earliest exponential growth in the triple-positive variant cases and appeared to be the most responsive to step 1a. Conversely, the North West did not experience exponential growth until step 1b. Step 2 had the greatest impact on the North East, West Midlands, and Yorkshire and the Humber, which hitherto had only experienced limited sporadic growth of these cases in the testing data.
Ethnicity
In online supplemental appendix C we can observe that exponential growth in triple-positive cases began in the Indian ethnicity group from late February reaching a doubling time of 11.3 (95% CI 9.7 to 13.5) days, which is now in exponential decay. Moreover, we observed a very steep growth in the Pakistani ethnicity group from 10 April that coincided with the religious festival of Ramadan and reached a doubling time of 4.8 (95% CI 4.4 to 5.2) days on 4 May. It is evident that the growth of the triple-positive cases since 7 April has been strongly sustained by the white ethnicity groups with a doubling time of approximately 7 days.
Lower tier local authority
From the subset of LTLAs analysed (full results can be seen in online supplemental appendix D), we currently observe the shortest doubling time for triple-positive cases to be in Blackpool, 3.9 (95% CI 3.2 to 4.8) days, and Kirklees, 5.6 (95% CI 4.5 to 7.4) days. Birmingham experienced the earliest intermittent growth of the triple-positive cases shortly prior to step 1a. However, Bolton and Blackburn with Darwen saw the earliest sustained exponential growth in triple-positive cases reaching 0.16 (95% CI 0.15 to 0.18) and 0.14 (95% CI 0.16 to 0.11), respectively, before interventions, that included surge testing, increased vaccination and public health awareness campaigns,27 appeared to slow growth substantially. Nonetheless, the interventions in Burnley and Kirklees28 had limited success, which is apparent in online supplemental appendix D. It is striking that for LTLAs in the North West like Manchester the rate of exponential decay began to reduce from the end of January, which was over a month before the relaxation in NPIs began with step 1a. This is not observed for S dropout cases and this illustrates that triple-positive variant transmission was able to increase despite a strict national lockdown.
RT-PCR gene target data: SARS-CoV-2-positive hospitalisations
Age group
In online supplemental appendix E, we observe that the 65–74 age group saw the earliest wave of growth in triple-positive variant-attributed hospitalisations at the end of March, after step 1b. Nonetheless, most age groups only experienced exponential growth after step 2, resulting from the wave of infections caused by earlier NPI restriction easing steps. Akin to the results observed for triple-positive tests, we now see corresponding strong growth in hospitalisations for the youngest age groups of 0–24: 0.11 (95% CI 0.07 to 0.15), 25–34: 0.12 (95% CI 0.08 to 0.15) and 35–44: 0.07 (95% CI 0.04 to 0.11). This is indicative of where the epidemic was growing in the population, and therefore the ages that had seen the largest concentration of infections. The analysis for the over 65 years old age group indicates congruent growth and very short doubling times, although there is greater uncertainty in these estimates due to smaller numbers presently observed.
Region
The region that observed the earliest exponential growth in triple-positive cases that could be attributed to B.1.617.2 was London, seen in online supplemental appendix F, followed very shortly by the East of England and Yorkshire and the Humber. This is not consistent with the growth rate analysis of the positive tests for the East of England and Yorkshire and the Humber, which may be indicative of the lower laboratory reporting coverage for diagnostic RT-PCR gene target CT values in these regions that will bias the results to areas of higher coverage. However, this may also be a consequence of triple-positive variant infections being less concentrated in the younger ages in the East of England and Yorkshire and the Humber. The wave of triple-positive variant-attributed hospitalisations observed that occurred across the regions around the introduction of step 2 is a palpable consequence of steps 1a and 1b with the exception of the South East and South West, which did not experience sustained exponential growth until the effects of the step 2 restriction easing had impacted transmission. The hospitalisation analysis illustrates the most substantial growth in hospitalisations now observed, with the tightest CIs, can be seen in the North West 0.12 (95% CI 0.09 to 0.15) and also the South East 0.14 (95% CI 0.08 to 0.20). The highest central estimate is in the North East with a doubling time of 3.4 days, but with large CIs that may be related to poor CT value reporting coverage in this area.
Lower tier local authority
Following the early sustained exponential growth in triple-positive cases in Bolton and Blackburn with Darwen we also concurrently observe the earliest growth in hospitalisations that can be attributed to triple-positive cases in these areas. The highest rates of growth presently observed for the LTLAs of concern, included in this analysis, are in Salford and Trafford with doubling times of 3.3 (95% CI 2.4 to 5.8) and 4 (95% CI 2.5 to 10.7) days, respectively, with full LTLA analysis in online supplemental appendix G. We also observe in an LTLA in Yorkshire and the Humber, Kirklees, a comparably short doubling time of 4.2 (95% CI 2.5 to 12.4) days but with larger CIs that are a by-product less diagnostic RT-PCR gene target laboratory reporting in this region.
The instantaneous reproduction number Rt
To parametrise the Rt model, we have calculated the minimum, maximum, standard deviation and mean of the values from the Reed et al’s25 meta-analysis, with results in online supplemental appendix H, to create an MCMC simulation of the serial interval distribution. For this model, we further calculated the time lag from symptom-onset date to specimen date in England that can be seen in online supplemental appendix I. The results show a marked reduction from the first wave of SARS-CoV-2 in England, January to May 2020, which may be related to an improved public health message and more effective contact tracing. The sample size used in this model was 1 040 387 and 1 020 664 for S dropout and triple-positive variant cases, respectively.
Analysis of the instantaneous reproduction number in figure 7 illustrates that from mid-March Rt began to grow for triple-positive cases reaching 1.85 by mid-April. The short reduction in Rt for triple-positive cases at the end of March is a probable consequence of targeted local interventions.28 Nonetheless, we observe that B.1.1.7 has been below 1 since January apart from a brief period of growth in March with the reopening of schools. The Rt estimates imply the greater transmissibility for the triple-positive dominant variant B.1.617.2 and from the time of the first confirmed case we observe an average reproduction number advantage of 0.45.
Figure 7.
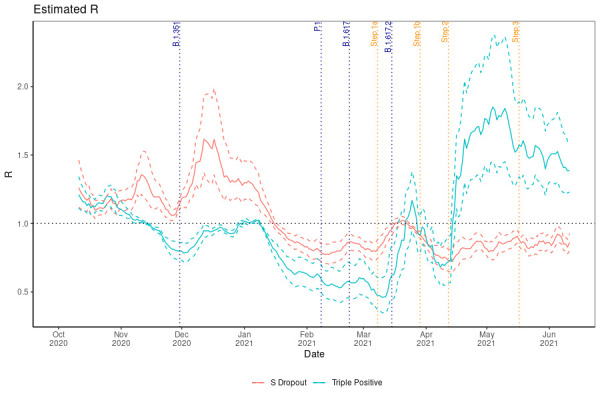
The instantaneous reproduction number for S dropout and triple-positive cases.
Genomic sequenced and reflex assays: SARS-CoV-2-positive cases
The sample size for each variant included in this model:
B.1.1.7 (225 034).
B.1.351 (933).
B.1.617.2 (91 960).
P.1 (223).
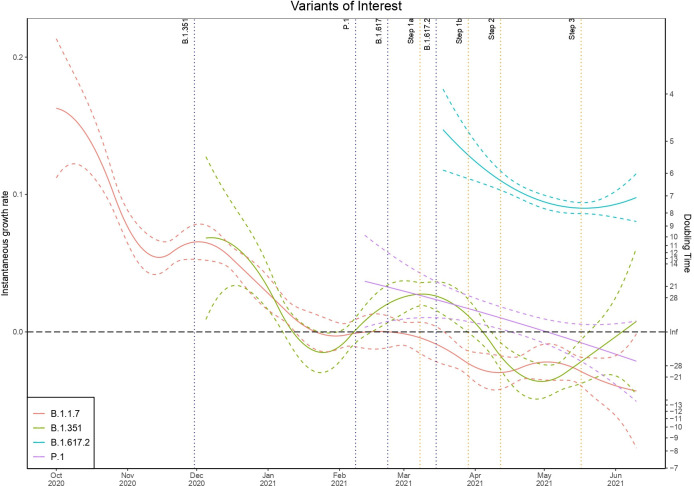
Analysis of the sequenced genomic data and reflex assays in figure 8 illustrates that since the first detected case of B.1.617.2 in England there has been sustained exponential growth in this variant with a doubling time of 7 days now observed. It is apparent that P.1 has not managed to gain much traction and has been in steady decline from the time of first detection and importation. B.1.1.7, as can be observed in the S dropout results, has been in exponential decay since January after a period of high prevalence contributing to the second wave of the SARS-CoV-2 epidemic in the UK. B.1.351 conversely has seen periods of growth and decay but without a substantial period of sustained growth that would allow this variant to become established and more significant. However, we observed exponential growth in B.1.351 from the start of February during a national lockdown in England, which began to decline after localised NPIs and the introduction of B.1.617.2. There are concerning signs that this variant now continues to experience intermittent growth although from a very low baseline. It is not clear that the NPI easing had a substantial impact on increasing B.1.1.7 transmission, which is likely to be related to competition with B.1.617.2 from early 2021.
Figure 8.
Instantaneous growth rate and doubling times of confirmed positive cases by the highest priority variants of interest.
Discussion
There has been a reduction in the exponential decay rate of triple-positive cases since February in England and exponential growth since April. It is evident from figure 8 that B.1.617.2 has been the dominant triple-positive variant and that other imported variants have thus far failed to compete effectively and have been largely in exponential decay. The results indicate the earliest localised outbreaks of B.1.617.2 were concentrated in Bolton and Blackburn with Darwen in the North West of England, which is corroborated by triple-positive attributed tests and hospitalisations. Analysis of the testing data at a regional spatial scale, however, indicates the earliest exponential growth of cases that could be attributed to B.1.617.2 was in London, the East Midlands, the South East and the South West, with the North West experiencing exponential growth later than these regions and after step 1b. Analysis of B.1.617.2-attributed hospitalisations corroborates the early growth in London; however, analysis suggests Yorkshire and the Humber and the East of England may have experienced some of the earliest outbreaks. This may be a consequence of these regions having a greater concentration of cases in older age groups. However, these regions also experience less complete laboratory reporting for diagnostic RT-PCR CT gene target data, which may disguise possible outbreaks. S dropout cases, the proxy for B.1.1.7, have been largely in exponential decay since the January national lockdown in the UK with isolated areas of growth. Further research should focus on whether we can observe greater growth in B.1.1.7 for the areas that have a larger proportion of unvaccinated individuals.
A limitation of this study is that it does not directly include the vaccination status of the infections in the analysis, and therefore the analysis employs age as a proxy for vaccination status. This is due to limitations in sequencing and RT-PCR CT gene target data coverage, which after linkage with vaccination status preclude meaningful analysis for the growth and reproduction number of the groups included. The very high rates of vaccination in the oldest age groups seen in tables 1 and 2 illustrate a clear stratification between ages: by the end of June over 91.1% of those over the age of 60 had received two doses of the vaccination and that most individuals under the age of 50 had not received their second dose of the vaccination by July.
Table 1.
Proportion of each age group who have received their first vaccination by the end of each month
| Month | 18–29 | 30–39 | 40–49 | 50–59 | 60+ |
| December | 0.5 | 0.8 | 1.2 | 1.4 | 5.3 |
| January | 4.6 | 6.0 | 8.1 | 10.2 | 40.0 |
| February | 9.2 | 12.6 | 18.7 | 28.8 | 79.3 |
| March | 15.9 | 21.9 | 36.5 | 81.5 | 91.8 |
| April | 17.3 | 24.9 | 55.5 | 84.4 | 92.4 |
| May | 21.8 | 47.8 | 74.2 | 85.9 | 92.9 |
| June | 50.2 | 63.1 | 76.9 | 86.7 | 93.2 |
Table 2.
Proportion of each age group who have received their second vaccination by the end of each month
| Month | 18–29 | 30–39 | 40–49 | 50–59 | 60+ |
| December | 0.0 | 0.0 | 0.0 | 0.0 | 0.0 |
| January | 0.1 | 0.2 | 0.3 | 0.4 | 2.6 |
| February | 0.3 | 0.5 | 0.7 | 0.8 | 2.9 |
| March | 2.3 | 3.3 | 4.5 | 5.6 | 15.7 |
| April | 6.3 | 8.4 | 12.0 | 17.3 | 62.0 |
| May | 11.9 | 16.9 | 27.3 | 54.7 | 87.4 |
| June | 16.7 | 24.9 | 50.1 | 81.9 | 91.1 |
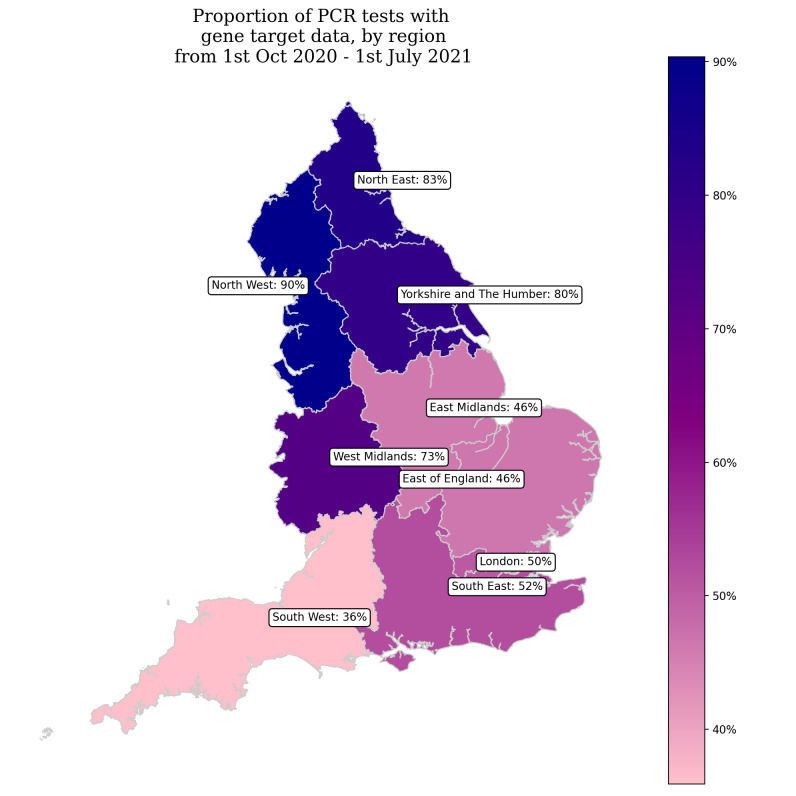
The arrival of a VOC can result in higher rates of testing and sequencing for specific LTLA geographic locations. However, this targeted approach was not conducted to a considerable extent for B.1.617.2 due to how quickly transmission became widespread in England. Nonetheless, the sporadic growth we observe in B.1.351, which has failed to maintain growth in the absence of importations, has been influenced by surge testing and enhanced contact tracing of locations where this variant has been found. Targeted surge testing in response to importations of B.1.351 began in 2021 for LTLAs on 9 February in Lambeth29 and ran until 16 March in Sandwell.30 These interventions showed success in slowing the growth of this variant in April, apparent in figure 8, before exponential growth was again observed in June. The primary limiting factor for the analysis conducted is geographic reporting bias, with the North West observing the highest proportion of laboratories reporting diagnostic RT-PCR CT values with gene target data across the period of this study, which can be seen in figure 9. Conversely, the lowest levels of coverage have been observed in the South West, East of England and East Midlands. However, this geographic bias is temporally variable as changes in laboratory capabilities evolve over the pandemic.
Figure 9.
A map of the proportion of RT-PCR tests with gene target data by English region from October 2020 to July 2021.
We observe in online supplemental appendix C that exponential growth in triple-positive cases was initially seen in February within the Indian ethnicity group, which was due to importations of the B.1.617.2 variant. Growth in this group has subsequently declined and we can see from our results in early April that B.1.617.2 has now been largely sustained in the white and black British ethnicity groups. This illustrates from April the variant was no longer dependent on importations to maintain exponential growth in England. Interestingly, we observe exponential growth in the Pakistani ethnicity group around the holiday of Ramadan and this is indicative of the significance of public and religious events in driving significant outbreaks of SARS-CoV-2, further exemplified by the Christmas period in the UK when we observed similar growth in the B.1.1.7 variant. We can discern that the first phase of the relaxation of the national lockdown in step 1a,23 the reopening of schools, appeared to have the earliest impact on London for triple-positive variant growth, although this region was already experiencing the beginnings of exponential growth prior to this step. Exponential growth was observed across all regions before the final easing of national restrictions in step 3. The earliest targeted local NPIs to contain B.1.617.2 variant began in Bolton on 30 March 202131 and on 14 May 2021 in Blackburn with Darwen,32 with further measures brought in later for these LTLAs. The targeted interventions showed some success in precluding triple-positive case growth in these areas, evidenced by online supplemental appendix D. Later interventions that targeted further LTLAs to limit the transmission of B.1.617.228 experienced limited success which is apparent, for instance, in Kirklees and Burnley (seen in online supplemental appendix D). Therefore, once transmission of the B.1.617.2 variant became more widespread in England, the efficacy of these targeted approaches including surge testing, vaccination campaigns and travel restrictions was limited. The East Midlands, which had the slowest prior growth of S dropout cases in December, had a subsequent wave of exponential growth in March that was not present or weakly observed in other regions. The high level of prevalence for SARS-CoV-2 now observed in England is facilitating sporadic growth of S dropout cases that can be seen in the North West, North East, South West and Yorkshire and the Humber, where it is growing from a very small baseline.
The implications for the strong growth in triple-positive cases followed by similar patterns in the hospitalisations are very significant for the implications of vaccine effectiveness. We presently observe significant growth in the younger age groups that have a low infection hospitalisation rate for SARS-CoV-2 infection33 and have only largely received one dose of a vaccine at the time of this study.34 Nonetheless, growth within the hospitalisations will be largely indicative of the demographic groups where infections are primarily concentrated at that time. Significantly, we observe early trends from late March in the largely doubly vaccinated, over-65-year-old groups, which is now particularly pronounced in the 75–84 group where we can observe a doubling time of almost 4 days. The regions that are seeing the most concerning growth in triple-positive hospitalisations are the North West, North East and South East, which is very much in line with where we observed the earlier growth in positive cases, although it is now evident that the variant is in exponential growth throughout England.
We can observe in figure 7 that the Rt number showed some growth in the B.1.1.7-attributed infections in March when overall incidence began to initially surge across England in reaction to step 1a. However, since this time it has hovered around 0.8 and we observe largely exponential decay across the country, with some sporadic growth evidenced by the regional analysis in online supplemental appendix B. If Rt continues to be <1 then transmission of this variant within England is likely to decay to insignificance. There is believed to be an increased risk of within-household transmissibility of 60% for B.1.617.227 relative to B.1.1.7. Similarly, we find a transmission advantage for B.1.617.2, with the mean difference for Rt found in this study to be 0.45.
Conclusion
To conclude, the sustained exponential growth in cases of sequenced B.1.617.2 and the exponential decay of other triple-positive variants illustrate that this variant now causes most of the RT-PCR triple-positive case transmission in England. The reduction in the exponential decay rate for confirmed triple-positive variant cases in February 2021 indicates that B.1.617.2 appeared quite a lot earlier than the first confirmed case in March and the relaxation of NPIs coincided with exponential growth in this variant. We can see that growth of B.1.617.2 was initially concentrated in the LTLAs Bolton and Blackburn with Darwen in the North West. However, regional analysis suggested earlier and greater geographic dispersion with Yorkshire and the Humber, the East of England and London experiencing the earliest exponential growth for B.1.617.2-attributed hospitalisations. The B.1.617.2 variant has now spread across the country with a doubling time of 8 (95% CI 6.9 to 9.1) days for hospitalisations. The study illustrates a substantial transmission advantage for the B.1.617.2 variant relative to B.1.1.7 and we estimate the reproduction number advantage is around 0.45. There have been small indications of growth in B.1.1.7 with Rt above 1 in March, which was in line with temporal increases observed for B.1.617.2 but it is now clear that there has been a replacement of the predominant B.1.1.7 variant. We have observed some worrying trends in B.1.351 although it has failed to gain traction and a sustained enough period of growth for this variant to become a substantial public health concern.
Supplementary Material
Footnotes
Contributors: TW conceived the idea of the article. TW wrote the article. TW, LP, IH, FX and AG developed the model methodology. AG and TW created the graphical representations. LP, AJ, TW and IH reviewed the final draft. TW is the guarantor of the paper.
Funding: The authors have not declared a specific grant for this research from any funding agency in the public, commercial or not-for-profit sectors.
Map disclaimer: The depiction of boundaries on this map does not imply the expression of any opinion whatsoever on the part of BMJ (or any member of its group) concerning the legal status of any country, territory, jurisdiction or area or of its authorities. This map is provided without any warranty of any kind, either express or implied.
Competing interests: None declared.
Patient and public involvement: Patients and/or the public were not involved in the design, or conduct, or reporting, or dissemination plans of this research.
Provenance and peer review: Not commissioned; externally peer reviewed.
Supplemental material: This content has been supplied by the author(s). It has not been vetted by BMJ Publishing Group Limited (BMJ) and may not have been peer-reviewed. Any opinions or recommendations discussed are solely those of the author(s) and are not endorsed by BMJ. BMJ disclaims all liability and responsibility arising from any reliance placed on the content. Where the content includes any translated material, BMJ does not warrant the accuracy and reliability of the translations (including but not limited to local regulations, clinical guidelines, terminology, drug names and drug dosages), and is not responsible for any error and/or omissions arising from translation and adaptation or otherwise.
Data availability statement
Data are available upon reasonable request. To access the data used for this study, an application can be made to Public Health England, Department of Health and Social Care. Data requests can be made to the Office for Data Release (https://www.gov.uk/government/publications/accessing-public-health-england-data/about-the-phe-odr-and-accessing-data) and contacting odr@phe.gov.uk. All requests to access data are reviewed by the ODR and are subject to strict confidentiality provisions in line with the requirements of the common law duty of confidentiality, data protection legislation (including the General Data Protection Regulation), 8 Caldicott principles, the Information Commissioner’s statutory data-sharing code of practice and the national data opt-out programme.
Ethics statements
Patient consent for publication
Not required.
Ethics approval
This study was conducted in line with national data regulations. It only employed and accessed fully anonymised population-level data from Public Health England in a secure research environment.
References
- 1. WHO . “Archived: WHO Timeline - COVID-19,”. Geneva, 2020. [Google Scholar]
- 2. Wang R, Hozumi Y, Zheng Y-H, et al. Host immune response driving SARS-CoV-2 evolution. Viruses 2020;12:1095. 10.3390/v12101095 [DOI] [PMC free article] [PubMed] [Google Scholar]
- 3. Jo WK, Drosten C, Drexler JF. The evolutionary dynamics of endemic human coronaviruses. Virus Evol 2021;7:veab020. 10.1093/ve/veab020 [DOI] [PMC free article] [PubMed] [Google Scholar]
- 4. Yin C. Genotyping coronavirus SARS-CoV-2: methods and implications. Genomics 2020;112:3588–96. 10.1016/j.ygeno.2020.04.016 [DOI] [PMC free article] [PubMed] [Google Scholar]
- 5. Department of Health and Social Care, . “Further measures in additional areas to tackle Delta (B1.617.2) variant,” 8 6, 2021. Available: https://www.gov.uk/government/news/further-measures-in-additional-areas-to-tackle-delta-b16172-variant
- 6. Kucharski A, Davies N, Eggo R. “Dynamics of B.1.617.2 in England NHS regions from importations, traveller-linked and non-traveller-linked transmission,” Report for SPI-M, 2021. Available: https://assets.publishing.service.gov.uk/government/uploads/system/uploads/attachment_data/file/993232/S1272_LSHTM_Modelling_Paper_B.1.617.2.pdf
- 7. Department of Health and Social Care, . “UK COVID-19 vaccines delivery plan,”, 2021. Available: https://www.gov.uk/government/publications/uk-covid-19-vaccines-delivery-plan/uk-covid-19-vaccines-delivery-plan#prioritisation-1
- 8. Pottegård A, Lund LC, Karlstad Ø., et al. thrombocytopenia, and bleeding after vaccination with Oxford-AstraZeneca ChAdOx1-S in Denmark and Norway: population based cohort study,” BMJ 2021;373. vol.. [DOI] [PMC free article] [PubMed] [Google Scholar]
- 9. Madhi S, Baillie V, Cutland CL, et al. Efficacy of the ChAdOx1 nCoV-19 Covid-19 Vaccine against the B.1.351 Variant,” The New England Journal of Medicine, vol. 384, no 2021. pp.:1885–98. [DOI] [PMC free article] [PubMed]
- 10. Ferreira I, Datir R, Kemp S. (INSACOG) and T. C.-N. B. COVID-19, “ SARS-CoV-2 B.1.617 emergence and sensitivity to vaccine-elicited antibodies,”. BioRxiv 2021:2021.05.08.443253. [Google Scholar]
- 11. Hoffmann M, Hofmann-Winkler H, Krüger N. “SARS-CoV-2 variant B.1.617 is resistant to Bamlanivimab and evades antibodies induced by infection and vaccination. bioRxiv 2021. [DOI] [PMC free article] [PubMed] [Google Scholar]
- 12. Planas D, Veyer D, Baidaliuk A. “Reduced sensitivity of infectious SARS-CoV-2 variant B.1.617.2 to monoclonal antibodies and sera from convalescent and vaccinated individuals,”. Biorxiv 2021. [Google Scholar]
- 13. Bernal JL, Andrews N, Gower C. “Effectiveness of COVID-19 vaccines against the B.1.617.2 variant,”. medRxiV 2021. [DOI] [PubMed] [Google Scholar]
- 14. Public Health England, “Variants: distribution of cases data,”. Available: https://www.gov.uk/government/publications/covid-19-variants-genomically-confirmed-case-numbers/variants-distribution-of-cases-data [Accessed 12 May 2021].
- 15. Public Health England, “SARS-CoV-2 variants of concern and variants under investigation in England,”. Available: https://assets.publishing.service.gov.uk/government/uploads/system/uploads/attachment_data/file/984274/Variants_of_Concern_VOC_Technical_Briefing_10_England.pdf [Accessed 7 May 2021].
- 16. Wood S. Generalized additive models. New York: Chapman and Hall/CRC, 2017. [Google Scholar]
- 17.pp. Wood S. “Mixed GAM computation vehicle with GCV/AIC/REML smoothness estimation and GAMMs by REML/PQL,” R package version, 2018: 1–8. https://stat.ethz.ch/R-manual/R-devel/library/mgcv/html/mgcv-package.html [Google Scholar]
- 18. Wood S. “Generalized Additive Models: an introduction with R,”. CRC, 2006. [Google Scholar]
- 19. Eilers PHC, Marx BD. Flexible smoothing with B-splines and penalties. Statistical Science 1996;11:89–121. 10.1214/ss/1038425655 [DOI] [Google Scholar]
- 20. Wood SN. Thin plate regression splines. JRStatistSocB 2003;65:95–114. 10.1111/1467-9868.00374 [DOI] [Google Scholar]
- 21. Duchon J. “Splines minimizing rotation-invariant semi-norms in Solobev spaces,. In: Construction theory of functions of several variables. Berlin: Springer, 1977: 85–100. [Google Scholar]
- 22. Pellis L, Scarabel F, Stage H, et al. “Challenges in control of Covid-19: short doubling time and long delay to effect of interventions,”. Philosophical Transactions of the Royal Society,, 2021. [DOI] [PMC free article] [PubMed] [Google Scholar]
- 23. Cabinet Office, “COVID-19 Response - Spring 2021 (Summary),”, 2021. Available: https://www.gov.uk/government/publications/covid-19-response-spring-2021/covid-19-response-spring-2021-summary#step-1-8-and-29-march
- 24. Cori A, Ferguson NM, Fraser C, et al. A new framework and software to estimate time-varying reproduction numbers during epidemics. Am J Epidemiol 2013;178:1505–12. 10.1093/aje/kwt133 [DOI] [PMC free article] [PubMed] [Google Scholar]
- 25. Reed IG, Walker ES, Landguth EL. SARS-CoV-2 serial interval variation, montana, USA, March 1-July 31, 2020. Emerg Infect Dis 2021;27:1486–91. 10.3201/eid2705.204663 [DOI] [PMC free article] [PubMed] [Google Scholar]
- 26. Ward T, Johnsen A. Understanding an evolving pandemic: an analysis of the clinical time delay distributions of COVID-19 in the United Kingdom. PLoS One 2021;16:e0257978. 10.1371/journal.pone.0257978 [DOI] [PMC free article] [PubMed] [Google Scholar]
- 27. Public Health England, “Confirmed cases of COVID-19 variants identified in UK,”, 2021. Available: https://www.gov.uk/government/news/confirmed-cases-of-covid-19-variants-identified-in-uk
- 28. Department of Health and Social Care . “Further measures in additional areas to tackle Delta (B1.617.2) variant,”, 2021. Available: https://www.gov.uk/government/news/further-measures-in-additional-areas-to-tackle-delta-b16172-variant
- 29. Department of Health and Social Care, . “Surge testing to be deployed in areas around Lambeth in connection to new variant,”, 2021. Available: https://www.gov.uk/government/news/surge-testing-to-be-deployed-in-areas-around-lambeth-in-connection-to-new-variant
- 30. Department of Health and Social Care . “Surge testing to be deployed in targeted areas in Sandwell,”, 2021. Available: https://www.gov.uk/government/news/surge-testing-to-be-deployed-in-targeted-areas-in-sandwell
- 31. Department of Health and Social Care . “Surge testing to be deployed in targeted areas in Bolton,”, 2021. Available: https://www.gov.uk/government/news/surge-testing-to-be-deployed-in-targeted-areas-in-bolton
- 32. Department of Health and Social Care . “Surge testing to be deployed in Blackburn with Darwen,”, 2021. Available: https://www.gov.uk/government/news/surge-testing-to-be-deployed-in-blackburn-with-darwen
- 33. Birrell P, Blake J, E. vL, Group and D. D. Angelis M. B. U. C.-1. W . “COVID-19: nowcast and forecast,”, 2021. Available: https://www.mrc-bsu.cam.ac.uk/now-casting/nowcasting-and-forecasting-15th-july-2021/
- 34. Public Health England, “COVID-19 vaccination first phase priority groups,”, 2021. Available: https://www.gov.uk/government/publications/covid-19-vaccination-care-home-and-healthcare-settings-posters/covid-19-vaccination-first-phase-priority-groups
Associated Data
This section collects any data citations, data availability statements, or supplementary materials included in this article.
Supplementary Materials
bmjopen-2021-056636supp001.pdf (2.1MB, pdf)
Data Availability Statement
Data are available upon reasonable request. To access the data used for this study, an application can be made to Public Health England, Department of Health and Social Care. Data requests can be made to the Office for Data Release (https://www.gov.uk/government/publications/accessing-public-health-england-data/about-the-phe-odr-and-accessing-data) and contacting odr@phe.gov.uk. All requests to access data are reviewed by the ODR and are subject to strict confidentiality provisions in line with the requirements of the common law duty of confidentiality, data protection legislation (including the General Data Protection Regulation), 8 Caldicott principles, the Information Commissioner’s statutory data-sharing code of practice and the national data opt-out programme.


