Abstract
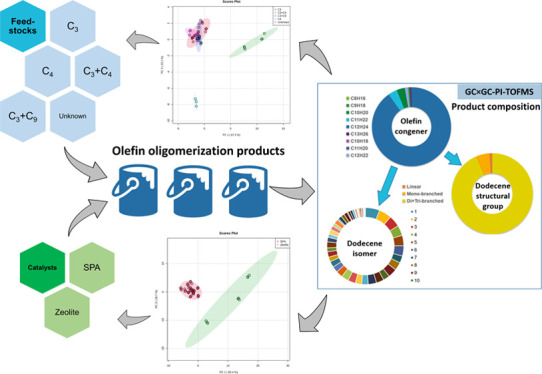
Catalyzed light olefin oligomerization is widely used in petrochemical industries to produce fuels and chemicals. Light olefins such as propene and butenes are commonly selected as feedstocks. Solid phosphoric acid (SPA) and zeolite are representative acidic catalysts. Both the feedstocks and catalysts have an impact on the product composition. In this study, state-of-the-art instrumentation two-dimensional gas chromatography (GC × GC) coupled photoionization—time of flight mass spectrometry was employed to investigate the composition of dodecene products produced from olefin oligomerization. Information such as the olefin congener distribution, dodecene structural subgroup distribution, and individual dodecene isomers was obtained and utilized in the statistical analyses. By using specific data sets of the product composition, the distinguishment between SPA and zeolite catalysts as well as among the feedstocks was achieved by applying the unsupervised screening approaches (principal component analysis and hierarchical clustering analysis). The potential indicators of catalysts and feedstocks were selected by the feature selection methods (univariate analysis: analysis of variance and multivariate analysis: partial least squares-discriminant analysis).
1. Introduction
Since Ipatieff published his initial discoveries on the oligomerization of light olefins over the phosphoric acid catalyst in 1935,1,2 catalyzed oligomerization has been widely used to produce fuels, principally gasoline, as well chemicals.3 Oligomerization of light olefin feedstocks such as propene and butene is the process to manufacture dodecenes in petrochemical industries. Some dodecenes are produced by recycling nonene to the reactor to react with propene. The catalysts that are commonly used in the olefin oligomerization process are generally classified into two types, acidic catalysts and metal-based catalysts.3 Solid phosphoric acid (SPA), formed by combining phosphoric acid and a silica source,3 and zeolite, a special class of microporous silica-alumina mineral,4 are representative acidic catalysts.5−7 The catalytic olefin oligomerization follows standard conditions. The condition parameters are slightly adjusted depending on the feedstock and final product requirement.8 In this study, dodecenes are prepared under typical oligomerization conditions with a pressure of 65 bar and a temperature of 180 °C. A distillation fraction in the temperature range of 185–205 °C is collected as the final dodecene product. Due to the complexity of the oligomerization mechanisms, the products may consist primarily of olefins from straight oligomerization and mixtures of paraffins, olefins, cycloalkanes, and aromatics from conjunct polymerization.9 The dodecene products in this study are very complex mixtures containing C8–18 linear and branched alkenes.10 However, cyclic hydrocarbons are not likely to be produced in the oligomerization process at low reaction temperatures.1,6 Both the feedstock and the catalyst can affect the composition and isomer distribution of the final dodecene products.3,10 The variation in the composition leads to differences in the product properties and further affects its end-use.
The ability to characterize the oligomerization products has been the bottleneck holding back the development of novel catalysts in petrochemical industries.3 Gas chromatography (GC) techniques play a very important role in the understanding of oligomerization product composition. Conventional one-dimensional (1D) GC coupled to electron ionization (EI) mass spectrometry (MS) encountered many difficulties in the separation of such complex mixtures and the identification of structural isomers. The state-of-the-art 2D gas chromatography (GC × GC) coupled to EI time of flight MS (TOFMS) was first applied in characterizing the catalyst-oligomeric products by van der Westhuizen and coworkers.11 Many compounds were molecularly identified in the C8 region.11 However, the same information is not available for longer carbon chain regions.3 Our previous study developed a method to unravel the molecular details of dodecene products by using the promising instrumental combination of GC × GC and photoionization (PI) TOFMS.10 That work demonstrated that the enhanced peak capacity and superior separation power of GC × GC made it possible to resolve the dodecene isomers by 2D chromatographic space. Moreover, PI, the soft ionization technique, enabled the identification/prediction of isomer structures by the enhanced molecular ion intensity and informative fragmentation patterns.10
In this study, the global information of dodecene products (triplicated measurements) is obtained using our previously developed GC × GC–PI–TOFMS approach.10 The information includes the distributions of olefin congeners according to the carbon chain length and double bond equivalent (DBE) (calculated from valence values of elements contained in the formula, e.g., an element with x valence contributes with x – 2 to the DBE value), the distributions of dodecene structural subgroups, such as linear dodecene, monobranched isomers, and highly branched isomers, and the distributions of individual dodecene isomers. The goals of this study are (1) to understand the difference of compositions of the distillation fractions from the olefin oligomerization process, (2) to utilize appropriate data sets to differentiate dodecene products from the feedstock and catalyst by various statistical analyses, and (3) to discover the potential indicators for the distinguishment of the dodecene production pathways.
2. Results and discussion
2.1. Distillation Fractions from Olefin Oligomerization Products
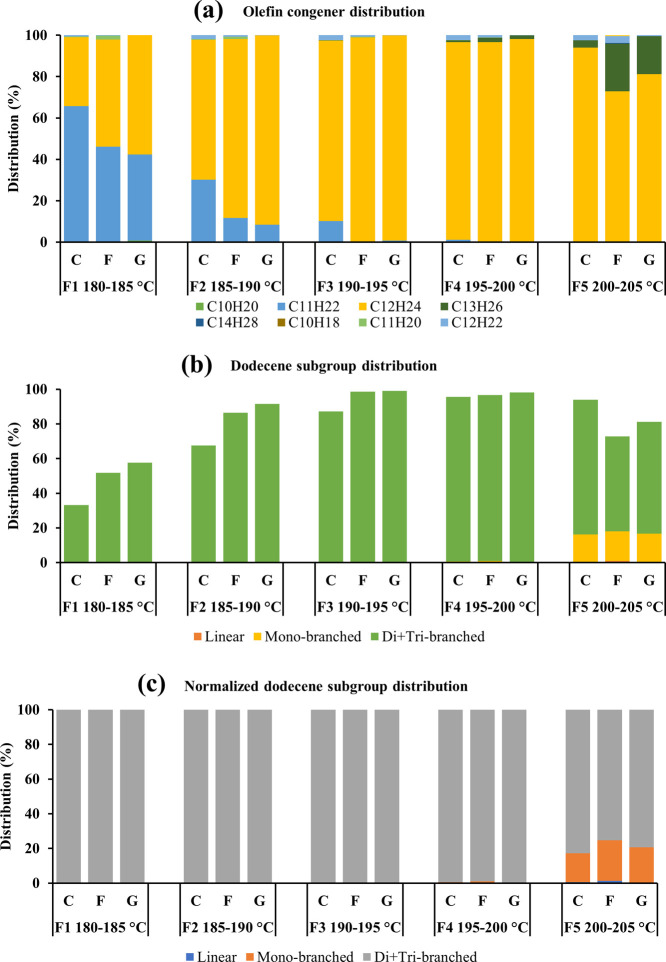
The distillation fractions (F1–F5) in the temperature ranges 180–185, 185–190, 190–195, 195–200, and 200–205 °C (200–202 °C for sample F) of samples C, F, and G were analyzed using the method described in Section 2.2. The olefin congener distributions and dodecene subgroup distributions were calculated accordingly (Figure 1). The distribution of dodecenes increased rapidly from 33.2 to 95.6% between 180 and 200 °C (F1–F4) in sample C and increased from 51.8 to 99.1% between 180 and 195 °C (F1–F3) in samples F and G. Then, it slightly decreased to 72.9–93.2% until the final distillation temperature was 205 °C (F5). The dodecenes were produced in all the fractions, and the contribution of dodecenes reached above 95% at 195–200 °C in sample C and at 190–200 °C in samples F and G. The share of undecenes dropped from 41.6–65.5 to 0.0% along with the temperature. The presence of undecenes was almost neglectable (below 1.1%) above 195 °C. While the tridecenes showed their presence above 190 °C, their contribution rose to 3.6–23.1% with the increase in the distillation temperature (Figure 1a). In general, all the distillation fractions except for F1 of sample C had dodecenes as the primary olefin congener (distribution over 50.0%). As compared with monoolefins, diolefins contributed a very small share of the total dodecene products (Figure 1a). The distribution of dodecenes was observed the highest in sample G and the lowest in sample C between 180 and 200 °C. On the contrary, the distribution of undecenes was the highest in sample C and the lowest in sample G. The mixture of the C3 + C4 feedstock and zeolite catalyst of sample C may be responsible for the preference of producing undecenes instead of dodecenes as compared with samples F and G, which were produced from the C3-only feed and SPA catalyst.
Figure 1.
Distributions of the olefin congeners (a), dodecene subgroups (b), and normalized dodecene subgroups (c) in the distillation fractions of samples C, F, and G.
Figure 1b shows the dodecene subgroup distribution in the dodecene products. Di- + tribranched isomers, as the dominant subgroup of dodecenes, were produced in all of the fractions. Because the boiling points of highly branched isomers are lower than those of linear isomers, di- + tribranched isomers are recovered at the beginning of the distillation when the temperature was 180 °C. The increasing distribution of di- + tribranched isomers along the temperature followed the same trend as dodecenes. The distribution of di- + tribranched isomers increased rapidly from 33.2 to 95.0% between 180 and 200 °C in sample C and from 51.8 to 99.1% between 180 and 195 °C in samples F and G. After that, it gradually decreased to 54.8–77.7% at the final temperature of 205 °C. The di- + tribranched isomers accounted for over 95.0% in F3 and F4, except for F3 of sample C. The distribution of di- + tribranched isomers was higher in sample G and lower in sample C in F1-4 (Figure 1b). This order is the same as the dodecene distribution because 100% (F1–3) and 99.0–99.6% (F4) of dodecenes were contributed by di- + tribranched isomers (Figure 1a,c). Monobranched isomers showed their presence when the temperature reached 195–200 °C (F4). Its distribution increased rapidly up to 17.1% between 200 and 205 °C, which indicated that the monobranched isomer distillation temperature was above 200 °C. Linear dodecenes were distilled at an even higher temperature. Very little to neglectable share of linear dodecenes was observed between 200 and 205 °C for samples C, F, and G.
As seen from the dodecene subgroup distribution in normalized dodecenes, the contribution of di- + tribranched isomers decreased and that of monobranched and linear isomers increased when increasing the distillation temperature (Figure 1c). This is consistent with previous studies of butene oligomerization, which also found that higher temperature tends to reduce the concentration of highly branched isomers from the consideration of thermal equilibrium.12,13 There was no big difference in the contribution of the di- + tribranched subgroup among samples C, F, and G. Therefore, the feedstock composition and the catalyst did not show much impact on the di- + tribranched subgroup distribution within the same distillation temperature. The share of the monobranched subgroup was slightly higher in samples F and G than sample C in F5, which suggested that the C3-only feed and SPA catalyst favored the production of monobranched isomers. However, these aspects will be discussed in greater detail in the ensuing sections.
2.2. Comparison of SPA and Zeolite Catalysts Based on Olefin Congener Distribution
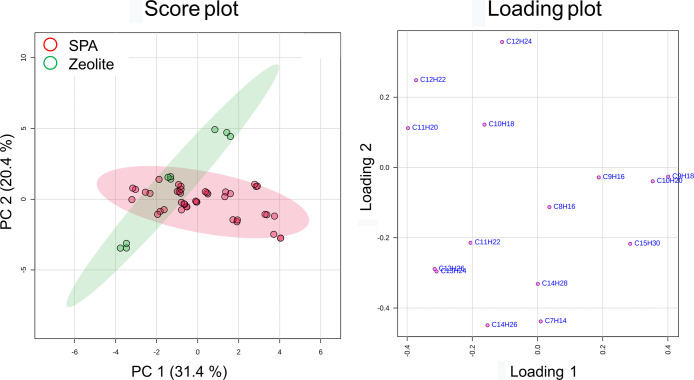
The olefin congeners in the 17 dodecene products were ranged from carbon number 7–15, with a majority of monoolefins and a minority of diolefins. The overall dodecene distribution was 60.9–89.3%. The peak volumes of the olefin congeners were used to plot principal component analysis (PCA) scores and loadings (Figure 2). There was a clustering trend between SPA and zeolite groups. However, the two groups cannot be completely separated by the top two principal components (PC1 and PC2, explaining 51.8% of the variances). The SPA group is widely spread on PC1 rather than on PC2, while the zeolite group showed a larger variation on PC2. The concentration of dodecene, which played an important role in PC2, was much more constant in the SPA group than in the zeolite group. Using hierarchical clustering analysis (HCA) also cannot differentiate the SPA group and zeolite group (Figure S1a). The potential features that were significantly different between the two catalyst groups were C8H16, C12H22, C11H22, C12H24, and C9H16 identified by the univariate analysis T-test with a p-value threshold of 0.05. Partial least squares-discriminant analysis (PLS-DA) also identified the same important features with a variable importance of projection (VIP) score higher than 1. The average normalized intensities of C8H16, C12H22, and C12H24 were higher in zeolite, while the average normalized intensities of C11H22 and C9H16 were higher in SPA (Figure S2). Assume that the PI efficiencies of different olefin congeners do not have a significant difference; this phenomenon was partially similar to the results by Nicholas and coworkers. They observed that the MTW zeolite (a 1D 12-membered ring zeolite) catalyst produced slightly higher molecular weight products than the SPA catalyst under the same oligomerization condition.14
Figure 2.
PCA plots of the 17 dodecene products according to the catalysts using the data set of olefin congeners. The x-axis and y-axis in the score plot are principal components 1 and 2, explaining 51.5% of the variation among samples. The axes of the loading plot showed how the olefin congeners influence PC1 and PC2.
2.3. Comparison of SPA and Zeolite Catalysts Based on Dodecene Subgroup Distribution
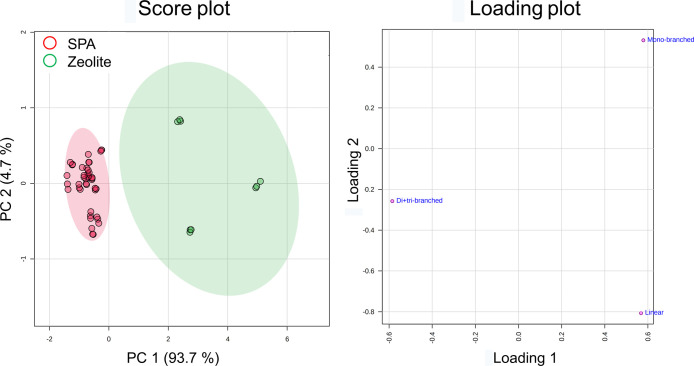
The products of light olefin oligomerization are normally enriched in highly branched olefins.15 In this study, the dominant dodecene subgroup was di- + tribranched isomers, which contributed 86.8–99.1% in normalized dodecenes and 60.2–87.3% in the products. By using the peak volumes of dodecene subgroups, a significant clustering trend between SPA and zeolite groups was demonstrated by PCA scores (Figure 3) and HCA (Figure S1b). PC1 was responsible for the differentiation of the two groups. The SPA catalyst produced a higher proportion of highly branched dodecenes, namely di- + tribranched isomers (97.5–99.0% in normalized dodecenes), than zeolite (85.7–93.5% in normalized dodecenes); the zeolite catalyzed products consisted of more linear dodecenes (0.7–2.8% in normalized dodecenes) and monobranched isomers (5.4–11.6% in normalized dodecenes) than SPA (0.1–0.4 and 0.9–2.3%, respectively, for linear and monobranched isomers). A previous study summarized the correlation between the catalysts and the molecular structure of the products.3 The characteristics of olefin oligomerization products were compared against the geometric surface area of the pore opening of the catalysts. Different zeolite catalysts have a wide range of micropore sizes (<2 nm) and can be highly constrained (small pore opening) to less constrained (big pore opening). The SPA catalyst, however, is a much less constrained solid, having pore sizes in the meso- (2–20 nm) and macropore range (>2 nm). Smaller pore diameters lead to more linear products and less branching. Therefore, the differences in pore size distribution between SPA and zeolite can explain why zeolites produce more linear isomers relative to SPA, whereas SPA produces more highly branched isomers.3 Moreover, the substitution around the double bond was also affected by the pore opening. Nicholas and coworkers observed that in the C8 region, the proportion of one type of disubstituted olefin and trisubstituted olefin decreased with increasing pore opening.16 The nuclear magnetic resonance spectroscopy results showed that C8 region olefins produced by the MTW zeolite were more branched on the double bond than those of SPA. The number of quaternary carbons and the ratio of olefinic quaternary carbon to total olefins were significantly higher in the MTW zeolite product.14
Figure 3.
PCA plots of the 17 dodecene products according to the catalysts using the data set of dodecene subgroups. The principal components 1 and 2 explain 98.4% of the variation of samples. The loading plot showed how the dodecene subgroups influence PC1 and PC2.
2.4. Comparison of SPA and Zeolite Catalysts Based on Dodecene Isomers
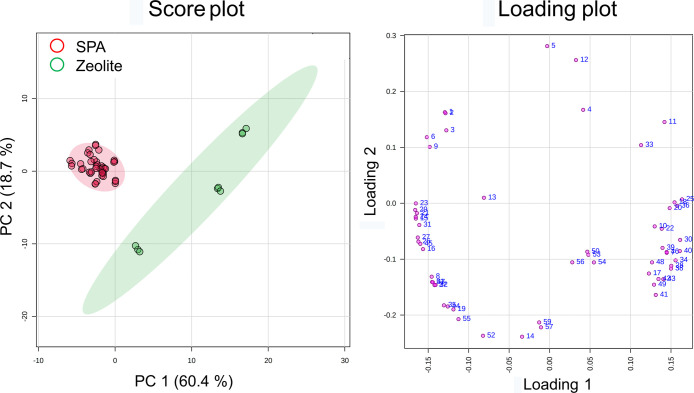
Because the data set of dodecene subgroups presented a clear trend on distinguishing the catalysts, an in-depth investigation was conducted using the data set of individual dodecene isomers. The dodecene isomers were selected in the following steps. First, 61 common peaks located in the retention time (RT) band of dodecenes were observed in the 17 dodecene products. Three peaks were then eliminated because they were not dodecene isomers as confirmed by the PI mass spectra. Eventually, 58 peaks were taken into consideration in statistical analyses. However, their chemical structures were not identified prior to statistical analyses. The PCA scores illustrated a significant clustering trend of two catalyst groups (Figure 4). The dodecene products in the SPA group were accumulated to the left side of PC1. Three dodecene products in the zeolite group were widely spread on PC1 and PC2.
Figure 4.
PCA plots of the 17 dodecene products according to the catalysts using the data set of dodecene isomers. The score plot showed that principal components 1 and 2 can explain 79.1% of the variation. The loading plot presented how the 58 dodecene isomers influence PC1 and PC2.
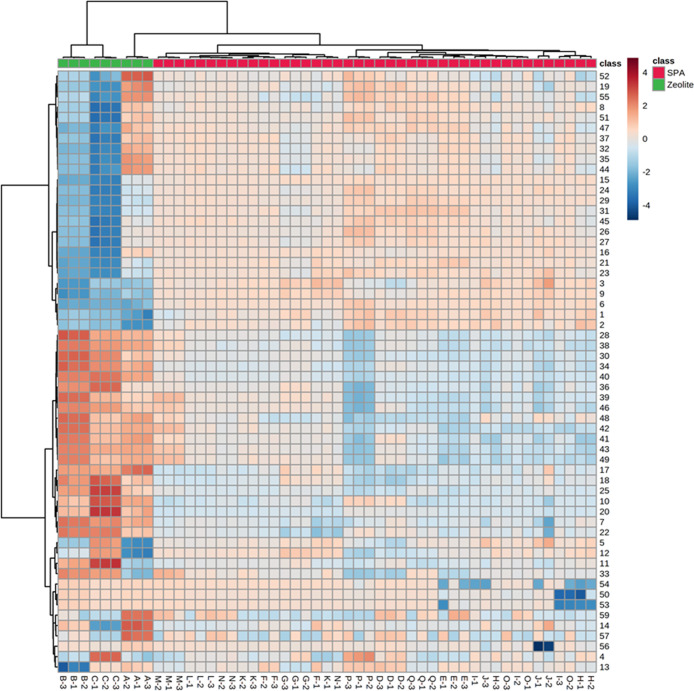
The heat map presented the same cluster discrimination between the catalysts as PCA. In addition, 58 dodecene isomers were also divided into two clusters (Figure 5). The upper cluster in the heat map included 25 dodecene isomers with the 1st dimension retention time (1RT) range of 32.6–44.0 min. According to the 1RT boundary between monobranched and di- + tribranched subgroups of 50.3 min,10 these isomers were highly branched ones in the di- + tribranched subgroup. As seen from the heat map, the concentrations of the dodecene isomers from the upper cluster were higher in the SPA group and lower in the zeolite group. This agrees with Nicholas’ work, which stated that SPA produced more highly branched isomers than zeolite because of its characteristic of unconstrained solid.3 The lower cluster in the heat map included 33 dodecene isomers with a wide 1RT range of 29.9–56.9 min. This cluster contained 2 linear dodecenes (1RT > 55.2 min), 11 monobranched isomers (50.3 min < 1RT < 55.2 min), and 20 di- + tribranched isomers (1RT < 50.3 min). Fifteen isomers in the di- + tribranched subgroup were relatively less branched with 1RT higher than 44.4 min, and the rest five isomers were most likely the highly branched ones with 1RT lower than 42.4 min. Therefore, all the linear dodecenes and most of the less branched isomers contributed a higher share in the zeolite group. It is because zeolite has a smaller pore opening, and hence, it favors the production of linear and less branched isomers. In contrast, the unconstrained solid, SPA, favors the production of highly branched dodecene isomers.3
Figure 5.
Heat map of the 17 dodecene products using the data set of dodecene isomers to differentiate the catalysts. The horizontal axis shows the sample names, and the vertical axis shows the numbers of the 58 dodecene isomers.
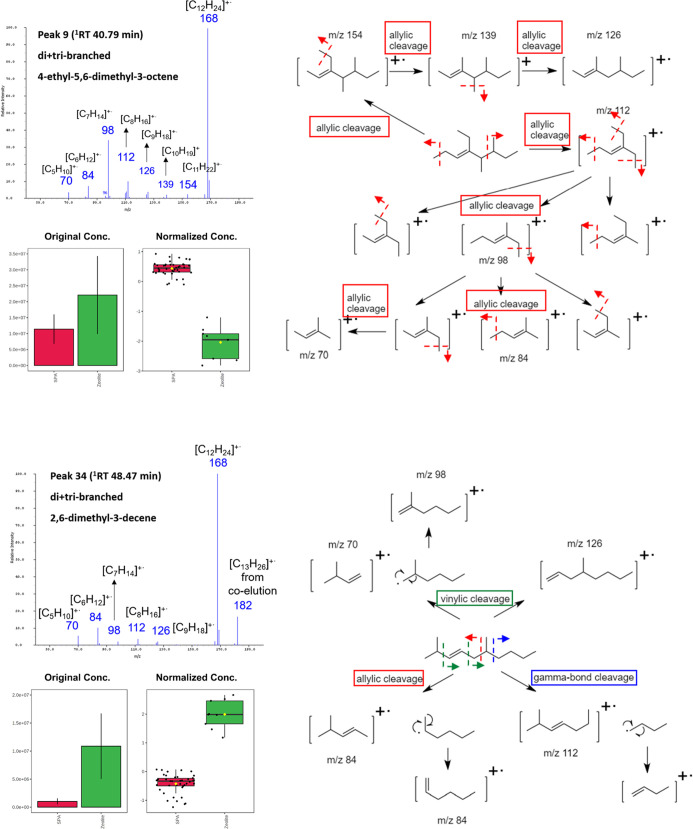
The T-test with a p-value threshold of 0.05 selected 48 potential significant features to discriminate between the 2 catalyst groups. The top six important features identified by PLS-DA (VIP score over 1.3) were consistent with the T-test result. The six important features included one from the monobranched group and five from the di- + tribranched group identified by their 1RT. Due to the shortage of available dodecene isomer standards and reference retention indices (RIs), their molecular structures were predicted solely by the PI mass spectra. They were, respectively, 6-ethyl-4-decene, 2,6-dimethyl-3-decene, 3,7-dimethyl-4-decene, 3,8-dimethyl-4-decene, 5-ethyl-7-methyl-4-nonene, and 4-ethyl-5,6-dimethyl-3-octene (Figure S3). As a soft ionization technique, PI showed significantly improved intensity of molecular ions. Moreover, the distinct and informative fragment patterns among the dodecene isomers assisted us to predict the locations of double bonds and branches.10 The predominant fragmentation pathway of olefins is allylic cleavage, which is the cleavage of the allylic bond between α-C and β-C.17,18 Take 2,6-dimethyl-3-decene as an example, the allylic cleavage produced two fragment ions [C6H12]+• (m/z 84) (Figure 6). Therefore, m/z 84 was the most abundant fragment ion. Besides allylic cleavage, vinylic and γ-cleavage could also occur in alkenes. However, the fragment ions produced by vinylic and γ-cleavage are not as abundant as that from allylic cleavage.19 Therefore, the relative intensities of fragment ions m/z 70, 98, and 126 (from vinylic cleavage) and m/z 112 (from γ-cleavage) were lower than m/z 84. In the mass spectrum of 4-ethyl-5,6-dimethyl-3-octene, the intensity of m/z 98 was about three times higher than m/z 112 (Figure 6). This is because the fragment ion [C8H16]+• (m/z 112) from the first allylic cleavage underwent a second allylic cleavage. The three possible fragments from the second allylic cleavage all contained seven C atoms, which showed as m/z 98 in the mass spectrum. The concentrations of higher 1RT isomers, 6-ethyl-4-nonene and 2,6-dimethyl-3-decene, were higher in the zeolite group. The concentrations of the rest four isomers with lower 1RT were higher in the SPA group (Figures 6 and S3). These six important isomers could be used as indicators to distinguish the catalysts used in the olefin oligomerization process.
Figure 6.
PI mass spectra and predicted fragmentation pathways of 2,6-dimethyl-3-decene and 4-ethyl-5,6-dimethyl-3-octene and the comparison of their intensities in two catalyst groups.
2.5. Comparison of the Feedstocks Based on Olefin Congener Distribution
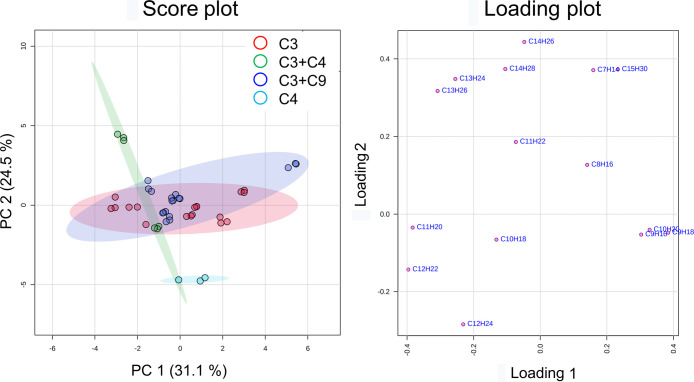
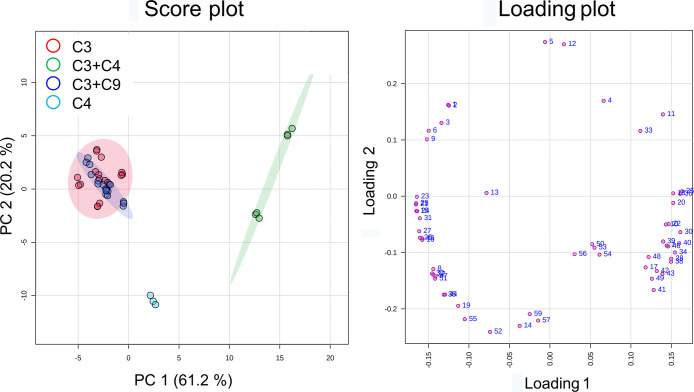
The 17 dodecene products under study included 15 samples representing 4 kinds of feedstocks and 2 samples representing unknown feedstocks. Excluding the unknown feedstock samples, PCA scores of the data set of olefin congeners showed that the C4 group was significantly differentiated from the rest of the samples. However, C3 and C3 + C9 groups were highly overlapped. The C3 + C4 group cannot be significantly separated from the C3 and C3 + C9 groups (Figure 7). One-way ANOVA with a p-value threshold of 0.001 identified that the olefin congeners, C11H22, C7H14, C14H26, and C8H16, were important features. They presented differences among the four kinds of feedstocks. Tukey’s honestly significant difference (HSD) implied that C11H22 and C7H14 were significantly lower in the C4 group than the others. C14H26 was significantly higher in the C3 + C4 group than the rest. The C4 group was significantly differentiated from the C3 group by C8H16 (Table S1 and Figure S4).
Figure 7.
PCA plots of the 15 dodecene products according to the feedstocks using the data set of olefin congeners. The axes of the score plot present principal components 1 and 2 that explain 55.6% of the variation among different feedstocks. The axes of the loading plot showed how the olefin congeners influence PC1 and PC2.
Because dodecene is the primary component of the products, achieving high dodecene content is the goal of feedstock and catalyst selection and oligomerization condition optimization. The feed composition has a certain effect on the final product as studied in the oligomerization over SPA.20,21 The C12H24 content was significantly (p < 0.01) higher in the C4 group than the C3 and C3 + C9 groups (Figure S4), which implied that the C4-only feedstock had higher selectivity of dodecene under the same oligomerization condition. This can be explained by the reactivity sequence for pure-compound oligomerization: isobutene > 1-butene > cis-2-butene > trans-2-butene > propene.21 The content of C12H24 produced by C4 was higher than that of C3 + C4, but the difference was not significant. There was also no significant difference between C3 and C3 + C4 groups. There is a study reporting that the presence of butenes can benefit the oligomerization of propene over liquid phosphoric acid.2 Butenes competitively adsorb on phosphoric acid, thereby preventing the stable esters to form on the active sites. Therefore, the oligomerization of propene can process normally.21 Some research also noted that the SPA catalyst productivities between the C3–C5 mixture and C4-only feeds were the same.21 There is research assuming that having the propene-derived dimers (C6) and trimers (C9) recycled to react with propene would boost the distillation production and increase the distillate yield.20 However, in this study, the content of C12H24 produced by C3 + C9 was slightly lower than C3. This phenomenon can be interpreted as follows. In the oligomerization of an olefin mixed feed over SPA, the shorter the olefins, the higher the conversion.20 It means that in our case, C3 was more reactive than the recycled C9. The shorter olefins, C3, would disrupt the oligomerization of naphtha-range olefin, C9. C3 would be the main carbocation source. To be specific, shorter olefins form phosphate esters that have higher stability. Therefore, there is less probability that longer olefins would have a reactive interaction with the catalyst.20
2.6. Comparison of the Feedstocks Based on Dodecene Subgroup Distribution
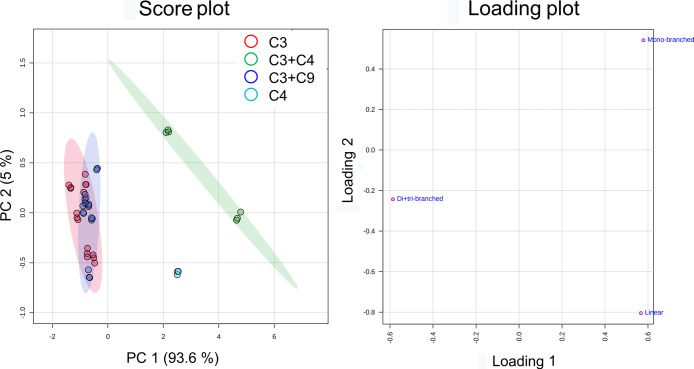
As seen from the PCA plots by the dodecene subgroup peak volumes, C4 and C3 + C4 groups were differentiated from the C3 and C3 + C9 groups. C3 and C3 + C9 clusters were highly overlapped (Figure 8). In general, the feedstock containing C4 is located on the right side of PC1, which is more abundant in linear and monobranched subgroups, while feedstock not containing C4 is located on the left side of PC1, which is more abundant in the di- + tribranched subgroup. One-way ANOVA and Tukey’s HSD indicated that there was a significant difference in dodecene subgroup distributions between the C4-containing groups and C4-not-containing groups (Table S2, Figure S5). However, the C4-containing groups used the zeolite catalyst, and the C4-not-containing groups used the SPA catalyst. We cannot conclude that the variation is governed solely by the difference of the catalysts or the feedstocks. As seen from the comparison within the zeolite groups, the C3 + C4 group contained significantly higher monobranched dodecene isomers and lower di- + tribranched dodecene isomers than the C4 group (Table S2 and Figure S5). This illustrated that the C4-only feedstock produced more highly branched isomers than the partially C4-containing feedstock. de Klerk and coworkers investigated the impact of adding propene into the butene feedstock on the quality of motor-gasoline, which is a hydrogenated olefin oligomerization product. They found that the productivity of the catalyst and the conversion of propene and butene did not change much with increasing propene content. However, the representative branching parameters, trimethylpentane and tetramethylbutane contents, of motor-gasoline decreased with the increasing propene content.21 This demonstrated that the addition of C3 in a C4 feedstock can decrease the production of highly branched olefins in the oligomerization process. Two possible explanations are (1) C3 disrupts the formation of highly branched species and (2) C3 reacts with the already formed highly branched species.21 As seen from the comparison within the SPA groups, there was no significant difference in dodecene subgroup distribution between C3 and C3 + C9 groups (Table S2, Figure S5). It implies that the recycling of C9 in the C3 oligomerization over SPA does not affect much the branching degree of the dodecenes.
Figure 8.
PCA plots of the 15 dodecene products according to the feedstocks using the data set of dodecene subgroups. Principal components 1 and 2 explain 98.6% of the variation. The axes of the loading plot showed how the dodecene subgroups influence PC1 and PC2.
2.7. Comparison of the Feedstocks Based on Dodecene Isomers
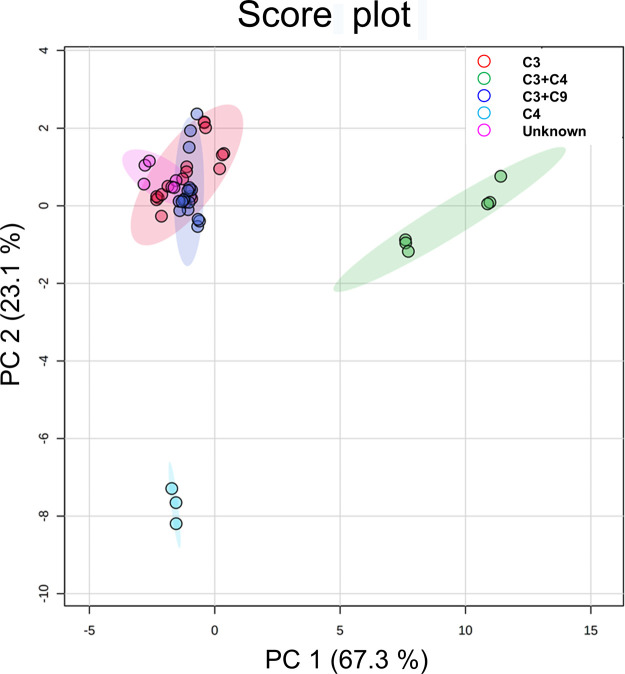
By using 58 individual dodecene isomer peak volumes, PCA also presented a significant clustering trend. Except for highly overlapped C3 and C3 + C9 groups, C4 and C3 + C4 groups were isolated on both PC1 and PC2 (Figure 9). One-way ANOVA (p threshold of 0.001), followed by Tukey’s HSD, selected 53 features significantly indicating the difference among feedstock groups. Among them, one feature can illustrate the significant variance between a pair of any two groups, specifically, C3 + C4 versus C3, C3 + C9 versus C3, C4 versus C3, C3 + C9 versus C3 + C4, C4 versus C3 + C4, and C4 versus C3 + C9. Eighteen features can differentiate all the abovementioned pairs except for C3 + C9 versus C3, the clusters of which were highly overlapped in the PCA score plot. Therefore, the abovementioned 19 features were considered to be able to distinguish the C4-only, partially C4-containing, and C4-not-containing feedstocks. The PCA plot using the abovementioned features was applied to estimate the feedstock composition of two unknown samples, samples P and Q (Figure 10). The unknown feedstock cluster was overlapped with C3 and C3 + C9 groups and located away from the C3 + C4 and C4 groups. It can be predicted that the unknown samples were not produced from feedstocks containing C4 olefins.
Figure 9.
PCA plots of the 15 dodecene products according to the feedstocks using the data set of the 58 dodecene isomers. Principal components 1 and 2 explain 81.4% of the variation. The loading plot showed how the dodecene isomers influence PC1 and PC2.
Figure 10.
PCA scores of the 17 dodecene products according to the feedstocks using the data set of the important features (dodecene isomers) selected by one-way ANOVA. Principal components 1 and 2 together can explain 90.4% of the variation.
The heat map presented two general clusters of the 19 important features (Figure S6). The upper cluster consisted of two monobranched isomers and four di- + tribranched isomers with longer 1RT ranging from 46.0 to 50.8 min. They were more concentrated in the C3 + C4 and C4 groups. The lower cluster included 13 dodecene isomers belonging to the di- + tribranched subgroup with shorter 1RT ranging from 32.6 to 44.0 min. Their concentrations were higher in the C3, C3 + C9, and unknown groups than in the C3 + C4 group. Six features in the lower cluster were more concentrated in the C4 group than the C3 + C4 group. Five of them were highly branched isomers with 1RT ranging from 32.6 to 36.4 min. It is highly possible that they are tribranched isomers. In order to distinguish C4 and C3 + C4 groups, PLS-DA identified the top five important features. Three of them with 1RT between 43.7 and 50.5 min were predicted as 3,7-dimethyl-4-decene, 3,6-dimethyl-4-decene, and 5-ethyl-4-decene from their PI mass spectra (Figures S7 and S8). They were significantly concentrated in the C3 + C4 group. The other two isomers with 1RT lower than 30.6 min were predicted as 6-ethyl-2,3-dimethyl-4-octene and 3,6-diethyl-4-octene. They were more concentrated in the C4 group (Figures S7 and S9).
3. Conclusions
The superior separation power and informative fragmentation pattern of the state-of-the-art instrumental combination of GC × GC–PI–TOFMS enabled us to explore the detail-to-molecule composition of olefin oligomerization products. Utilizing the appropriate data sets of the olefin product composition made the differentiation of feedstocks and catalysts possible with the assistance of multivariate statistical analyses. This study is the first work in the petrochemical olefin oligomerization industry applying unsupervised screening approaches (PCA and HCA) and feature selection methods (univariate analysis: ANOVA and multivariate analysis: PLS-DA) to distinguish the olefin oligomerization pathways and to discover the potential indicators. It showed the potential of multivariate statistical analyses on data analysis in acid-catalyzed light olefin oligomerization. In the future, a well-designed pilot experiment applying different feedstocks (such as propene, n-butene, isobutene, and pentene) and catalysts (such as different types of zeolites) together with the data handling tools described in this study will be a benefit to petrochemical industries for a better understanding of the olefin oligomerization reaction and further tuning of the composition of the products according to the end-user. An investigation of the PI efficiencies of different olefin isomers will be a benefit to the quantification using this promising ion source in the future.
4. Experimental Section
4.1. Chemicals and Samples
A C7–30n-alkane mixture (1000 μg mL–1 each component in hexane) was purchased from Millipore Sigma (Bellefonte, PA, U.S.A.) and diluted to 20 μg mL–1 each component in hexane for RI calculation. Seventeen dodecene products (samples A–Q, Table S3) were measured in triplicate for calculating the distribution of olefin congeners, dodecene structural subgroups, and individual dodecene isomers. These dodecene products were obtained using two types of catalysts, namely SPA and zeolite, and four types of feedstocks, namely C3, C4 (Raffinate-2), C3 + C4, and C3 + C9. The Raffinate-2 used is a mixture of 1- and 2-butenes (cis and trans), with iso-butene between 0 and 2 wt %. In addition, the exact feedstock composition that gave origin to products P and Q was unknown. All the catalysts and feedstocks are commercially available or met the commercial refinery grade specification. The dodecene products were prepared under the typical oligomerization conditions as described in Section 1. Several distillation fractions of samples C, F, and G were collected in the temperature range from 180 to 205 °C to investigate the compositional changes of the dodecene products as a function of the distillation temperature. n-hexane (dioxin and PCB grade, Biosolve, Dieuze, France) was used as the dilution solvent of the n-alkane mixture and dodecene products.
4.2. GC × GC–PI–TOFMS Instrumentation
The instruments employed in this study were GC × GC–PI–TOFMS, consisting of a gas chromatograph (7890B, Agilent Technologies, Wilmington, DE, U.S.A.) equipped with a solid-state modulator (SSM) (SSM1800, J&X technologies, Shanghai, China) and a TOF mass spectrometer equipped with a PI ion source (JMS-T200GC “AccuTOF GCx-plus”, JEOL Ltd., Tokyo, Japan). A conventional (nonpolar × polar) column set was used. The first dimension (1D) column was 30 m Rxi-5MS (0.25 mm i.d. × 0.25 μm df, Restek Corporation), and the second dimension (2D) column was 2 m Rxi-17Sil MS (0.25 mm i.d. × 0.25 μm df, Restek Corporation). A 0.7 m HV series column (0.25 mm i.d. × 0.36 μm df, J&X technologies, Shanghai, China) was placed in the SSM as the modulation column. The analytical condition was optimized by experimental design (DoE). The parameters of the optimized condition are a carrier gas helium flow rate of 0.8 mL/min, an injector temperature of 280 °C, a GC oven temperature program of 35–140 °C (hold for 1 min) at a rate of 1 °C/min, an interface temperature of 300 °C, an ion source temperature of 200 °C, a mass range of m/z 29–450, an acquisition rate of 50 spectra/s, and a modulation period (PM) of 4 s. The detailed analytical conditions are described in Table S4 and our previous study.10 The data acquisition of GC, PI-TOFMS, and the modulator were controlled by software msAxel ver. 2.1 (JEOL Ltd.) and SSCenter ver. 1.0.12.0 (J&X technologies). The GC × GC signal processing was conducted on GC Image ver. 2.5 (Zoex Corporation, Houston, U.S.A.).
The chromatogram of one dodecene product is shown in Figure S10. The olefin congeners (according to carbon chain length and DBE) were identified by the enhanced molecular ion intensity in the PI mass spectra, and their distributions were calculated by the percent ratio of each olefin congener intensity to the total intensity. The identification of dodecene structural subgroups, namely linear dodecenes, monobranched dodecenes, and a sum of di- and tribranched dodecenes, was based on the RT boundaries estimated in our previous study.10 The distribution of dodecene subgroups was calculated in two approaches. One is the distribution of linear, monobranched, and di- + tribranched dodecene subgroups in the product, which was calculated by the percent ratio of each dodecene subgroup intensity to the product total intensity (sum of all the olefin congeners). The other approach is the normalized distribution to the dodecenes only. This is calculated by the percent ratio of each dodecene subgroup intensity to the total intensity of dodecenes. The peak intensities used in this study were the total ion intensities. The PI efficiency was assumed to be without significant difference among the olefin isomers in this study. A future investigation on the PI efficiencies among olefin isomers is worth to be done when there are more synthesized mono-isomer standards available in the market.
4.3. Statistical Analysis
The signal pre-processing, which is baseline correction and smoothing in this study, was performed prior to the alignment of the chromatograms. After the data were aligned properly, the tables of total ion intensities (which were shown as peak volumes) of olefin congeners, dodecene subgroups, and dodecene isomers were generated for each sample by GC Image software. After that, data pre-processing was performed through the normalization to sample sum, log10 transformation, and autoscaling of the peak volumes. The statistical analyses, including t-test, one-way ANOVA, PCA, PLS-DA, HCA, and heat map, were carried out by using R ver. 4.0.2 (R Foundation for Statistical Computing, Vienna, Austria) and web-based MetaboAnalyst 5.0 function “statistical analysis.”22 In the heat map, the distance measure was Euclidean, and the clustering algorithm was ward.D.
Acknowledgments
The authors would like to thank JEOL Ltd. and J&X Technologies for continuous support on instrumentation. The authors are also grateful to Dr. Flavio A. Franchina and Dr. Benedikt A. Weggler for discussing the statistical analysis. This work was supported by ExxonMobil Chemical Europe Inc.
Supporting Information Available
The Supporting Information is available free of charge at https://pubs.acs.org/doi/10.1021/acsomega.1c03328.
HCA of catalysts; important features from olefin congeners to differentiate catalysts; potential indicators of catalysts; important features from olefin congeners to differentiate feedstocks; important features from dodecene subgroups to differentiate feedstocks; clustering of the feedstocks of the 17 dodecene products; potential indicators of C4 and C3 + C4 feedstocks; sample information; details of analytical condition; and chromatogram of the dodecene product (PDF)
The authors declare no competing financial interest.
Supplementary Material
References
- Ipatieff V. N.; Pines H. Polymerization of Ethylene Under High Pressures in the Presence of Phosphoric Acid. Ind. Eng. Chem. 1935, 27, 1364–1369. 10.1021/ie50311a032. [DOI] [Google Scholar]
- Ipatieff V. N. Catalytic Polymerization of Gaseous Olefins by Liquid Phosphoric Acid I. Propylene. Ind. Eng. Chem. 1935, 27, 1067–1069. 10.1021/ie50309a024. [DOI] [Google Scholar]
- Nicholas C. P. Applications of light olefin oligomerization to the production of fuels and chemicals. Appl. Catal., A 2017, 543, 82–97. 10.1016/j.apcata.2017.06.011. [DOI] [Google Scholar]
- Perego C.; Carati A.. Zeolites and zeolite-like materials in industrial catalysis. In Zeolites: From Model Materials to Industrial Catalysts; Cejka J., Perez-Pariente J., Roth W. J., Eds.; Transworld Research Network: Kerala, India, 2008; pp 357–389. [Google Scholar]
- Kumar P.; Varkolu M.; Mailaram S.; Kunamalla A.; Maity S. K.. Biorefinery polyutilization systems: Production of green transportation fuels from biomass. In Polygeneration with Polystorage for Chemical and Energy Hubs; Khalilpour K. R., Ed.; Academic Press: New York, 2019; pp 373–407. [Google Scholar]
- de Klerk A. Key catalyst types for the efficient refining of Fischer-Tropsch syncrude: Alumina and phosphoric acid. Catalysis 2011, 23, 1–49. 10.1039/9781849732772-00001. [DOI] [Google Scholar]
- de Klerk A.Aviation Turbine Fuels Through the Fischer–Tropsch Process. In Biofuels for Aviation; Chuck C. J., Ed.; Academic Press: New York, 2016; pp 241–259. [Google Scholar]
- Speight J. G.Fouling During Product Improvement Processes. In Fouling in Refineries; Speight J. G., Ed.; Gulf Professional Publishing, 2015; pp 375–389. [Google Scholar]
- Quann R. J.; Green L. A.; Tabak S. A.; Krambeck F. J. Chemistry of Olefin Oligomerization ZSM-5 Catalyst. Ind. Eng. Chem. Res. 1988, 27, 565–570. 10.1021/ie00076a006. [DOI] [Google Scholar]
- Zou Y.; Stefanuto P.-H.; Maimone M.; Janssen M.; Focant J.-F. Unraveling the complex olefin isomer mixture using two-dimensional gas chromatography-photoionization-time of flight mass spectrometry. J. Chromatogr. A. 2021, 1645, 462103. 10.1016/j.chroma.2021.462103. [DOI] [PubMed] [Google Scholar]
- van der Westhuizen R.; Potgieter H.; Prinsloo N.; de Villiers A.; Sandra P. Fractionation by liquid chromatography combined with comprehensive two-dimensional gas chromatography-mass spectrometry for analysis of cyclics in oligomerisation products of Fischer-Tropsch derived light alkenes. J. Chromatogr. A. 2011, 1218, 3173–3179. 10.1016/j.chroma.2010.10.009. [DOI] [PubMed] [Google Scholar]
- Golombok M.; De Bruijn J. Dimerization of n -Butenes for High Octane Gasoline Components. Ind. Eng. Chem. Res. 2000, 39, 267–271. 10.1021/ie9906060. [DOI] [Google Scholar]
- Dagle V. L.; Saavedra J.; Cooper A.; Luecke J.; Swita M.; Dagle R. A.; Gaspar D. Production and fuel properties of iso-olefins with controlled molecular structure and obtained from butene oligomerization. Fuel 2020, 277, 118147. 10.1016/j.fuel.2020.118147. [DOI] [Google Scholar]
- Nicholas C. P.; Laipert L.; Prabhakar S. Oligomerization of Light Olefins to Gasoline: An Advanced NMR Characterization of Liquid Products. Ind. Eng. Chem. Res. 2016, 55, 9140–9146. 10.1021/acs.iecr.6b01591. [DOI] [Google Scholar]
- Kim Y. T.; Chada J. P.; Xu Z.; Pagan-Torres Y. J.; Rosenfeld D. C.; Winniford W. L.; Schmidt E.; Huber G. W. Low-temperature oligomerization of 1-butene with H-ferrierite. J. Catal. 2015, 323, 33–44. 10.1016/j.jcat.2014.12.025. [DOI] [Google Scholar]
- Nicholas C. P.; Rathbun W. E.; Kruse T. M.; Pham H. A.. Composition of oligomerate, to UOP LLC. U.S. Patent 9,644,159 B2, 2017.
- Van Bramer S. E.; Johnston M. V. Photodissociation-Photoionization Mass Spectrometry of n-octene isomers. Anal. Chem. 1990, 62, 2639–2643. 10.1021/ac00222a023. [DOI] [PubMed] [Google Scholar]
- Van Bramer S. E.; Johnston M. V. Structural identification of alkene isomers by photodissociation-photoionization mass spectrometry. Org. Mass Spectrom. 1992, 27, 949–954. 10.1002/oms.1210270904. [DOI] [Google Scholar]
- Van Bramer S. E.; Ross P. L.; Johnston M. V. Unimolecular photochemistry of n-alkenes studied by photodissociation-photoionization mass spectrometry. J. Am. Soc. Mass Spectrom. 1993, 4, 65–72. 10.1016/1044-0305(93)85044-x. [DOI] [PubMed] [Google Scholar]
- de Klerk A. Distillate production by oligomerization of Fischer - Tropsch olefins over solid phosphoric acid. Energy Fuels 2006, 20, 439–445. 10.1021/ef0503459. [DOI] [Google Scholar]
- de Klerk A.; Engelbrecht D. J.; Boikanyo H. Oligomerization of fischer-tropsch olefins: Effect of feed and operating conditions on hydrogenated motor-gasoline quality. Ind. Eng. Chem. Res. 2004, 43, 7449–7455. 10.1021/ie0495675. [DOI] [Google Scholar]
- Pang Z.; Chong J.; Li S.; Xia J. Metaboanalystr 3.0: Toward an optimized workflow for global metabolomics. Metabolites 2020, 10, 186. 10.3390/metabo10050186. [DOI] [PMC free article] [PubMed] [Google Scholar]
Associated Data
This section collects any data citations, data availability statements, or supplementary materials included in this article.


