Abstract
In animal experiments aimed at extrapolation to humans, it is essential to ensure the reproducibility of experiments and universality between animals and humans. However, among animals with the same generic name but from different breeders, which is to say different stocks, even resting physiological conditions, such as genetics, do not coincide, and, therefore, exercise capacity and physiological responses may also vary. To address this issue, we examined the differences in exercise capacity and exercise-induced metabolic and endocrine responses among stocks of Wistar rats using an established treadmill running model for rodents, which mimics physiological responses in humans. Wistar rats from four breeders were acclimated to treadmill running and then had a catheter inserted into their external jugular veins. Subsequently, the rats were subjected to an incremental treadmill running test (IRT). We found that there were significant differences in the exercise capacity among Wistar rats from different breeders. Additionally, the dynamics of blood lactate, glucose, and adrenocorticotropic hormone levels during the IRT were found to vary among the Wistar rats from different breeders; only one stock showed human-type exercise-induced physiological responses. These results indicate that Wistar rats could have different capacities for and physiological responses to the same exercise depending on their stocks. Thus, the selection of the stock of experimental animals may affect the validity of the results when verifying exercise effects.
Keywords: breeder, extrapolation to humans, running exercise, stock, Wistar rat
Introduction
To achieve results that are relevant to future applications to humans, experimental animal models should reflect human biological responses. The animal is a fundamental component of the experimental model, and the Wistar rats have been extensively used in various fields such as pharmacology and behavior. Wistar rats were developed at the Wistar Institute in the United States. Several Japanese breeders have introduced them in Japan and are currently selling them. However, the origins and the timing of their introduction varies with each breeder. Each stock of Wistar rats has been distinguished by given a name with a laboratory code in accordance with the Guidelines for Nomenclature of Rat Strains [1]. For extrapolation to humans, it is necessary to understand the differences in the biological characteristics among stocks.
Previous studies have reported differences in laboratory animals with the same general name for some biological characteristics. Yamada and colleagues demonstrated that the heterozygosity and the genetic relationships are highly variable in Wistar rats from different breeders [2]. Such genetic differences have also been observed in ICR mice, and some of their phenotypes are not consistent [3]. The differences among stocks are not only in genetic constitution. Hematologic data, including white blood cells, lymphocytes, and platelets, have been shown to be distinct between Wistar rats obtained from two different breeders [4]. Moreover, a difference in cognitive function among Wistar rats sourced from three breeders has been also reported [5, 6]. Similar results have been reported for Long-Evans rats [7]. These reports indicate that even stocks with the same generic name are unlikely to have the same biological and biochemical characteristics across breeders and may not be reproducible with animals from different breeders.
While it has been shown that there are differences in physiological conditions such as blood composition even in the resting state among stocks of Wistar rats, whether exercise capacity and exercise-induced physiological responses differ remains undetermined. In addition to the resting state, responsiveness to stimuli such as drugs varies among breeders [5], and thus responsiveness to the stimulus of exercise is also expected to vary among breeders. In previous studies, we proposed a treadmill running model for Wistar rats which replicates human physiological responses in order to evaluate neuroendocrine responses to exercise [8,9,10,11]. In both rodents [8,9,10,11] and humans [12,13,14], the release of the adrenocorticotropic hormone (ACTH), a physiological marker of the stress response, increases with running exercise at the lactate threshold (LT), which is an exercise intensity at which blood lactate levels begin to increase, and which is one of the parameters of physical ability. Therefore, in the current study, we hypothesized that exercise capacity and metabolic and endocrine responses of Wistar rats would differ depending on their origin breeders and verified this hypothesis using an animal treadmill running model.
Materials and Methods
Animals
Eight-week-old male Wistar rats were purchased from four commercial breeders (Slc:Wistar, Japan SLC, Inc., Shizuoka, Japan, n=4, Crlj:WI, Charles River Laboratories Japan, INC., Kanagawa, Japan, n=4, Kwl:Wistar, Tokyo Laboratory Animals Science Co., Ltd., Tokyo, Japan, n=5, and Jcl:Wistar, CLEA Japan, Inc., Tokyo, Japan, n=5). All rats were acclimatized to an animal facility (lights on 07:00-19:00, 22–24°C). Water and food (MF, Oriental Yeast Co., Ltd., Tokyo, Japan) were provided ad libitum. All experimental procedures were conducted in accordance with the University of Tsukuba Animal Experiment Committee guidelines (Animal ethical approval number: 14-014).
Treadmill running acclimation
After all rats were accustomed to the laboratory conditions, they were subjected to running training on a treadmill (KN-73 TREAD-MILL, Natsume Seisakusyo Co., Ltd., Tokyo, Japan) using a modified version of the method described in previous studies [9,10,11]. All rats were trained to run for 30 min in 7 session/10 days, and the running velocity was gradually increased from 5 to 25 m/min at 0° incline. Electrical shock grids placed at the rear end of the treadmill provided mild but aversive foot shocks (30 V) to rats to encourage running at the set treadmill speed.
Catheter insertion
After running acclimation, rats were anesthetized with isoflurane, and a silicone catheter was inserted into the right jugular vein to a depth of 32 mm for Slc:Wistar, 36 mm for Crlj:WI, 33 mm for Kwl:Wistar, and 33 mm for Jcl:Wistar. The subsequent running test was conducted four days later to allow for post-operative recovery.
Incremental treadmill running test (IRT)
All rats were subjected to a running exercise test which consisted of three stages (15 m/min, 20 m/min, and 22.5 m/min) each lasting 10 min. These velocities were set with reference to the previously reported LT (20 m/min) for Wistar rats (Kwl:Wistar, SEAS, Co., Ltd.) [10]. Before running (0 min) and just before the end of each stage (10, 20, and 30 min), 350 µl of blood was collected through the jugular catheter.
Assessment of running capacity
The running capacity intend whether the rats could do the given exercise task. The running capacity of the animals was evaluated under blind conditions by examining the number of electric shocks received, the running score, and the actual running time. When a rat refused to run or stopped running without resuming, a weak electric shock was given, and the number of electric shocks was counted. The running behavior of the rats was scored at each speed stage using the five-point scale reported by Dishman et al. [15]; 1: refused to run, 2: below average runner (sporadic, stop and go, wrong direction), 3: average runner (would perform but needed constant attention, the experimenter accomplished this by tapping the back of the treadmill), 4: above average runner (consistent runner occasionally fell back on the treadmill), 5: good runner (consistently stayed at the front of the treadmill). Two or three evaluators rated running behavior, and these scores were averaged. The rats were recorded during running, and actual running time on the treadmill lane was measured with a manual stopwatch while watching the recorded video.
Blood sampling and measurements
Blood samples were collected in tubes coated with 1.5% EDTA (Nacalai Tesque, Inc., Kyoto, Japan). Blood lactate and glucose were immediately measured using an automated glucose-lactate analyzer (2300 Stat Plus, YSI, Yellow Spring, OH, USA). Subsequently, the blood samples were centrifuged at 4°C, and then 120 µl of plasma was collected in tubes containing 2 µl of Aprotinin (MP Biomedicals, LLC, Irvine, CA, USA) and was stored at −80°C until assay. Plasma was diluted four-fold with 0.1% BSA (Nacalai Tesque, Inc., Kyoto, Japan), and ACTH concentration was measured using an ELISA kit (MD Bioproducts, division of MD Biosciences Inc., St. Paul, MN, USA).
Statistical analysis
All data are expressed as mean ± SEM and were analyzed for statistical significance using the GraphPad Prism 7.04 (MDF Co., Ltd., Tokyo, Japan). Statistical analyses were performed with two-way repeated-measures ANOVA followed by Tukey’s or Dunnett’s post hoc multiple comparison tests for factors of breeder and time, respectively. Spearman’s correlation analysis was performed for each value in the third stage of the running test. The statistical significance was assessed with a two-side test with an α level of 0.05.
Results
Initial and final body weight
The body weight of the Wistar rats from different breeders taken on the first day of acclimation to the laboratory environment (initial) and on the day of the IRT (final) are shown in Table 1. The body weight was significantly different between breeders (P<0.05), except between Kwl:Wistar and Jcl:Wistar for the initial weight and between Crlj:WI and Kwl:Wistar for the final weight.
Table 1. Comparison of initial and final body weights for each stock.
| Initial | Final | |
|---|---|---|
| Slc:Wistar | 201.5 ± 2.06 | 222.0 ± 9.72 |
| Crlj:WI | 301.5 ± 3.88 aa | 351.0 ± 18.07 aa |
| Kwl:Wistar | 261.0 ± 4.11 aabb | 358.4 ± 8.70 aa |
| Jcl:Wistar | 242.2 ± 6.19 aabb | 307.4 ± 4.15 aabbcc |
Mean ± SEM [g]. aa: P<0.01 vs. Slc:Wistar, bb: P<0.01 vs. Crlj:WI, cc: P<0.01 vs. Kwl:Wistar.
Running capacity
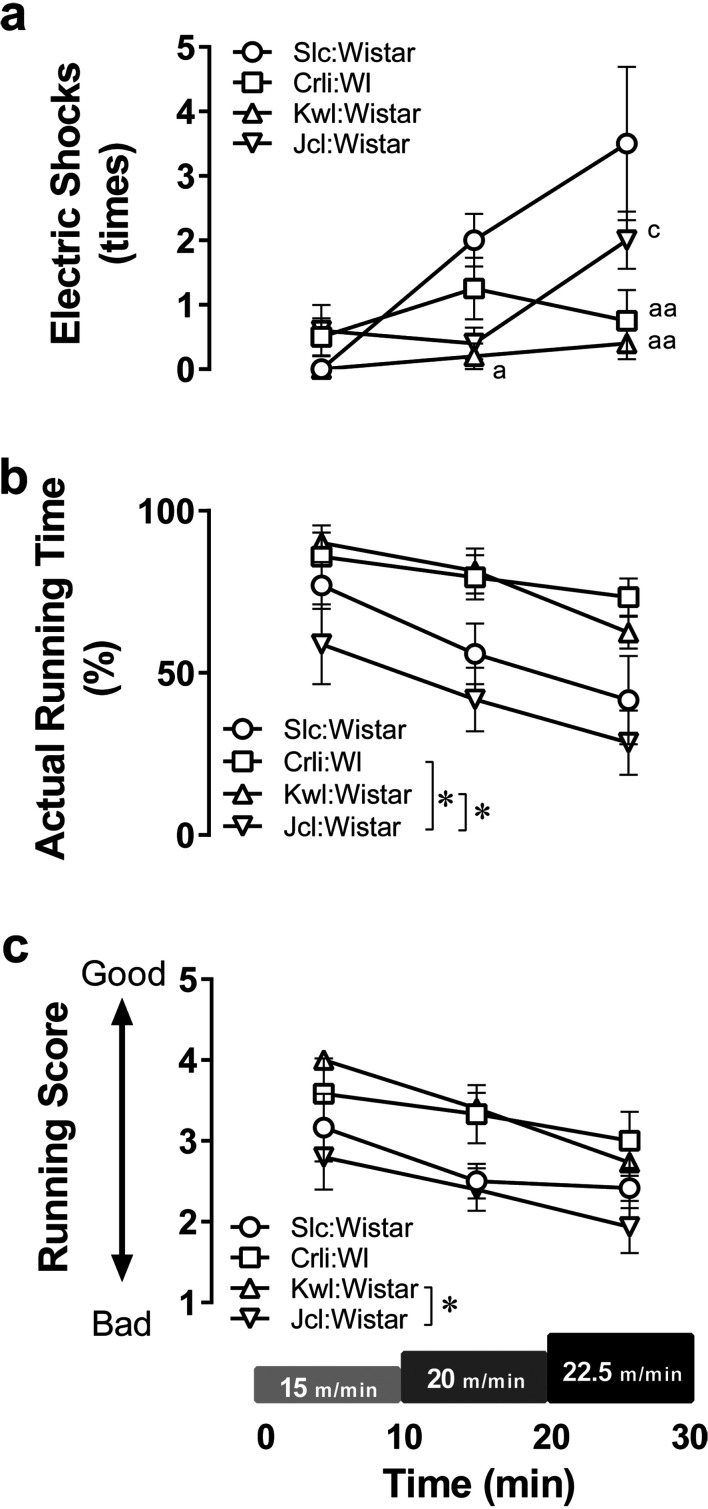
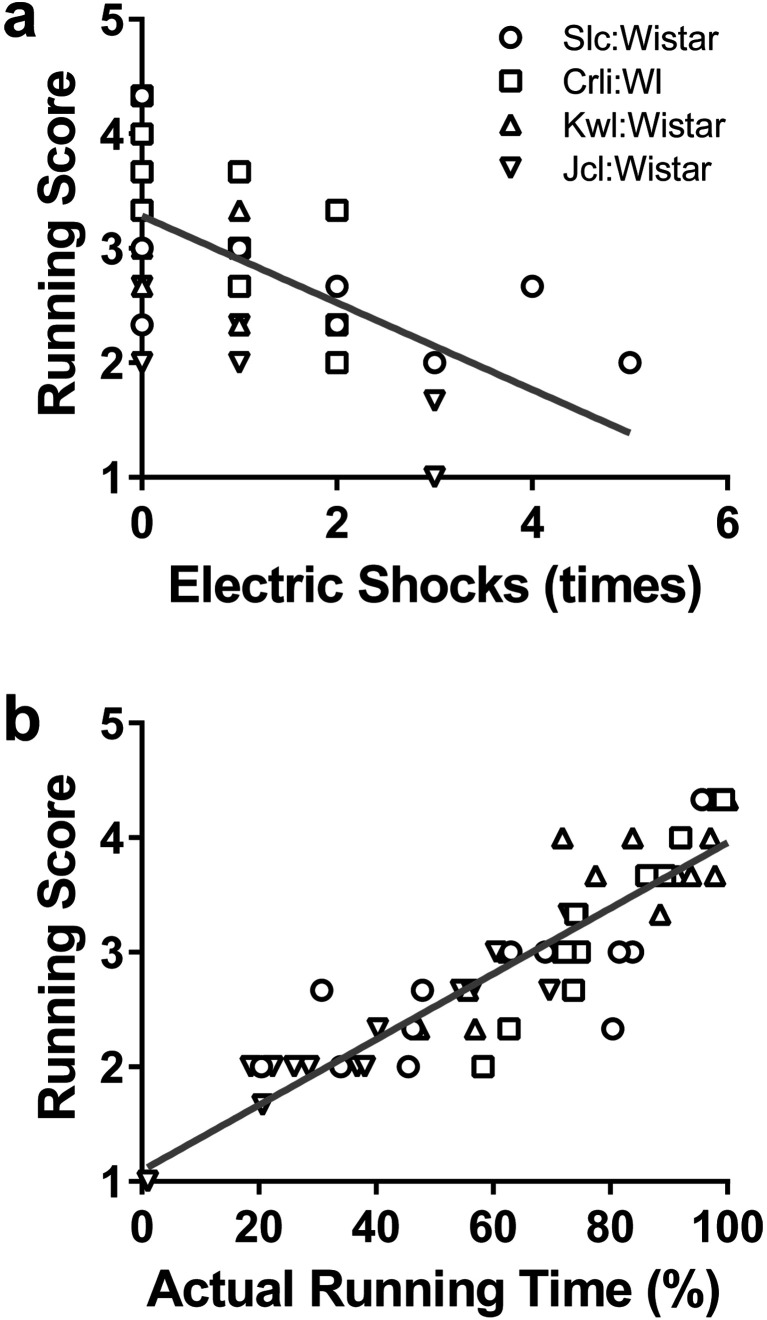
The running capacity in Wistar rats from the four breeders was evaluated (Fig. 1). The numbers of electric shock exposures (Fig. 1a; effects of exercise intensity F(2, 28)=13.69, P<0.05; effects of breeder F(3,14)=4.558, P<0.05; interaction F(6,28)=4.746, P<0.05) had no differences between breeders at 15 m/min, but were significantly different at 20 m/min (Slc:Wistar vs. Kwl:Wistar: P<0.05) and at 22.5 m/min (Slc:Wistar vs. Crlj:WI, Slc:Wistar vs. Kwl:Wistar, Kwl:Wistar vs. Jcl:Wistar: P<0.05). The actual running time also differed between breeders (Fig. 1b; effects of intensity F(2,28)=29.68, P<0.05; effects of breeder F(3, 14)=5.191, P<0.05; interaction F(6,28)=1.143, P>0.05, Crlj:WI vs. Jcl:Wistar, Kwl:Wistar vs. Jcl:Wistar: P<0.05). Running scores were also different between some breeders (Fig. 1c; effects of intensity F(2, 28)=19.81, P<0.05; effects of breeder F(3,14)=3.753, P<0.05; interaction F(6,28)=0.8005, P>0.05, Kwl:Wistar vs. Jcl:Wistar: P<0.05). Furthermore, running scores showed a significant negative correlation with the numbers of electric shocks received (Fig. 2a; r=−0.6509, P<0.05) and a significant positive correlation with the actual running time (Fig. 2b; r=0.9095, P<0.05). Meanwhile, there was no correlation between this score and final body weight (r=0.2573, P>0.05).
Fig. 1.
Comparison of running exercise capacity between Wistar rats from different breeders. Wistar rats from four different breeders were subjected to an incremental treadmill running test (IRT). (a) The number of electric shocks received during the IRT. (b) The ratio of time that rats actually ran. (c) Running scores on a 5-point scale; 5 means the best. Data points and error bars represent the mean ± SEM (n=4–5 per group). *: P<0.05, **: P<0.01, a: P<0.05, aa: P<0.01 vs. Slc:Wistar, c: P<0.05 vs. Kwl:Wistar.
Fig. 2.
Relationship between running score and number of electric shocks received (a) and actual running time (b). Spearman’s rank correlation coefficients were −0.65 and 0.91, respectively, and both P values were less than 0.01.
Metabolic responses
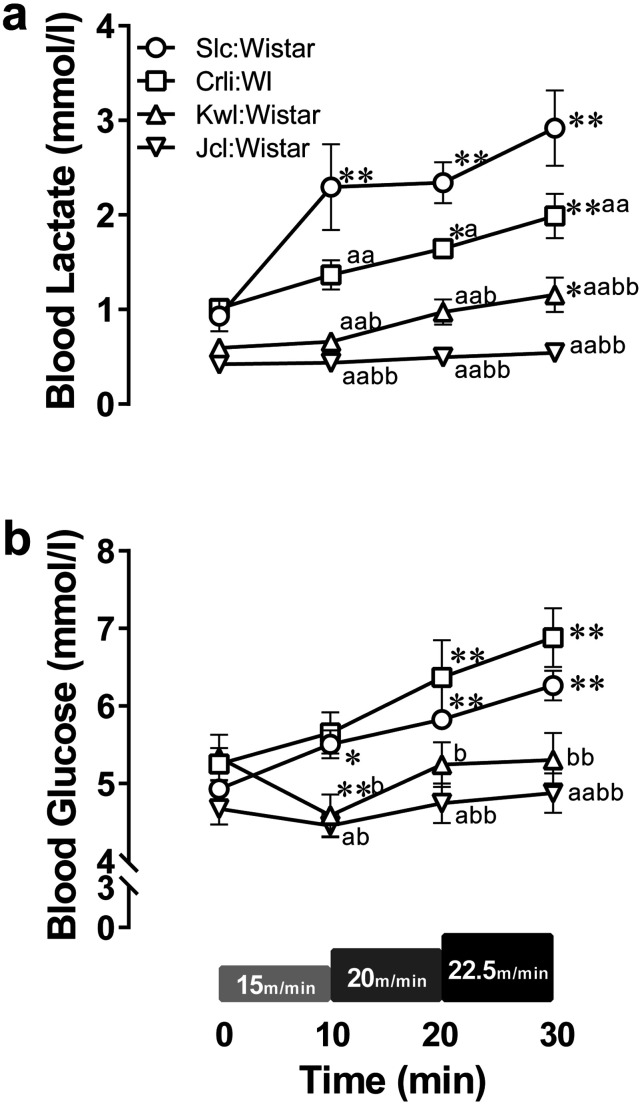
Blood lactate and glucose levels (Fig. 3) were measured as metabolic responses to exercise. The main effects of exercise intensity and breeder on the blood lactate levels and their interaction were significant (Fig. 3a; effects of exercise intensity F(3,42)=20.72, P<0.05; effects of breeder F(3,14)=53.67, P<0.05; interaction F(9,42)=4.303, P<0.05). The blood lactate levels were not significantly different between the breeders at pre-running (P>0.05); however, at all exercise intensities, these levels significantly differed between breeders (P<0.05), except between Kwl:Wistar and Jcl:Wistar (P>0.05). In addition, the blood lactate levels significantly increased from pre-exercise at all exercise intensities in Slc:Wistar, at above 20 m/min in Crlj:WI, and only at 22.5 m/min in Kwl:Wistar (P<0.05), but did not change in Jcl:Wistar (P>0.05). In terms of blood glucose levels, the main effects of exercise intensity and breeder and their interaction were significant (Fig. 3b; effects of intensity F(3,42)=34.56, P<0.05; effects of breeder F(3,14)=5.777; P<0.05; interaction F(9,42)=7.72, P<0.05). The blood glucose levels at pre-running were not different between breeders (P>0.05). In contrast, at all exercise intensities, there were significant difference between Slc:Wistar and Jcl:Wistar, Crlj:WI and Kwl:Wistar, and Crlj:WI and Jcl:Wistar (P<0.05). Exercise-induced blood glucose levels increased in Slc:Wistar and Crlj:WI (P<0.05) and remained unchanged in Jcl:Wistar (P>0.05). Meanwhile in Kwl:Wistar, the glucose levels were lower at 15 m/min than at pre-running.
Fig. 3.
Change of blood lactate (a) and glucose (b) levels in Wistar rat stocks during IRT. Data points and error bars represent the mean ± SEM (n=4–5 per group). *: P<0.05, **: P<0.01 vs. 0 min, a: P<0.05, aa: P<0.01 vs. Slc:Wistar, b: P<0.05, bb: P<0.01 vs. Crlj:WI.
Neuroendocrine response
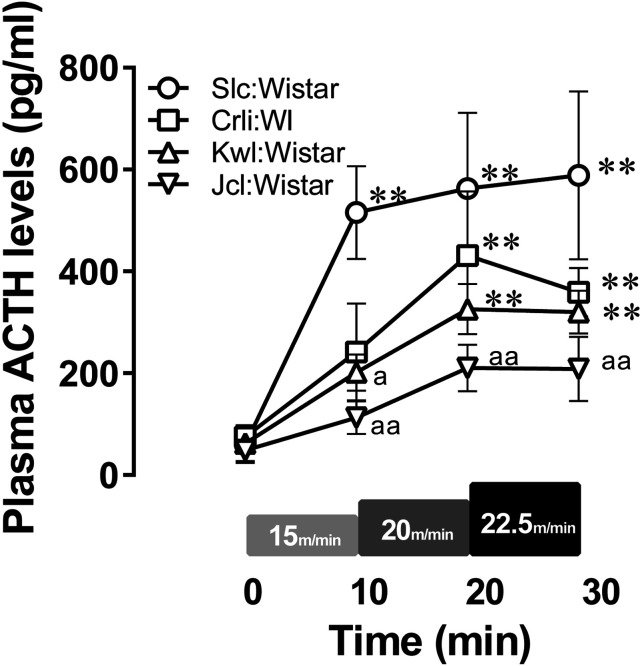
Plasma ACTH concentrations (Fig. 4) were measured as neuroendocrine response, especially, as stress response, to exercise. The main effects of exercise intensity and breeder and their interaction were significant (Fig. 4; effects of exercise intensity F(3,42)=34.09, P<0.05; effects of breeder F(3,14)=4.345, P<0.05; interaction F(9,42)=2.526, P<0.05). The ACTH concentrations at pre-running were not significantly different between breeders (P>0.05). Meanwhile, ACTH concentrations during exercise were significantly different between Slc:Wistar and Jcl:Wistar at all exercise intensities, and also between Slc:Wistar and Kwl:Wistar at 15 m/min (P<0.05). Compared with pre-running, plasma ACTH concentrations were significantly higher at all exercise intensities in Slc:Wistar, and above 20 m/min in Crlj:WI and Kwl:Wistar (P<0.05).
Fig. 4.
Dynamics of plasma ACTH levels in each stock during IRT. Data points and error bars represent the mean ± SEM (n=4–5 per group). **: P<0.01 vs. 0 min, a: P<0.05, aa: P<0.01 vs. Slc:Wistar.
Discussion
We hypothesized that the capacity and physiological responses to exercise would vary among stocks of Wistar rats. To address this hypothesis, male Wistar rats from four different breeders were subjected to an IRT based on previously reported LT in Wistar rats (Kwl:Wistar, SEAS, Co., Ltd.) [10] and their physiological responses were compared. The results showed that Wistar rats had different exercise capacities among breeders, and some physiological responses to exercise differed between stocks of Wistar rats even with equivalent running exercise capacity. These results warn researchers that reproducibility beyond stocks is not guaranteed.
It has been reported that various characteristics of Wistar rats under the resting state vary among breeders [2, 4,5,6], but the variety of their running exercise capacity has not yet been clarified. The running score was used to assess running capacity in this study, which is reasonable because of the significant correlations between the number of electric shocks received and the actual running time (Figs. 2a and b). Although the four stocks of Wistar rats used in the current study were acclimated to treadmills in the same way, their running scores during exercise at the same intensity were quite different (Fig. 1c). Rats need to learn and memorize the treadmill characteristics during the running habituation period, such as maintaining a position at the front of the treadmill to avoid the electric shock, which is similar to active and passive avoidance responses. Interestingly, Hirate and colleagues reported that Wistar rats from different breeders show different active and passive avoidance responses [5, 6]. Therefore, differences in cognitive functions can explain, at least partially, the variations in exercise capacity found in the present study. Since it is a prerequisite that the experimental animals perform the running exercise appropriately in order to verify the effects of the exercise, experimental animals should be selected carefully.
We also investigated the metabolic and endocrine responses to the current running exercise in the four stocks of Wistar rats. The two groups with good running capacity (Crlj:WI and Kwl:Wistar, Fig. 1) showed responses in blood lactate and plasma ACTH levels (Figs. 3a and 4) to the exercise at higher intensities (at and above 20 m/min); such a dynamic profile seems to be similar to that of humans [12,13,14]. However, the profile of the blood glucose levels in Kwl:Wistar, but not Crlj:WI (Fig. 3b), seemed to be different from those observed in humans [12]; only Crlj:WI mimicked these three physiological responses in humans during the current running exercise. Thus, the dynamic profiles of physiological responses to exercise vary due to breeders and thus targeted human-like physiologic responses during exercise are limited to specific stock.
There are some limitations to the current study. We only measured exercise capacity and a few physiological responses to acute running exercise. It is still unknown whether the adaptive effects of training and other physiological and biochemical parameters, such as immune and hematological systems, differ among stocks of Wistar rats. In future studies, it is also necessary to evaluate physical ability parameters, such as LT, and to verify biological responses with exercise intensities tailored to such parameters among Wistar rat stocks.
In summary, we found that there are differences in running exercise capacity and physiological responses to running exercise among Wistar rats from different breeders; the present findings suggest that reproducibility beyond the stock of Wistar rats is limited in exercise experiments. For extrapolation to humans, researchers should select laboratory animals carefully in order to be clear about the universality between animals and humans in their research.
Funding
This research was supported by the Program for Advancing Strategic International Networks to Accelerate the Circulation of Talented Researchers of the Japan Society for Promotion of Science (JSPS) Grant (HFH27016) to H. S. and KAKENHI Grants-in-Aid for Scientific Research A (23240091) to H. S.
Acknowledgments
The authors are grateful to J. Shibato (University of Tsukuba, Japan and Hoshi University, Japan), T. Matsui, H. Omuro, M. Hamasaki, A. Oharazawa and K. Miyoshi for technical support and to M. Noguchi (ELCS English Language Consultation, Japan) for help with the manuscript.
References
- 1.Rat Nomenclature Guidelines [Internet]. 2016. Available from: http://www.informatics.jax.org/mgihome/nomen/strains.shtml.
- 2.Yamada J, Nikaido H, Matsumoto S. Genetic variability within and between outbred Wistar strains of rats. Jikken Dobutsu. 1979; 28: 259–265. [DOI] [PubMed] [Google Scholar]
- 3.Hayakawa J, Koizumi T, Natsuume-Sakai S. Constancy of genetic variability in mice for non-inbred closed colonies. Lab Anim. 1980; 14: 233–236. doi: 10.1258/002367780780937625 [DOI] [PubMed] [Google Scholar]
- 4.Kampfmann I, Bauer N, Johannes S, Moritz A. Differences in hematologic variables in rats of the same strain but different origin. Vet Clin Pathol. 2012; 41: 228–234. doi: 10.1111/j.1939-165X.2012.00427.x [DOI] [PubMed] [Google Scholar]
- 5.Hirate K, Kuribara H, Tadokoro S. Breeder differences within Wistar strain rats in acquisition of discrete shuttle avoidance response and in sensitivity to chlorpromazine. Jpn J Pharmacol. 1988; 47: 209–216. doi: 10.1016/S0021-5198(19)43204-6 [DOI] [PubMed] [Google Scholar]
- 6.Hirate K, Kuribara H, Tadokoro S. Breeder differences within Wistar strain rats in step-through type passive avoidance response. Jpn J Pharmacol. 1989; 51: 563–567. doi: 10.1016/S0021-5198(19)40083-8 [DOI] [PubMed] [Google Scholar]
- 7.Nakamura CY, Anderson NH. Avoidance behavior differences within and between strains of rats. J Comp Physiol Psychol. 1962; 55: 740–747. doi: 10.1037/h0044433 [DOI] [PubMed] [Google Scholar]
- 8.Soya H. Stress Response to Exercise and Its Hypothalamic Regulation : Role of Arginine-Vasopressin. Exercise Nutrition and Environmental Stress. 2001: 21–37. [Google Scholar]
- 9.Saito T, Soya H. Delineation of responsive AVP-containing neurons to running stress in the hypothalamus. Am J Physiol Regul Integr Comp Physiol. 2004; 286: R484–R490. doi: 10.1152/ajpregu.00453.2003 [DOI] [PubMed] [Google Scholar]
- 10.Soya H, Mukai A, Deocaris CC, Ohiwa N, Chang H, Nishijima T, et al. Threshold-like pattern of neuronal activation in the hypothalamus during treadmill running: establishment of a minimum running stress (MRS) rat model. Neurosci Res. 2007; 58: 341–348. doi: 10.1016/j.neures.2007.04.004 [DOI] [PubMed] [Google Scholar]
- 11.Ohiwa N, Chang H, Saito T, Onaka T, Fujikawa T, Soya H. Possible inhibitory role of prolactin-releasing peptide for ACTH release associated with running stress. Am J Physiol Regul Integr Comp Physiol. 2007; 292: R497–R504. doi: 10.1152/ajpregu.00345.2006 [DOI] [PubMed] [Google Scholar]
- 12.Farrell PA, Garthwaite TL, Gustafson AB. Plasma adrenocorticotropin and cortisol responses to submaximal and exhaustive exercise. J Appl Physiol. 1983; 55: 1441–1444. doi: 10.1152/jappl.1983.55.5.1441 [DOI] [PubMed] [Google Scholar]
- 13.Luger A, Deuster PA, Kyle SB, Gallucci WT, Montgomery LC, Gold PW, et al. Acute hypothalamic-pituitary-adrenal responses to the stress of treadmill exercise. Physiologic adaptations to physical training. N Engl J Med. 1987; 316: 1309–1315. doi: 10.1056/NEJM198705213162105 [DOI] [PubMed] [Google Scholar]
- 14.Rahkila P, Hakala E, Alén M, Salminen K, Laatikainen T. Beta-endorphin and corticotropin release is dependent on a threshold intensity of running exercise in male endurance athletes. Life Sci. 1988; 43: 551–558. doi: 10.1016/0024-3205(88)90158-0 [DOI] [PubMed] [Google Scholar]
- 15.Dishman RK, Armstrong RB, Delp MD, Graham RE, Dunn AL. Open-field behavior is not related to treadmill performance in exercising rats. Physiol Behav. 1988; 43: 541–546. doi: 10.1016/0031-9384(88)90206-5 [DOI] [PubMed] [Google Scholar]


