

Abstract
Purpose:
Advances in X-ray phase-contrast imaging can obtain excellent soft-tissue contrast of phase-shift, attenuation, and small angle scatter. Here we present fringe patterns for different design parameters of X-ray bi-prism interferometry imaging systems. Our aim is to develop bi-prism interferometry imaging systems with excellent polychromatic performance that produce high-contrast fringes with spatially incoherent X-ray illumination. We also introduce a novel X-ray tube design that uses temporal multiplexing to provide simultaneous virtual “electronic phase stepping” that replace “mechanical phase stepping” popular with grating-based interferometry setups.
Methods:
In our investigation we develop expressions for the irradiance distribution pattern of a bi-prism interferometer comprised of multiple point sources and multiple bi-prisms. These expressions are used to plot fringe patterns for X-ray design parameters including size of point source, number of point sources, and point source separation; and bi-prism design parameters including material, angle, number of bi-prisms, period, and bi-prism array to X-ray source and to detector distances.
Results:
Results show that the fringe patterns for a bi-prism interferometry system are not longitudinally periodic as with grating interferometers that produce a Talbot-Lau carpet. It is also shown that at 59 keV X-rays the bi-prism material should be something comparable to nickel to obtain reasonable fringe visibility.
Conclusion:
The irradiance distribution pattern demonstrates that bi-prism interferometry may provide comparable or improved fringe visibility to that of gratings. Special care is given to present our findings within the context of previous advancements. A single-shot image acquisition approach using a temporal multiplexed, high-power X-ray source provides virtual electronic phase stepping without focal spot sweeping. This provides multiple images, each at the same exposure and the same projection view, from different fringe locations that allow one to derive the attenuation, phase, and dark-field images of the sample without mechanical phase stepping of a grating.
Keywords: X-ray phase contrast imaging, X-ray tube design, bi-prism interferometry, small angle scatter, dark field imaging
1. INTRODUCTION
To take advantage of the full potential of X-ray CT, there is a need for imaging systems that measure the full extent of the physics (attenuation, differential phase-shift, small angle scatter) involved in the interaction of X-rays with soft tissues. In a recent review it was demonstrated that interferometry-based X-ray imaging can provide excellent soft-tissue contrast of phase and directional small angle scatter information in addition, attenuation properties of tissues common in present day X-ray CT.1 We propose to design such imaging systems using refractive bi-prisms2,3 with optimum material and geometric parameters to provide fine spatial fringe modulation with high intensity, and to develop novel X-ray tubes that eliminate the need for mechanical phase stepping.
1.A. Difference between grating and bi-prism interferometry
There are a variety of X-ray phase contrast techniques all of which are based on the observation of interference patterns between deviated and un-deviated rays. Some approaches generate a Talbot-Lau interference pattern shown in Fig. 1 using a grating. This produces a replication of the grating via overlapping interference fringe patterns at regular distances away from the source. By placing the detector at the particular distance where the signal of the intensity is amplified and using methods to measure phase shifts in the interference fringes one is able to separate X-ray attenuation, phase, and scatter of the sample being imaged by comparing the observed pattern with and without the sample. In Fig. 1 for a plane wave passing through a grating, we see different fringe patterns mimicking the source images at regular distances from the source. We will show for the bi-prism interferometer that the amplified fringe patterns are not found at periodic longitudinal distances. Moreover, we will show that the visibility of many, but not all, of the fringe patterns is diminished by the increased numbers of bi-prisms.
Fig. 1.

(a) Schematic diagram of an X-ray grating interferometry system. (b) Talbot-Lau carpet. Illuminating plane wave passes through a grating producing a fringe pattern with replicating amplified fringe patterns at regular distances from the sources produced by the grating. At ZT/2 there is a secondary Talbot image and at ZT a replication of the original Talbot image that emerged from the grating. At ZT/4 there is a double frequency fractional image and increased frequency of images at less fractional distances. (Modified from Wikipedia: https://en.wikipedia.org/wiki/Talbot_effect.)
In our lab, we are investigating a novel X-ray interferometer (Fig. 2) wherein an array of Fresnel bi-prisms produces interference fringes with X-rays from a source grating (G0).4 The system does not have a phase stepping grating (G2) common in most X-ray phase contrast imaging systems, but our intent is to use hardware, such as a detector/scintillator with small hexagonal elements,5,6 which acts as a G2 analyser grating producing a Moiré pattern7 on the detector. The source grating G0 forms multiple mutually-incoherent sources of X-ray illumination from a single X-ray source. The multiple mutually-incoherent X-rays sources refract through each element of a bi-prism, thus overlapping as if proceeding from two slightly separated virtual sources of coherent rays (Fig. 3). By selecting bi-prism design parameters of material, angle, number of bi-prisms, period, and bi-prism to X-ray source and to detector distances; the bi-prism array interferometer provides spatially modulated intensity across a wide field as each center fringe thus produced falls in a resonant position at the detector. An X-ray bi-prism material has widely varied refracting power relative to wavelength and thus the separation of the virtual sources also varies with X-ray wavelength. The setup allows for rotating the sample itself to capture different angular views needed for analysing the X-ray scattering resulting from the orientation of a sample’s internal microstructure.
Fig. 2.

Schematic diagram of an X-ray bi-prism interferometry system. (a) Operation of a Fresnel X-ray bi-prism, (b) experimental setup with multiple X-ray origins each producing fringes in resonant position, and (c) detail of production of Moiré fringes via a tilted grating G2 at the detector. Our intention is to eliminate the G2 granting and instead use only a detector/scintillator with small hexagonal elements to produce the Moiré fringe pattern. (Modified from our earlier publication.4)
Fig. 3.

X-ray beam deflection by a bi-prism illustrating the distance d between the two virtual coherent point sources produced by a bi-prism. (Copied from The Fresnel Biprism, David-Alexander Robinson and Jack Denning; Daniel Tanner 08332461; 10th December 2009.)
1.B. Mathematical manipulation of a single exposure of an X-ray phase contrast interferometer
To reduce the acquisition time and dose, mathematical data processing methods have been developed to extract the data from a single exposure. One method8 “reverse projection” processing is based on manipulation of the phase relation between different X-ray projections and uses tomography to reconstruct the absorption coefficient and refractive index by filtered backprojection of sampled projections. Another method using a single lead grid,9,10 relies on Fourier analysis of spatial harmonics to obtain absorption, differential phase contrast, and diffraction images, all with a single exposure. The method assumes that refraction and diffraction in the imaged object is manifested as position shifts and amplitude attenuation of the fringes, respectively. In an additional method,11 the scan of the phase-stepping grating is combined with the rotation of the sample so that a single detector frame per projection angle is obtained, yielding images corresponding to all three contrast modalities. Most single shot methods produce Moiré fringe patterns and depends on Fourier analysis to extract the attenuation, phase, and small angle scatter.12-17 In particular one paper13 used continuous wavelet transforms to extract the phase information from Moiré interferograms. In another paper,16 Moiré fringe patterns are produced by positioning a two-dimensional checkerboard grating at the first Talbot position beyond the object being imaged. Differential phase-contrast and absorption images are obtained by Fourier analysis of the Moiré fringe patterns. In two other papers,15,17 in addition to the source grating (G0), the phase grating (G1) and the analyzer grating (G2) are designed and manipulated to produce a Moiré pattern. In the future, our goal is to develop an imaging system that produces a Moiré pattern without a G2 grating.
1. D. Applications of bi-prism interferometry
Our bi-prism setup is the first to explore X-ray phase contrast bi-prism interferometry in a laboratory setup. The bi-prism is a different approach from gratings to produce refracted waves for extracting the properties of X-rays. Its fringe pattern is divergent in most setups. Bi-prisms have had many applications in the optical regime.2 Most of the investigations in X-ray bi-prism applications has been using hard X-rays generated in synchrotrons.3,18-21 However, it has also found application to illustrate the wave-particle behaviour in the single-photon regime.22,23 Bi-prisms have also been used in interference electron microscopy.24
Outline of paper.
In the following we develop analytical expressions for the irradiance distribution of an array of bi-prisms. Using the expressions, we demonstrate the non-periodic pattern characteristic of a bi-prism interferometry system. We also evaluate results of various design parameters for a bi-prims interferometry system. We provide results for 17.5 keV X-rays with silicon and a plastic/epoxy photoresist material (SU-8) demonstrating irradiance distributions for different number of point sources, point source separations, and bi-prism angles. We then investigate the possibility of a nickel bi-prism array for 59 keV that one might consider in the design of a high energy X-ray CT scanner. The results are followed by a discussion of the potential merits of bi-prism interferometry.
2. MATERIALS AND METHODS
2.A. X-ray bi-prism interferometry system
In this paper, we propose a modified X-ray interferometer (Fig. 2) wherein the phase grating (G1) is replaced with an array of Fresnel micro-bi-prisms. A novel design for the source grating (G0) is also provided and the analyzer grating (G2) might be eliminated, though in our present analysis we use a rotated grating (G2) to produce a Moiré pattern. The Fresnel bi-prism produces high-contrast fringes with spatially incoherent X-ray illumination. The bi-prism array is composed of 7,000 sets of two counter-positioned refractive prisms illuminated with multiple sources. X-rays refracting through each prism element overlap and form divergent (magnified) interference fringes on a distant detector. A further advantage when using polychromatic radiation is that the central fringe produced by a bi-prism is always a “white light” fringe.25
Our laboratory bi-prism interferometry system (Fig.4) includes a Rigaku X-ray tube (Rigaku Corp., Akishima-shi, Tokyo, Japan) operating at 17.5 keV with a point-size of 100 μm and a 15 mm wide gold source grating with 0.8 μm apertures separated by 4.8 μm. The bi-prism array consisting of multiple 10 μm bi-prisms with centers separated by 10 μm is curved with radius of 210 mm (We assumed flat in our numerical calculations.), is located 0.53 m from the source grating, and is a plastic/epoxy photoresist material (SU-8) with refraction index decrement of δ = 8.7 × 10⁻⁷. A gold source grating with 0.8 μm apertures separated by 4.8 μm provides multiple point sources to the bi-prisms of coherent sources of X-rays, which are each mutually incoherent. The X-ray tube source size determines the number of point source apertures that illuminate a single bi-prism. We assume that each point source aperture will radiate 17 separate bi-prisms. The detector is a Stanford Photonics CCD camera and is located 1.73 m from the source grating.
Fig. 4.

Lab setup of the bi-prism interferometry system at UCSF. The bi-prism interferometry system includes a molybdenum-target X-ray tube operating at 35 kVp with predominate energy of the 17.5 keV characteristic line (designed energy/wavelength). Shown also is a gold source grating with 0.8 μm apertures separated by 4.8 μm, a bi-prism array made of plastic/epoxy photoresist material (SU-8), and a Stanford Photonics iCCD camera.
Our work is aimed at imaging small objects at energies of 17.5 keV; however, our X-ray source to detector distance is appropriate for a human size X-ray CT scanner. The equations developed in the following section provide parameters that one can change to design a bi-prism interferometry system at higher X-ray energies.
2.B. Analytical expression for the irradiance distribution pattern
In the following section, we develop analytical equations for the irradiance distribution pattern for our bi-prism interferometry system. We use these equations to plot the distribution of fringes for different parameters of a bi-prism interferometry system.
Assuming an X-ray beam proceeding from a spatially incoherent planar source with wavelength λ illuminates a thin bi-prism (Fig. 3), we write the irradiance distribution I of X-ray sources on an arbitrary plane placed at a distance z beyond the bi-prism as2
| (1) |
where η is the distance between the source and the bi-prism, z is the distance between the bi-prism and the imaging plane, ⊗2 is the 2D convolution performed over the transverse coordinates , IS is the irradiance distribution of the planar source, I0 is the irradiance distribution of the Fresnel bi-prism, and I is the irradiance distribution at the observation plane.
For a spherical wavefront proceeding from a point source illuminating a Fresnel bi-prism, the exiting wavefront produces an interference pattern I0 beyond the Fresnel bi-prism whose irradiance distribution is
where p = λ(η + z)/(2ηtanα) is the period of the interference pattern, α = δtanχ is the angle of the beam deflection,3 δ is the refraction index decrement, and χ is the angle of the bi-prism shown in Fig. 5. Here the expression for the period of the interference pattern for X-rays differ from the expression for light:2 p = λ(η + z)/(2(n − 1)ηθ), where n is the index of refraction and θ is the refringence angle of the bi-prism. Note that light rays refract toward the normal to the material interface and X-rays refract away from the normal (Fig. 5).
Fig. 5.

X-ray beam deflection by bi-prism. Here is given the expression for the angle α of the beam deflection and the distance d between the two virtual coherent point sources produced by a bi-prism. δ is the refraction index decrement. Notice the difference in refraction between X-rays and light. (Modified from Chegg Study, www.x-ray-optics.de, and researchgate.net)
Of special interest is a source composed by an array of Ns mutually incoherent point sources with the same irradiance, IP, and arranged equidistant perpendicular to the bi-prism edge and distributed symmetrically to the optical axis. In a realistic experimental situation, the width Δ of the sources along the x- and y-direction would not be infinitesimal. In that case, the irradiance distribution of each source can be written as the convolution between a delta function and a rectangular function of width Δ:
(Note: Here ** refers to the 2D convolution.) If the point sources are located with x-coordintes
where x0 is the separation between neighbor point sources, then from Eq. (1) the irradiance distributions of each point source is
where −z/η is the magnification factor between the source and observation plane. The irradiance distribution of all the sources is therefore the summation of the distribution of source irradiances
Using Mathematica (Wolfram Research, Champaign, Illinois), we come up with the following analytical expression for the irradiance distribution pattern for Nb = 1 (one bi-prism):4
| (2) |
where
is the period of the interference pattern. Notice that the expression is given only as a function of the x-coordinate, assuming the irradiation distribution in y is minimal.
Equation (2) gives an expression for one bi-prism with one and multiple point sources. To obtain an expression for multiple bi-prisms, we used Mathematica to sum the irradiance distribution of Nb shifted bi-prisms separated by xb using the expression
to obtain the following expression for multiple bi-prisms and multiple sources:
| (3) |
3. RESULTS
Mathematica was used to numerically evaluate Eq. (2) to obtain fringe patterns behind a bi-prism for incoherent X-ray point sources located at η = 0.4 m in front of the bi-prism (see Fig. 6). For the calculation we set λ = 7.1 × 10⁻¹¹m, Ip = 1/Δ2, Δ = 7.00 × 10⁻⁷, and α = δtan(χ), where δ = 1.57 × 10⁻⁶. Using these parameters, calculations were made for 25-point sources with a bi-prism angle of χ = 82°. The scale increases in proportion to the number of point sources.4 Non-periodic visibility is seen in Fig. 6. This is characteristic of a fringe pattern for a bi-prism and differs from the periodic pattern of the well-known Talbot–Lau interferometer with gratings in Fig. 1.
Fig. 6.

Density plot of a fringe pattern for 25-point sources with 1 bi-prism. The amplification of the interference pattern is repeated at non-periodic distances away from the plane of the bi-prism. For the calculation we set λ = 7.1 × 10⁻¹¹ m (17.5 keV), Ip = 1/Δ2, Δ= 7.00 × 10⁻⁷ m, α = δtan (χ), δ = 1.58 × 10⁻⁶ (silicon), χ = 82°, η = 0.4 m, and x0 = 36.7 μm. This figure is modified with new parameters from that of our previous publication.4
Notice that in our calculations using Eq. (2) we set the irradiance Ip of each point source to 1/Δ2. One might want to consider this to be a flux of 1 photon per Δ2. Then the resultant intensity in Eq. 2 is a total number of photons. However, since we do not know the photon flux of the source, we interpret the result of Eq. (2) as a relative measure or factor of increase in intensity. Keep in mind that our equations represent refraction and do not include attenuation.
Mathematica was also used to numerically evaluate Eq. (3) to obtain a density plot in Fig. 7 of a fringe pattern behind one bi-prism with 17-point sources for set of parameters used in our laboratory setup that differed from those in Fig. 6.
Fig. 7.

Density plot of a fringe pattern for 17-point sources with 1 bi-prism for a different set of parameters than those in Fig. 6. For the calculation we set λ = 7.1 × 10⁻¹¹ m (17.5 keV), Ip = 1/Δ2, Δ = 8.00 × 10⁻⁷ m, α = δtan (χ), δ = 8.7 × 10⁻⁷ [plastic/epoxy photoresist material (SU-8)], χ = 85.3°, η = 0.53 m, and x0 = 4.8 μm, xb = 10 μm. There is a fringe separation of 1.09 × 10⁻⁵ m at z = 1.2 m.
If we change the source separation in Fig. 7 from x0 = 4.8 μm to x0 = 36.7 μm, we see a very different fringe pattern in Fig. 8. This demonstrates that the fringe pattern is sensitive to the distance x0 between the point sources.
Fig. 8.

Density plot of a fringe pattern for 17-point sources with 1 bi-prism for the same set of parameters as those in Fig. 7, except x0 was changed from x0 = 4.8 μm to x0 = 36.7 μm For the calculation: λ = 7.1 × 10⁻¹¹m (17.5 keV), Ip = 1/Δ2, Δ = 8.00 × 10⁻⁷ m, α = δtan (χ), δ = 8.7 × 10⁻⁷ [plastic/epoxy photoresist material (SU-8)], χ = 85.3°, η = 0.53 m, and x0 = 36.7 μm, xb = 10 μm.
The fringe pattern is sensitive to the bi-prism material, the bi-prism angle χ, and the distance x0 between the point sources. In Fig. 6 the fringe pattern corresponds to silicon (δ = 1.58 × 10⁻⁶) with parameters χ = 82°, η = 0.4 m, x0 = 36.7 μm, and Δ = 7.00 × 10⁻⁷ m; whereas, in Fig. 7 the fringe pattern corresponds to SU-8 material (δ = 8.7 × 10⁻⁷) used in our laboratory setup with parameters χ = 85.3°, η = 0.53 m, x0 = 4.8 μm, and Δ = 8.00 × 10⁻⁷. Since the refractive index decrement of SU-8 is less than silicon, thus decreasing the angle of deflection (α = δtanχ); in our design we increased the angle of each bi-prism to χ = 85.3°. Probably the significant increase in the number of non-periodic fringes in Fig. 8 is due to changing the source separation from x0 = 4.8 μm to x0 = 36.7 μm.
The visibility, (Imax − Imin)/(Imax + Imin), was calculated for a few examples by finding the minimum and maximum intensity for ±5 μm in x about the maximum central fringe. If we use 17-point sources with one bi-prism, as in Fig. 8, we obtain a visibility of 0.93. If the point source separation is change from 36.7 μm to 4.8 μm the visibility is improved to 0.95. If for the same point source separation of 36.7 μm, the point source size Δ is changed from 8×10⁻⁷ to 4×10⁻⁷, the visibility is improved even more to 0.98. These trends in the visibility calculations are as one would expect; however, are higher than one would expect in a laboratory X-ray phase contrast interferometer. The work of Isakovic et al.19 provided bi-prism measurements performed at the Brookhaven National Laboratory synchrotron where a single bi-prism was evaluated in an X-ray beam of 9.5 keV. Their data showed a difference in fringe visibility in the vertical and the horizontal axis, with a maximum fringe visibility in the vertical above 0.9 and approximately 0.6 in the horizontal axis. From this, they calculated an effective asymmetric source of their beamline as a vertical source of 10 ± 5 μm and a horizontal source of 130 ± 20 μm. From generally known parameters, the transverse coherence length of that beamline would be ~160 μm in the vertical and ~12.3 μm in the horizontal. In the simulation of our laboratory setup, we use an array of 0.8 - μm sources at 0.53-meters in front of an array of bi-prisms. At 17.5 KeV, the transverse coherence length of the operable axis is 11.8 - μm and one would expect to produce one central fringe per each source/bi-prism pair. Of course, our proposed setup is an array of bi-prisms with a source grating as an array of small sources; thus, the detector records many such fringes each falling in resonant positions.
Again, using Mathematica to numerically evaluate Eq. (3), we obtained a fringe pattern behind 101 bi-prisms for 17-point sources. Notice in Fig. 7 that for a single bi-prism the maximum intensity is at approximately z = 1.2 m, whereas, in Fig. 9 for 101 bi-prisms, the maximum intensity appears to be at z = 1.05 m. Increasing the number of bi-prisms increases the fringe intensity and shifts the maximum intensity toward the sources while bringing the maximum fringe intensity more in focus and greatly reducing fringe intensity in other regions.
Fig. 9.

Density plot of a fringe pattern for 17-point sources with 101 bi-prism for the same set of parameters as in Fig. 7. For the calculation we set λ = 7.1 × 10⁻¹¹m (17.5 keV), Ip = 1/Δ2, Δ= 8.00 × 10⁻⁷ m, α = δtan (χ), δ = 8.7 × 10⁻⁷[plastic/epoxy photoresist material (SU-8)], χ = 85.32°, η = 0.53 m, and x0 = 4.8 μm, xb = 10 μm. There is a fringe separation of 1.00 × 10⁻⁵ m at z = 1.05 m.
The equations developed in this section provide plots of the non-periodic fringe pattern, the intensity of the maximum fringe intensity, and the fringe separation at the maximum fringe intensity for our laboratory bi-prism design. Equation (3) was used to compare different possible designs of a bi-prism interferometry system for parameters given in Table 1. Designs were compared between a bi-prism material of our present lab setup of plastic/epoxy photoresist material (SU-8) and silicon at 17.5 keV. The refractive index decrement for SU-8 was not listed in the CXRO online calculator,27 but is a similar plastic to PMMA. The paper of Mamyrbayev et al.26 states on page 7 that the refractive index of SU-8 is 9.23×10⁻⁷ at 17 keV, which is the value CXRO calculates for PMMA at 17 keV. The evaluations in our paper were performed for 17.5 keV, thus we used the value of δ = 8.7 × 10⁻⁷ for SU-8 at 17.5 keV which is the value for PMMA at 17.5 keV in the CXRO online calculator.27
Table 1.
Equation (3) was used to calculate the fringe separation and the fringe intensity for our laboratory bi-prism SU-8 material and compared to silicon at 17.5 keV. The fringe separation was nearly 10 μm for our laboratory setup and would be the same for the designated parameters for a bi-prism material of silicon. The same equation was used to design a bi-prism nickel interferometry system at 59 keV. The distances between the bi-prisms and the selected detector positions were determined by observing the density plots like the one in Fig. 9.
| Design 1 (Fig. 6) |
Design 2 | Design 3 | Design 4 (Fig. 9) |
Design 5 | |
|---|---|---|---|---|---|
| Bi-prism material | Silicon | plastic/epoxy photoresist (SU-8) | Silicon | plastic/epoxy photoresist (SU-8) | Nickel |
| Energy | 17.5 keV | 17.5 keV | 17.5 keV | 17.5 keV | 59 keV |
| Wave length λ | 7.1 × 10⁻¹¹m | 7.1 × 10⁻¹¹m | 7.1 × 10⁻¹¹m | 7.1 × 10⁻¹¹m | 2.14 × 10⁻¹¹ |
| Refractive index decrement δ | 1.58 × 10⁻⁶* | 8.7 × 10⁻⁷** | 1.58 × 10⁻⁶* | 8.7 × 10⁻⁷** | 5.06 × 10⁻⁷+ |
| Bi-prism angle χ | 82° | 85° | 82° | 85.3° | 87° |
| Angle of deflection α | 11.2× 10⁻⁶ | 9.9× 10⁻⁶ | 11.2× 10⁻⁶ | 10.63× 10⁻⁶ | 9.66 × 10⁻⁶ |
| Bi-prism separation xb | --- | --- | 10 μm | 10 μm | 3.65 μm |
| Number of bi-prisms Nb | 1 | 1 | 101 | 101 | 101 |
| Number of X-ray sources Ns | 25 | 25 | 17 | 17 | 17 |
| Source size Δ | 7.00 × 10⁻⁷m | 7.00 × 10⁻⁷m | 8.00 × 10⁻⁷m | 8.00 × 10⁻⁷m | 8.00 × 10⁻⁷m |
| Pt. source separation x0 | 36.7 μm | 36.7 μm | 4.8 μm | 4.8 μm | 6 μm |
| Distance between source and bi-prism η | 0.4 m | 0.4 m | 0.53 m | 0.53 m | 0.51 m |
| Distance between bi-prism and detector z | 1.38 m | 1.4 m | 1.14 m | 1.05 m | 1.19 m |
| Fringe separation |
14.1× 10⁻⁶ m | 16.1 × 10⁻⁶ m | 10.0 × 10⁻⁶ m | 10.0 × 10⁻⁶ m | 3.69 × 10⁻⁶ m |
| Factor of increase in fringe intensity |
46.2 | 48.6 | 2176 | 2052 | 1733 |
CXRO online calculator26
X-Ray Optics Calculator (http://purple.iptm.ru/xcalc/xcalc_mysql/ref_index.php)28
By selecting different bi-prism materials, one can design a system that would be appropriate for an X-ray CT system with higher X-ray source energy than the 17.5 keV used here in our validations. In our demonstrations here, we have attempted to keep the distance between the X-ray source and detector with reasonable real world X-ray imaging applications. By modifying the bi-prism material and angle of the bi-prism one maintains reasonable X-ray source to detector distances. Silicon and our laboratory SU-8 material are not ideal for a higher energy of 59 keV. A better material would be nickel. A value of δ = 5.06 × 10⁻⁷ was obtained for nickel at 59 keV from the X-Ray Optics Calculator.28 As one sees from Table 1, the fringe separation decreased by a factor of approximately 3. The angle of the bi-prism is also a function of the material with silicon requiring a smaller angle to bring the detector distance close to that of our SU-8 material, whereas in Table 1 we see that an increased angle of 87°is required for nickel.
In a previous publication4 we showed that the distance to the maximum fringe pattern is sensitive to small changes in the angle of the bi-prism. To study this, one can look at a simple case of one point source and one bi-prism. We first write the intensity in Eq. (1) as a function of the angle of the bi-prism χ:
| (4) |
where z is the distance between the bi-prism and the fringe pattern and x is the lateral distance on the detector. One can then take the partial derivative of the intensity with respect to the angle to come up with the expression:
Using this expression, we obtain plots of the sensitivity of the Intensity as a function of the angle of the bi-prism (Fig. 10). One sees that the derivative of the Intensity is fairly flat near the central fringe x = 0 for z = 1 m until the angle nears π/2=1.5708; then it changes rapidly for an energy of 17.5 keV [Fig.10(a)]. For 59 keV, the change is more dramatic near π/2 [Fig.10(b)].
Fig. 10.
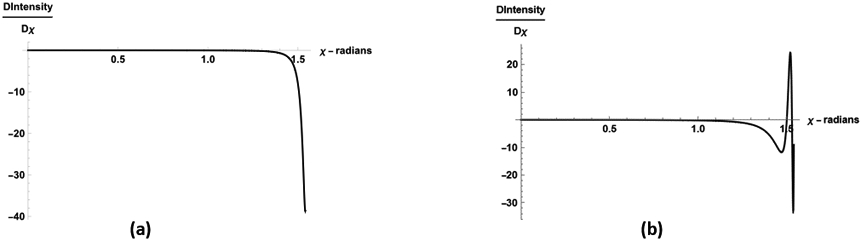
Sensitivity as a function of bi-prism angle χ for X-ray source energies of (a) λ = 7.1 × 10⁻¹¹m (17.5 keV) and (b) λ = 2.14 × 10⁻¹¹m (59 keV). For the calculation we set Ns = 1, Nb = 1, Ip = 1/Δ2, Δ= 8.00 × 10⁻⁷ m, δ = 8.7 × 10⁻⁷ (SU-8), η= 0.53 m, x = 0.000001 m, and z = 1 m.
Using Eq. (4) one can study the Intensity variation due to the size of the point source aperture Δ and the point source separation x0. For the parameters in Fig. 9, increasing the point source aperture Δ will as shown in Fig. 11 decrease the maximum fringe intensity until the aperture Δ approaches that of a point source aperture separation of 4.8 μm with a minimum around 7 μm. The Intensity then increases as the apertures continue to overlap the separation between point sources. In Fig. 12 we see that the Intensity will be maximum for point source separations x0 at factors of xb/2 = 5 μm. This is helpful because we can see that if we change the value of xb to 5 in Fig. 9, we would have come up with a better factor of increase in intensity of 3238 with a fringe separation of 10.0 × 10⁻⁶ m at z = 1.06 m.
Fig. 11.

Intensity as a function of point source size . For the calculation we set Ns = 17, Nb = 101, Ip = 1/Δ2, δ = 8.7 × 10⁻⁷ (SU-8), χ = 85.32°, η = 0.53 m, x0 = 4.8 μm, xb = 10 μm, x = 0 m, and z = 1.06 m.
Fig. 12.

Intensity as a function of separation between point sources x0. For the calculation we set Ns = 17, Nb = 101, Ip = 1/Δ2, Δ= 8.00 × 10⁻⁷ m, δ = 8.7 × 10⁻⁷ (SU-8), χ = 85.32°, η = 0.53 m, xb = 10 μm, x = 0 m, and z = 1.06 m.
4. DISCUSSION
This study provides expressions for fringe patterns of bi-prism interferometry and demonstrates maximum fringe visibility regions that are not periodic as is common with Talbot–Lau interferometry systems using diffraction gratings. Using the same analytical expressions, we calculate maximum fringe contrast and fringe periods for different X-ray source sizes and separations; and bi-prism design parameters of material, angle, size, number, period, and distances between the source and detector. The expressions are used to design and calibrate our laboratory system so that experiments can be performed that would be appropriate in the design of X-ray CT systems with higher energies and with high-power X-tubes capable of providing phase images almost instantaneously.
4.A. Advantages of a single exposure bi-prism interferometry system
The well-established grating-based method of phase contrast X-ray imaging may yet prove capable of clinical applications. Still, alternative approaches such as the bi-prism method herein discussed holds several possible advantages. For good flux throughput, we have constructed a bi-prism array from the polymer SU8, a popular photoresist useful with LIGA processes. SU8 is a photoactive compound with some high Z components in low percentages. For 17 keV, the data yields 1/e absorption lengths for the polymer of 1825 μm, or a transparency of 97% for our optic design.
A bi-prism works well with polychromatic X-rays, as the fringe period is, in part, determined by the separation of the two virtual sources. This spacing is not fixed, as with a grating or Young’s double slit, but rather varies dependent on the refractive index of the prism material relative to X-ray wavelength. Whereas, under polychromatic illumination the design of a grating system should be optimized for a particular frequency of X-rays.29
Moreover, the fringe period generated from a laboratory bi-prism setup has a relatively large magnification factor of approximately 2.5X. Some publications30,31 have shown that modifying the standard Talbot-Lau interferometer where by the G1 grating is placed close to the source can also increase magnification factors similar to those in our bi-prism system. A larger fringe period at the detector could allow using a structured scintillator to record Moiré patterns. A hexagonal structured scintillator (Fig. 13) might aid the fast acquisition of phase contrast data of X-ray attenuation, phase, and small angle scatter. However, there are some challenges with using bi-prisms as well, mostly related to poorer spatial resolution. Even though, bi-prism-based interferometry, or other refractive-optical approaches, hold the potential to revolutionize phase-contrast and dark-field X-ray CT.
Fig. 13.

Proposed cone-beam tensor tomography system. The X-ray source and optics rotate around an axis aligned to the center of an area detector with hexagonally segmented crosstalk-free scintillation elements. The components are mounted on a revolving gantry (for clarity, not shown here). X-ray scatter data is captured for three specific orientations 120° apart for every angular view.
In our previous paper32 we performed simulations using wave optics to evaluate X-ray phase contrast imaging with grating interferometry using phase stepping and with bi-prism interferometry using single exposure Moiré fringe analysis. Results of reconstructed vector coefficients of small angel scatter showed that bi-prism interferometry with single-exposure Moiré fringe analysis has an increase in noise compared to grating interferometry using phase stepping because of 1/8th the number of projection samples but provides better CNR due to better photon flux with less dose and faster acquisition times.
4.A.1. Design of structured scintillators
The implementation of a structured scintillator5,6 fits well into our design of an X-ray bi-prism interferometry system with single-exposure Moiré fringe analysis because it reduces crosstalk between pixels of our high-resolution large fringe separation. Though the authors of this referenced work aimed their development for grating systems, a structured scintillator is ideal for our bi-prism interferometry system. The structure scintillator consists of filling an array of silicon pores with a thallium-doped cesium iodide [CsI(Tl)] scintillator. The pores act as a mold which are filled with melted CsI(Tl) powder. Before filling, the walls are coated thermally with an oxide layer to provide a wave guide to direct the light and reduce noise between pixels. The design of a structured scintillator prevents crosstalk and allows opportunity for Moiré fringe development when illuminated with spatially modulated X-ray illumination. Moiré patterns occur because of the interaction between the pixelated image sensor and the periodic pore structure of the scintillator. The magnitude of this occurrence depends on the ratio of the respective pitches, the geometries involved and the amount of angular misalignment. The Moiré pattern is ideal for the extraction of dark field scatter by taking the first harmonic of the Fourier transform. The work of Rutishauser et al.6 showed an increase in fringe visibility at X-ray energies around 60 keV (greater than our simulations of 17.5 keV), leading to an improvement in the quality of the differential phase and dark field data compared to a conventional grating interferometry system.
4.A.2. Parameter range for a bi-prism interferometry system
In our laboratory setup, we have been using a Rigaku X-ray tube with molybdenum anode operating at 35kVp, where 17.5 keV is the predominate energy with a point-size of 100 μm and a 15 mm wide gold source grating with 0.8 μm apertures separated by 4.8 μm. We assume the multiple point source apertures are the “open windows” of the source grating. These are much smaller than the “closed bars” of a typical source grating and provide to the bi-prism array multiple coherent sources of X-rays, which are each mutually incoherent. There is some reduction in image resolution by using laboratory X-ray tube sources. The actual laboratory X-ray source size is that of a typical X-ray tube and determines the number of “open window” point sources that illuminate a single bi-prism. We assume that each point source aperture will radiate 17 separate bi-prisms. The intensity of the fringe visibility increases with the number of sources and the number of sources seen by each bi-prism. The intensity is maximum if the source separation is a factor of one-half the width of the bi-prism. The intensity also increases with the increase in the angle of the bi-prism. The rate of change of this increase is fairly flat until the angle of the bi-prism nears 90°.
Our bi-prism system design, like that proposed by Yaroshenko et al.33 for a grating interferometry system, offers the potential for future X-ray CT application by providing high fringe visibility at shorter propagation distances. They demonstrated that using phase gratings with triangular-shaped structures in an X-ray interferometer can yield high visibilities for significantly shorter propagation distances than conventional gratings with binary structures. This is especially important in the design of human systems where bore sizes are approximately 75-85 cm.
Although similar in construction as Yaroshenko et al33 our interferometry methods follow Doblas et al.2 - albeit with X-rays rather than visible light. Where Doblas et al. use multiple coherent sources and a single Fresnel bi-prism, we use an array of Fresnel bi-prisms. The full setup yields multiple fringe patterns in resonant superposition with a large field of illumination. Fundamentally, this is a different way to make interference fringes. A single coherent X-ray source can illuminate a single Fresnel bi-prism and produces interference fringes downfield. The fringe patterns produced by our array of bi-prisms are only indirectly related to the array period, but are the direct result of the periodicity of the virtual sources created by the individual bi-prisms in the array. Interference fringes produced by a grating are directly related to the period of the grating, and this includes a triangular-profile grating such as used by Yaroshenko et al.33 Moreover, their work highlights the benefit of closer spacing of 10 cm between the phase grating and analyzer grating. This is the opposite effect we are pursuing in our approach with a bi-prism array to analyzer/structured detector of 1.06 m.
Periodic replication of a grating, which is the Talbot effect, results from the overlapping zero-order, 1st order and −1st order diffracted beams, when those beams encounter a screen (detector). Yaroshenko et al.33 rightly calls for future work on sinusoidal amplitude gratings as those gratings produce only those diffraction orders. Their triangular-shaped grating system clearly demonstrates periodic longitudinal spacing of fringe visibility regions.
Our goal has been to keep the dimensions of our laboratory system within something that would fit a present-day large bore X-ray CT scanner. Though our initial work is aimed at imaging small objects at energies of 17.5 keV, we have performed calculations using Eq. (3) to see how the parameters of the bi-prism system would change at higher X-ray energies. For example, if we were to image at 59 keV, because of the change in refraction index decrement at higher energies, we would have to modify the material of the bi-prism to something like nickel in Table 1 to obtain reasonable fringe visibility at 1.19 m from the bi-prism array with a fringe separation of 3.69 μm.
Recent advances in grating fabrication techniques34,35 alleviate some concerns regarding high-energy X-ray phase contrast imaging. The pattern height of our laboratory G0 grating is 24 microns, however 200 microns are now available, which could be available for higher energies. Much of the X-ray flux is absorbed by G0. Thus, with higher energies the thicker G0 grating will have its effect on flux. However, current CT tube technology, can operate at >100 kW for the scan duration necessary to acquire clinical tensor tomographic data including attenuation, phase, and small angle scatter information.
4.A.3. Advantages of single shot approaches
There are single shot approaches,7-11 which render phase, scattering, and attenuation data from single projection measurements without mechanical phase stepping measurements at each projections angle. The challenges of mechanical phase stepping are the need to obtain precise grating positing at multiple measurements per projection angle, whereas single shot approaches of data acquisition have shorter acquisition times and have better mechanical stability. However, the paper of von Teuffenbach et al.36 does point out some negative aspects of previous single shot methods. For example, the reverse projection method8 combines two interferograms taken exactly 180 degrees apart, which requires stability of the grating alignment for each view and gives only access to attenuation and differential phase-contrast projection images. The implementation of helical and cone beam tomography would be difficult. The Moiré analysis method7 using a slight detuning of the interferometer suffers from loss in resolution in one dimension of the detector. The sliding window method11 requires only a single interferogram per projection angle, but changes the grating position at each angular position. Missing interferograms are simply interpolated from adjacent projection angles. This works well for scans with high angular sampling.
The paper of von Teuffenbach et al.36 compares three single shot approaches and demonstrate that it is possible to successfully reconstruct the linear attenuation coefficient, the refractive index and the linear diffusion coefficient (measure of small angle scatter attenuation) using a single measurement per projection angle without grating movements. In their paper using the interferogram-based statistical iterative reconstruction (IBSIR) method of data reconstruction, they compare: 1. an equidistant phase stepping (PS) acquisition where the analyzing grating was shifted by 1/3rd the grating period to obtain 3 measurements at 101 equal angular positions over 360° (identified as PS-IBSIR); 2. a sliding window phase-stepping (SW) acquisition that records only one measurement at each of 303 equal angular positions over 360° with the analyzing grating shifted by 1/3rd its period before the next acquisition (SW-IBSIR); and 3. a single shot electromagnetic phase-stepping acquisition (SSEPS) recording a single image at each of 303 equal angular positions over 360° with the position of the X-ray focal spot shifted from the previous acquisition before each measurement (SSEPS-IBSIR). These three methods provided the same number of measurements. The PS-IBSIR showed artifacts at sharp boundaries, probably due to the finer angular sampling even though the same number of measurements. The SW-IBSIR and SSEPS-IBSIR methods showed similar X-ray attenuation reconstruction with the SW-IBSIR method showing a slightly better contrast but showing more artifacts in the phase reconstruction and somewhat more noise in the reconstruction of the scatter diffusion coefficient. As can be seen from the author’s very nice display of the Radon space sampling, even though both methods provide the same number of angular sampling, the regular sampling of SW-IBSIR method probably has more aliasing than the irregular sampling of the SSEP-SIBSIR method with the motion of the X-ray focus spot. This Radon space sampling proposes interesting future investigations similar to those that have been pursued using data compression with irregular Fourier space sampling in MRI.37,38 The proposed electronic phase stepping acquisition protocol incorporated into an interferometry system would be perfectly suited for application with a clinical CT system because the required focal spot sweeping is already available in most modern clinical CT systems and the technique is well suited for a continuously rotating gantry; however, it supposes one could design an X-tube with electronic phase stepping without focal spot sweeping.
4.B. X-ray tube design for virtual electronic phase stepping
Electromagnetic phase-stepping (EPS)39 moves an electrical beam to move projections of the object across the detector whereby the shifted images are combined to form pseudo phase-stepping images. Here we propose a single-shot image acquisition approach using a novel X-ray source that provides for “virtual” electronic phase stepping without focal spot sweeping. This approach involves using an X-ray interferometer imaging system where the X-ray tube has multiple X-ray origins/spots. The tube is operated in such a way that each spot is temporally modulated at differing frequencies, and spatially modulated to form illumination beams with differing fringe locations as observed in the interferometer. Composite images of an object acquired with the interferometer are subsequently separated according to the flashing source that provided the illumination. This is accomplished via de-multiplexing transform processes40 based on the known temporal multiplexing transform of the source. After an alignment step, the isolated images from a single composite image/exposure have the same view of the object but with different fringe locations relative to a feature in the object. An isolated image group of each single view are then analyzed to yield images representing the differential phase shift, attenuation, and X-ray scattering features of the object. All of the X-ray optical components in the interferometer, either a Talbot-Lau or a biprism setup, remain fixed and motionless.
A high-power X-ray tube design that does this full work of virtual electronic phase stepping during a single exposure is illustrated in Fig. 14. Here, a binary multiplexing transform of the X-ray output is conducted by normal tube operation. Multiple X-ray spots are generated on the side of a rotating and linearly-translated cylinder. An X-ray window allows that G0, is illuminated by each spot, but at slightly different angles. The oscillating linear translation, about 2 Hz, carries the anode past separate, adjacent, focused, and identical high-current electron guns. As the anode cylinder walls are patterned, either with metal/insulator or with ridges/grooves, in varying stepped spatial periods, each X-ray spot turns on/off at different frequencies.
Fig. 14.

Illustration of multiple-spot cylindrical rotating anode X-ray tube with oscillating translation for phase/dark-field single-shot data acquisition. (a.) Anode at minimum extension, (b.) Anode at maximum extension, detail: showing multiple spot tracks/flash rates 1.) Low frequency spot, 2.) Lower mid-frequency spot, 3.) Higher mid-frequency spot, 4.) High-frequency spot, 5.) Very high-frequency spot. (Image courtesy of Rigaku Corp., Akishima-shi, Tokyo, Japan.)
Other multiplexing transforms can result from different patterning, which might work better with slower detectors. Lower power tubes can control the electron guns independently to accomplish a similar multiplexed X-ray tube output.
5. CONCLUSION
Phase-contrast and dark-field X-ray CT for clinical human use will require advancements in X-ray optics, X-ray sources, and X-ray detectors. As an alternative X-ray optical component, a Fresnel bi-prism array adds to the set of tools available for the development of phase contrast imaging systems. Here, we present one possible approach that is somewhat like an “inverse geometry Talbot-Lau” setup, but with improved fringe visibility. Other bi-prism-based interferometry approaches are possible, including combinations with phase gratings. We also present an advanced X-ray tube design that offers single-shot “virtual electronic phase stepping.” These two technologies, when combined with previously demonstrated structured-scintillator detectors, can provide separate phase, dark-field, and attenuation signals without the need for mechanical phase stepping. A system employing these components could be made to capture X-ray dark field projections for direct tomographic tensor reconstruction of small angle scatter. The review of the literature presents evidence of advancement in hardware (without grating phase stepping) and of new algorithm developments that could provide fast single shot acquisition with mechanical simplicity delivering less radiation exposure and faster acquisition times
ACKNOWLEDGEMENTS
This work was supported in part by the National Institutes of Health under Grant Nos. R43 EB027535, R01 EB026331, and R01 HL135490.
Footnotes
CONFLICT OF INTEREST
The authors have no conflict of interest.
DATA AVAILABILITY
Data distribution is available through an appropriate data sharing agreement between institutions.
References
- 1.Momose A, X-ray phase imaging reaching clinical uses. Phys Med. 2020;79:93–102. [DOI] [PubMed] [Google Scholar]
- 2.Doblas A, Saavedra G, Martinez-Corral M, Barreiro JC, Sanchez-Ortiga E, Llavador A, Axial resonance of periodic patterns by using a Fresnel biprism. J Opt Soc Am A. 2013;30:140–148. [DOI] [PubMed] [Google Scholar]
- 3.Ablett JM, Evans-Lutterodt K, Stein A, Hard x-rays Fresnel prisms: Properties and applications, in Design and Microfabrication of Novel X-ray Optics II, Snigirev AA and Mancini DC, Eds. Proceedings of SPIE, vol. 5539, August 2, 2004. [Google Scholar]
- 4.Gullberg GT, Fuller M, Shrestha U, Seo Y, Tensor tomography of dark field scatter using x-ray interferometry with bi-prisms. 2017 IEEE Nuclear Science Symposium and Medical Imaging Conference Record (NSS/MIC), Oct. 21 – 28, 2017, Atlanta, Georgia. [DOI] [PMC free article] [PubMed] [Google Scholar]
- 5.Sahlholm A, Svenonius O, Petersson S, Scintillator technology for enhanced resolution and contrast in X-ray imaging. Nuclear Instruments and Methods in Physics Research Section A: Accelerators, Spectrometers, Detectors and Associated Equipment. 2011;648:S16–S19. [Google Scholar]
- 6.Rutishauser S, Zanette I, Donath T, Sahlholm A, Linnros J, David C, Structured scintillator for hard x-ray grating interferometry. Appl Phys Lett. 2011;98(17):171107 – 171107-3. [Google Scholar]
- 7.Seifert M, Gallersdörfer M, Ludwig V, Schuster M, Horn F, Pelzer G, Rieger J, Michel T, Anton G, Improved reconstruction technique for Moiré imaging using an X-ray phase-contrast Talbot–Lau interferometer. J Imaging. 2018;4(62):68–81. [Google Scholar]
- 8.Zhu P, Zhang K, Wang Z, Liu Y, Liu X, Wu Z, McDonald SA, Marone F, Stampanoni M, Low-dose, simple, and fast grating-based X-ray phase-contrast imaging. Proc Natl Acad Sci. 2010;107:13576–81. [DOI] [PMC free article] [PubMed] [Google Scholar]
- 9.Bennett EE, Kopace R, Stein AF, Wen H, A grating-based single-shot X-ray phase contrast and diffraction method for in vivo imaging. Med Phys. 2010;37:6047–54. [DOI] [PMC free article] [PubMed] [Google Scholar]
- 10.Wen HH, Bennett EE, Kopace R, Stein AF, Pai V, Single-shot X-ray differential phase-contrast and diffraction imaging using two-dimensional transmission gratings. Opt Lett. 2010;35:1932–4. [DOI] [PMC free article] [PubMed] [Google Scholar]
- 11.Zanette I, Bech M & Rack A Trimodal low-dose X-ray tomography. Proceedings of the National Academy of Sciences 2012;109:10199–204. [DOI] [PMC free article] [PubMed] [Google Scholar]
- 12.Liu H, Cartwright AN, Basaran C, Sensitivity improvement in phase shifted moiré interferometry using 1D continuous wavelet transform image processing. Opt Eng. 2003;42:2646–52. [Google Scholar]
- 13.Liu H, Cartwright AN, Basaran C, Moiré interferogram phase extraction: A ridge detection algorithm for continuous wavelet transforms. Appl Opt. 2004;43(41):850–857. [DOI] [PubMed] [Google Scholar]
- 14.Bevins N, Zambelli J, Li K, Qi Z, Multicontrast x-ray computed tomography imaging using Talbot-Lau interferometry without phase stepping. Med Phys. 2012:39:424–428. [DOI] [PMC free article] [PubMed] [Google Scholar]
- 15.Marschner M, Willner M, Potdevin G, Fehringer A, Noël PB, Pfeiffer F, Herzen J, Helical X-ray phase-contrast computed tomography without phase stepping. Sci Rep. 2016;6:23953. [DOI] [PMC free article] [PubMed] [Google Scholar]
- 16.Itoh H, Nagai K, Sato G, Yamaguchi K, Nakamura T, Kondoh T, Ouchi C, Teshima T, Setomoto Y, Den T, Two-dimensional grating-based X-ray phase-contrast imaging using Fourier transform phase retrieval. Opt Express. 2011;19(4):3339–46. [DOI] [PubMed] [Google Scholar]
- 17.Miao H, Panna A, Gomella AA, Bennett EE, Znati S, Chen L, Wen H, A universal moiré effect and application in X-ray phase-contrast imaging. Nat Phys. 2016;12:830–4. [DOI] [PMC free article] [PubMed] [Google Scholar]
- 18.Suzuki Y, Takeuchi A, Hard x-ray holographic microscopy using refractive prism and Fresnel zone plate objective. Rev Sci Instrum. 2005;76:093702. [Google Scholar]
- 19.Isakovic F, Stein A, Warren JB, Sandy AR, Narayanan S, Sprung M, Ablett JM, Siddons DP, Metzler M, Evans-Lutterodt K, A bi-prism interferometer for hard X-ray photons. J Synchrontron Radiat. 2010;17:451–5. [DOI] [PubMed] [Google Scholar]
- 20.Zverev D, Snigireva I, Kohn V, Kuznetsov S, Yunkin V, Snigirev A, X-ray phase-sensitive imaging using a bilens interferometer based on refractive optics. Opt Express 2020;28(15):21856. [DOI] [PubMed] [Google Scholar]
- 21.Lang AR, Makepeace APW, Production of synchrotron x-ray biprism interference patterns with control of fringe spacing. J Synchrotron Rad. 1999;6:59–61. [Google Scholar]
- 22.Jacques V, Wu E, Toury T, Treussart F, Aspect A, Grangier P, Roch J-F, Single-photon wavefront-splitting interference: An illustration of the light quantum in action. Eur Phys J D 2005;35:561–565. [Google Scholar]
- 23.Jacques V, Lai ND, Dréau A, Zheng D, Chauvat D, Treussart F, Grangier P, Roch J-F, Illustration of quantum complementarity using single photons interfering on a grating. New J Phys. 2008;10:123009. [Google Scholar]
- 24.Missiroli GF, Pozzi G, Valdri U, Electron interferometry and interference electron microscopy. J Phys E Sci Instrum. 1981;14:649–71. [Google Scholar]
- 25.Jenkins FA and White HE, Fundamentals of Optics (Fourth Edition) 2011. (McGraw Hill; ). [Google Scholar]
- 26.Mamyrbayev T, Ikematsu K, Meyer P, Ershov A, Momose A, and Mohr J, Super-resolution scanning transmission X-ray imaging using single biconcave parabolic refractive lens array. Sci Rep. 2019; 9: 14366. [DOI] [PMC free article] [PubMed] [Google Scholar]
- 27.The Center for X-ray Optics Database, Lawrence Berkeley National Lab, https://henke.lbl.gov/optical_constants/. [Google Scholar]
- 28.Serguei Kuznetsov, X-Ray Optics Calculator, IMT RAS, Chernogolovka, Russia, http://purple.iptm.ru/xcalc/xcalc_mysql/ref_index.php. [Google Scholar]
- 29.Thuering T, Barber WC, Seo Y, Alhassen F, Iwanczyk JS, Stampanoni M, Energy resolved X-ray grating interferometry, Appl Phys Lett. 2013;102:191113. [Google Scholar]
- 30.Donath T, Chabior M, Pfeiffer F, Bunk O, Reznikova E, Mohr J, Hempel E, Popescu S, Hoheisel M, Schuster M, Baumann J, David C, Inverse geometry for grating-based x-ray phase-contrast imaging. J Appl Phys. 2009;106:054703. [Google Scholar]
- 31.Momose A, Kuwabara H, Yashiro W, X-ray phase imaging using Lau effect. Appl Phys Express 2011;4:066603. [Google Scholar]
- 32.Tao W, Sung Y, Kim SJW, Huang Q, Gullberg GT, Seo Y, Fuller M. Tomography of dark field scatter using single-exposure Moiré fringe analysis of x-ray bi-prism interferometry – A simulation study. Med Phys. July 2021;00:1–19. DOI: 10.1002/mp.15134. [DOI] [PMC free article] [PubMed] [Google Scholar]
- 33.Yaroshenko A, Bech M, Potdevin G, Malecki A, Biernath T, Wolf J, Tapfer A, Schüttler M, Meiser J, Kunka D, Amberger M, Mohr J, Pfeiffer F, Non-binary phase gratings for x-ray imaging with a compact Talbot interferometer. Optics Express. 2014;22(1): 547–56. [DOI] [PubMed] [Google Scholar]
- 34.Finnegan P, Hollowell AE, Arrington CL, Dagel AL. High aspect ratio anisotropic silicon etching for x-ray phase contrast imaging grating fabrication. Mater Sci Semicond Process. 2019;92:80–5. [Google Scholar]
- 35.Hollowell AE, Arrington CL, Finnegan P, Musick K, Resnick P, Volk S, Dagel AL. Double sided grating fabrication for high energy X-ray phase contrast imaging Mater Sci Semicond Process. 2019;92:86–90. [Google Scholar]
- 36.von Teuffenbach M, Koehler T, Fehringer A, Viermetz M, Brendel B, Herzen J, Proksa R, Rummeny EJ, Pfeiffer F, Noël PB, Grating-based phase-contrast and dark-field computed tomography: a single-shot method. Scientific Reports 2017;7.1: 1–8. [DOI] [PMC free article] [PubMed] [Google Scholar]
- 37.Lustig M, Donoho DL, Pauly JM, Sparse MRI: The application of compressed sensing for rapid MR imaging. Magn Reson Med. 2007;58(6):1182–95. [DOI] [PubMed] [Google Scholar]
- 38.Lustig M, Donoho DL, Santos JM, Pauly JM, Compressed sensing MRI. IEEE Signal Processing Magazine 2008;March:72–82. [Google Scholar]
- 39.Miao H, Chen L, Bennett EE, Adamo NM, Gomella AA, DeLuca AM, Patel A, Morgan NY, Wen H, Motionless phase stepping in X-ray phase contrast imaging with a compact source. Proc Natl Acad Sci. 2014;111(52):19268–72. [DOI] [PMC free article] [PubMed] [Google Scholar]
- 40.Zhang J, Yang G, Lee Y, Chang S, Lu JP, Zhou O, Multiplexing radiography based on carbon nanotube field emission x-ray technology. Proceedings Volume 6510, Medical Imaging 2007: Physics of Medical Imaging; 65100W (2007). [Google Scholar]
Associated Data
This section collects any data citations, data availability statements, or supplementary materials included in this article.
Data Availability Statement
Data distribution is available through an appropriate data sharing agreement between institutions.