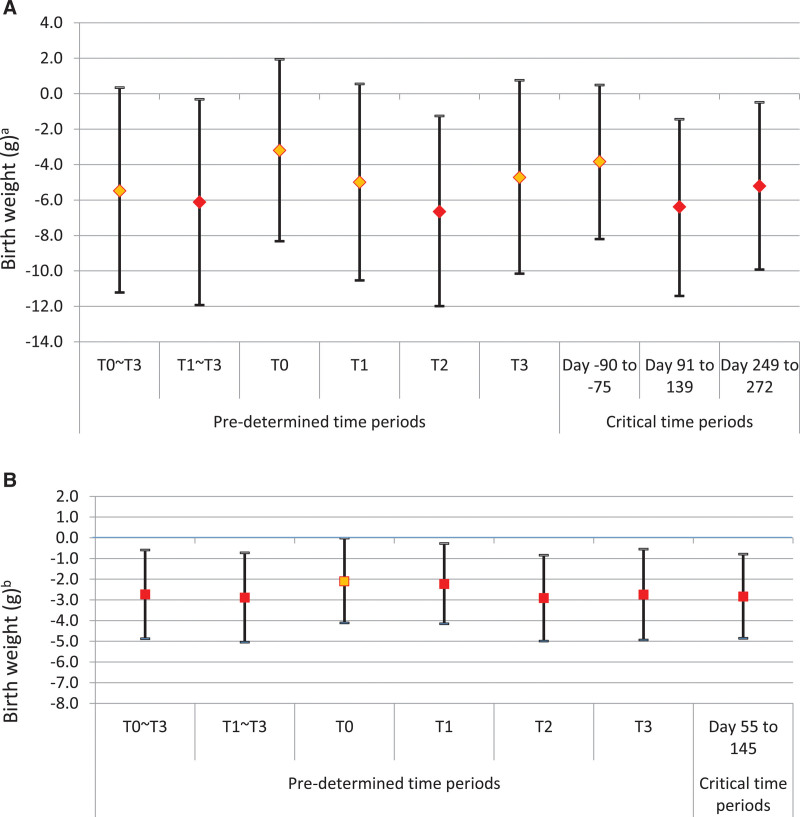
FIGURE 3.
A, Associations between PM2.5 and birth weight with 95% credible intervals (per 1 µg/m3 PM2.5): six fixed time intervals (left) and three critical time intervals identified by random selection method (right). Pre-pregnancy (T0); trimester 1 (T1); trimester 2 (T2); trimester 3 (T3); pregnancy (T1–T3); and Pregnancy + Pre-pregnancy (T0–T3). aThe Y-axis indicates the reduced birth weight in gram per 1 unit change in PM2.5. B, Associations between NO2 and birth weight with 95% credible intervals (per 1 ppb NO2): six fixed time intervals (left) and one critical time interval identified by random selection method (right). Pre-pregnancy (T0); Trimester 1 (T1); Trimester 2 (T2); Trimester 3 (T3); Pregnancy (T1–T3); and Pregnancy + Pre-pregnancy (T0–T3). bThe Y-axis indicates the reduced birth weight in gram per 1 unit change in NO2.

