

Abstract
Background
Several available therapies for neuroendocrine tumours (NETs) have demonstrated efficacy in randomised controlled trials. However, translation of these results into improved care faces several challenges, as a direct comparison of the most pertinent therapies is incomplete.
Objectives
To evaluate the safety and efficacy of therapies for NETs, to guide clinical decision‐making, and to provide estimates of relative efficiency of the different treatment options (including placebo) and rank the treatments according to their efficiency based on a network meta‐analysis.
Search methods
We identified studies through systematic searches of the following bibliographic databases: the Cochrane Central Register of Controlled Trials (CENTRAL) in the Cochrane Library; MEDLINE (Ovid); and Embase from January 1947 to December 2020. In addition, we checked trial registries for ongoing or unpublished eligible trials and manually searched for abstracts from scientific and clinical meetings.
Selection criteria
We evaluated randomised controlled trials (RCTs) comparing two or more therapies in people with NETs (primarily gastrointestinal and pancreatic).
Data collection and analysis
Two review authors independently selected studies and extracted data to a pre‐designed data extraction form. Multi‐arm studies were included in the network meta‐analysis using the R‐package netmeta. We separately analysed two different outcomes (disease control and progression‐free survival) and two types of NET (gastrointestinal and pancreatic NET) in four network meta‐analyses. A frequentist approach was used to compare the efficacy of therapies.
Main results
We identified 55 studies in 90 records in the qualitative analysis, reporting 39 primary RCTs and 16 subgroup analyses. We included 22 RCTs, with 4299 participants, that reported disease control and/or progression‐free survival in the network meta‐analysis. Precision‐of‐treatment estimates and estimated heterogeneity were limited, although the risk of bias was predominantly low.
The network meta‐analysis of progression‐free survival found nine therapies for pancreatic NETs: everolimus (hazard ratio [HR], 0.36 [95% CI, 0.28 to 0.46]), interferon plus somatostatin analogue (HR, 0.34 [95% CI, 0.14 to 0.80]), everolimus plus somatostatin analogue (HR, 0.38 [95% CI, 0.26 to 0.57]), bevacizumab plus somatostatin analogue (HR, 0.36 [95% CI, 0.15 to 0.89]), interferon (HR, 0.41 [95% CI, 0.18 to 0.94]), sunitinib (HR, 0.42 [95% CI, 0.26 to 0.67]), everolimus plus bevacizumab plus somatostatin analogue (HR, 0.48 [95% CI, 0.28 to 0.83]), surufatinib (HR, 0.49 [95% CI, 0.32 to 0.76]), and somatostatin analogue (HR, 0.51 [95% CI, 0.34 to 0.77]); and six therapies for gastrointestinal NETs: 177‐Lu‐DOTATATE plus somatostatin analogue (HR, 0.07 [95% CI, 0.02 to 0.26]), everolimus plus somatostatin analogue (HR, 0.12 [95%CI, 0.03 to 0.54]), bevacizumab plus somatostatin analogue (HR, 0.18 [95% CI, 0.04 to 0.94]), interferon plus somatostatin analogue (HR, 0.23 [95% CI, 0.06 to 0.93]), surufatinib (HR, 0.33 [95%CI, 0.12 to 0.88]), and somatostatin analogue (HR, 0.34 [95% CI, 0.16 to 0.76]), with higher efficacy than placebo. Besides everolimus for pancreatic NETs, the results suggested an overall superiority of combination therapies, including somatostatin analogues.
The results indicate that NET therapies have a broad range of risk for adverse events and effects on quality of life, but these were reported inconsistently.
Evidence from this network meta‐analysis (and underlying RCTs) does not support any particular therapy (or combinations of therapies) with respect to patient‐centred outcomes (e.g. overall survival and quality of life).
Authors' conclusions
The findings from this study suggest that a range of efficient therapies with different safety profiles is available for people with NETs.
Plain language summary
Treatment options for neuroendocrine tumours
Review question
We reviewed the evidence on safety and efficacy of therapies for neuroendocrine tumours (NETs) in the gastrointestinal tract and the pancreas to provide a ranking of these treatment options.
Background
NETs are a varied group of rare cancers, which can occur anywhere in the body. However, most neuroendocrine tumours derive from the gastrointestinal tract or the pancreas. There are many types of NETs with different growth rates and symptoms. While some NETs produce excess hormones, others do not release hormones, or not enough to cause symptoms. The treatment options, as well as their combinations and sequencing, depend on the type of tumour, its location, aggressiveness, and whether it produces excess hormones.
Until now, no clear recommendations could be given about which NET therapies were the most effective and caused the fewest adverse events. We used statistical methods to compare all therapies with each other based on the available information.
Study characteristics
We included 22 randomised controlled trials (studies in which participants are randomly assigned to treatment groups), published before 11 December 2020, with a total of 4299 people. There were differences in tumour location (gastrointestinal and pancreatic), tumour type, sample size, treatments, and quality of the research between the studies.
Key results
This analysis suggests, in general, a superiority of combination therapies, including somatostatin‐like medications, in both gastrointestinal and pancreatic NETs. However, in pancreatic NETs, everolimus was the most effective therapy with the highest certainty of evidence compared to the other treatments. Furthermore, the results indicate that NET therapies have a broad range of risk for adverse events and effects on quality of life. Because disease is often advanced at presentation and treatment is often given with the intent to control and shrink disease, rather than be ultimately curative, treatment adverse events and quality of life are key considerations.
Quality of evidence
We rated the certainty of the evidence as high to low for the different therapies. An overall ranking of the treatments (and combinations) was not possible. In order to make an informed decision, advantages and disadvantages of each therapy, including its risks for adverse events and effects on quality of life, have to be balanced against each other. Evidence from this network meta‐analysis (and underlying RCTs) does not support any particular therapy (or combinations of therapies) with respect to patient‐centred outcomes (e.g. overall survival and quality of life).
Summary of findings
Background
Description of the condition
Neuroendocrine tumours (NETs), sometimes referred to as carcinoid tumours, are a heterogenous group of malignancies (cancers) that arise from cells of the endocrine (hormonal) and neurological systems. They have an estimated overall 20‐year limited‐duration prevalence (number of people alive on a certain day who were diagnosed with a NET within the previous 20‐year period) of 171,321 and a yearly age‐adjusted incidence of 6.98 cases per 100,000 according to the National Cancer Institute's Surveillance, Epidemiology, and End Results (SEER) 18 registry (Dasari 2017). A population‐based study found a 6.4‐fold increase in incidence between 1973 and 2012 (Dasari 2017). NETs are more common at higher age, with an incidence among people 65 years or older of 25 per 100,000. About 61.0% of NETs derive from the gastrointestinal tract or the pancreas (Lawrence 2011), and accordingly these tumours are called gastroenteropancreatic NET (GEP‐NET). Other sites for primary NET include lungs, thyroid, ovaries, cervix, pituitary, and adrenal glands (Hallet 2015).
The relative frequency and annual incidence rate per 100,000 of GEP‐NETs differ site by site and, in some cases, change over time and are different between countries and continents (Fraenkel 2014). NETs of the rectum are the most common in east Asia and the USA, while small intestinal NETs are the most common in males, and appendiceal NETs the most common in females in the UK (Fraenkel 2012; Fraenkel 2014). Racial discrepancies have been found in the US SEER registry, with small intestinal NETs being found more often in African‐Americans than in the white population (DePalo 2019).
Most GEP‐NETs are sporadic, but approximately 5% arise in the context of cancer predisposition syndromes (Clift 2020). Neuroendocrine tumours, especially those of the pancreas (pNET), may be associated with familial syndromes. Multiple endocrine neoplasia type 1 (MEN 1) is the most common familial syndrome associated with NET, while Von Hippel‐Lindau syndrome, neurofibromatosis type‐1 and tuberous sclerosis are rarer.
Depending on localisation and stage of the disease, they present with a broad clinical spectrum, from asymptomatic people with an incidental discovery on imaging to florid endocrinopathy. Up to 30% to 40% of GEP‐NETs may be secretory (i.e. 'functional'), releasing a variety of hormones and hormone‐like substances (Clift 2020). Serotonin‐secreting small bowel NETs may lead to cardiac valve fibrosis (carcinoid heart disease) as a consequence of hormone hyper‐secretion.
The diagnosis of GEP‐NETs is usually based on a histopathology that demonstrates neuroendocrine features, such as positive immunohistochemical staining for synaptophysin and chromogranin A. The grading of GEP‐NETs, on the other hand, is based on the mitotic index using Ki‐67 immunohistochemistry (which estimates how many cells are dividing within a tumour and how quickly it might grow). The World Health Organization (WHO) classification divides NETs according to their proliferative activity into grade 1 (Ki‐67 index ≤ 2%) and grade 2 (Ki‐67 index 3% to 20%). Based on their morphological characteristics, grade 3 tumours are subdivided into well differentiated NET and poorly differentiated neuroendocrine carcinomas, both with Ki‐67 index > 20% (Klimstra 2019). The grading aids in the prognostication of survival: the five‐year survival rates of grade 1, 2 and 3 NETs are 96%, 73% and 28%, respectively (Ramage 2012).
Description of the intervention
Tumour growth, treatment and outcome vary considerably with the location of the primary lesions, as well as with their grade, extension, and stage (Lawrence 2011; Modlin 2008; Yao 2008 (2)). A broad spectrum of therapeutic options permits staged disease management with various treatment combinations and sequencing. This approach, however, requires a highly interdisciplinary and dynamic approach, which typically involves physicians of various specialties who work in concert to manage these often‐complex cases and select a treatment strategy from an array of available options.
Management strategies depend on primary tumour, locoregional and distant metastases, differentiation, tumour‐related symptoms, syndromes and presence of carcinoid heart disease. Depending on primary tumour size and site, NETs are treated surgically whenever feasible, as this is the only potentially curative treatment (Yao 2008 (2)). In metastatic, well differentiated NETs, somatostatin analogues (SSA), and interferon alpha (IFN) as a possible second‐line therapy, are a cornerstone in the palliative setting, as effective means of improving quality of life (QoL) and delaying disease progression (Cives 2014; Clift 2020). More recently, molecularly targeted drugs like the mTOR‐inhibitor everolimus, the multi‐targeted receptor tyrosine kinase inhibitor sunitinib, and the vascular endothelial growth factor (VEGF) antibody bevacizumab have been introduced into the clinical setting following trials demonstrating efficacy in people with progressive NET (Kunz 2013; Pavel 2016; Yao 2017). The radiolabelled somatostatin receptor ligand lutetium‐177‐DOTATATE also recently demonstrated a benefit over treatment with somatostatin analogues alone in people with progressive NET (Strosberg 2017). Liver‐directed therapies further broaden the therapeutic landscape (Pavel 2016). In advanced grade 3 pNET and advanced symptomatic or progressive grade 1 or 2 pNET, systemic chemotherapy with streptozocin‐ or temozolomide‐based regimens is the first choice of treatment. In grade 3 NEC, platinum‐based chemotherapy is recommended as a first‐line therapy (Pavel 2016).
Why it is important to do this review
Several available therapies have demonstrated efficacy in terms of disease control and/or progression‐free survival in randomised controlled trials (RCTs). However, translation of these results into improved care faces several challenges, as several therapies were compared with placebo only and a direct comparison of the most pertinent therapies is incomplete (Kaderli 2019). In a previous systematic review and network meta‐analysis on pNETs and neuroendocrine tumours of the gastrointestinal tract (GI‐NETs), we found several monotherapies that were superior to placebo, including everolimus, interferon, and sunitinib in pNETs and somatostatin analogues in pNETs and GI‐NETs (Kaderli 2019). Furthermore, the results suggested a superiority of combination therapies, especially those including somatostatin analogues. On the other hand, NET therapies have a broad range of risk for adverse events and effects on QoL, which need to be considered while choosing the appropriate treatment. A systematic comparison of benefits and harms of all currently available therapeutic modalities will allow informed clinical decision‐making for clinicians, patients and policy makers.
Furthermore, there is ongoing research in the treatment of NETs. Surufatinib has demonstrated a higher progression‐free survival in GI‐NETs in the SANET‐ep trial (Xu 2020 (ep)) and in pNET in the SANET‐p trial (Xu 2020 (p)). New results for axitinib and somatostatin analogue are expected in GI‐NET (AXINET trial, NCT01744249), for everolimus and streptozocin plus fluorouracil in pNET (SEQTOR trial, NCT02246127), and for lutetium‐177 (177Lu)‐DOTATATE and everolimus both in GI‐NET and pNET (COMPETE trial, NCT03049189). It is, therefore, vital to provide a regularly updated systematic review and network meta‐analysis for clinical decision‐making based on the best available and most recent evidence.
Objectives
To evaluate the safety and efficiency of therapies for NETs, to guide clinical decision‐making, and to provide estimates of relative efficiency of the different treatment options (including placebo) and rank the treatments according to their efficiency based on a network meta‐analysis.
Methods
Criteria for considering studies for this review
Types of studies
We included randomised controlled trials (RCTs), including randomised controlled cross‐over trials.
If a post hoc subgroup analysis was available and reported disease control after 12 months and/or progression‐free survival for either pNET or GEP‐NET only, the subgroup analysis was used for the network meta‐analysis instead of the main study including more than one type of NETs.
Types of participants
People of any age with any type and any stage of GEP‐NETs.
Types of interventions
We included RCTs comparing at least two treatments of any kind (including usual care or placebo) in NETs, administered in any way.
Examples of treatments include the mechanistic target of rapamycin inhibitor everolimus (Yao 2016), the multi‐targeted receptor tyrosine kinase inhibitor sunitinib (Raymond 2011), the vascular endothelial growth factor (VEGF) antibody bevacizumab (Yao 2017), the radiolabelled somatostatin analogue lutetium‐177 (177Lu)‐dotatate (Strosberg 2017), and new combinations of previously established therapies (Pavel 2011). Several therapies were compared only with placebo, while others were directly compared.
Every individual drug or drug combination, as well as placebo, represent individual nodes in the network meta‐analysis. Due to the low number of included studies, we grouped together all different somatostatin analogues, as well as all different intervention doses, modalities, and administration frequencies.
Types of outcome measures
Primary outcomes
Disease control after 12 months
Progression‐free survival
Secondary outcomes
Overall survival
Occurrence of adverse events according to the treatment applied (grades 3 to 4, any grade)
Quality of life (QoL)
Disease control is defined as the sum of complete response, partial response and stable disease, or as the total minus the number disease progressions. Progression‐free survival is the length of time during and after the treatment, that a patient lives with the disease, but it does not grow. We used unblinded, investigator‐assessed progression‐free survival outcomes. Adverse events were classified according to the National Cancer Institute Common Terminology Criteria for Adverse Events (NCI 2010): Grade 1 corresponds to mild, grade 2 to moderate, grade 3 to severe or medically significant, and grade 4 to life‐threatening adverse events. Effects on QoL were quantified based on the QoL Questionnaire C30 of the European Organization for Research and Treatment of Cancer (EORTC QLQ‐30) (Aaronson 1993).
Search methods for identification of studies
Electronic searches
We identified trials through systematic searches of the following bibliographic databases on 11 December 2020:
Cochrane Central Register of Controlled Trials (CENTRAL; 2020, Issue 12) in the Cochrane Library;
MEDLINE via Ovid (January 1947 to 11 December 2020);
Embase.com (January 1947 to 11 December 2020).
In addition, we checked trial registries (ClinicalTrials.gov and the World Health Organization International Clinical Trials Registry Platform Search Portal [apps.who.int/trialsearch/]) for ongoing or unpublished eligible trials and manually searched for abstracts from scientific and clinical meetings related to NETs in 2019 and 2020 (annual ENETS conference and neuroendocrine tumour symposium of the NANETS).
We searched all databases from 1 January 1947, until present, and imposed no restriction on language of publication (Appendix 1; Appendix 2; Appendix 3).
Searching other resources
We scanned the reference lists of the included RCT reports and relevant review articles for additional references.
Data collection and analysis
Selection of studies
With two review authors working in duplicate, we independently screened all abstracts and obtained the full‐text report of potentially relevant studies. Subsequently, we screened all potentially relevant studies in the same way. Any discordance was resolved by a third review author.
Data extraction and management
We used a data collection form for study characteristics and outcome data which has been piloted in our previous systematic review and network meta‐analysis on therapeutic options for neuroendocrine tumours (Kaderli 2019). One of the review authors extracted study characteristics from included studies, and a second review author verified the extractions. We extracted the following study characteristics.
Characteristics of included trials: first author, year of publication, study origin, type of treatments, median duration and median follow‐up of each treatment, percentage of people with complete follow‐up, availability of a sample size calculation, and number of participants randomised for each treatment.
Participant data: separately for each treatment: primary tumour site, tumour grading, presence of metastases and functional tumours, percentage of female participants and the participants' median/mean age; main primary tumour (pNET and/or GI‐NET) for all treatments.
Clinical outcomes: complete response, partial response, stable disease, disease control, disease progression, investigator‐assessed progression‐free survival, median overall survival, occurrence of adverse events (grade 3 to 4, any grade), and QoL.
Any discordance was resolved by a third review author. Data were entered into Review Manager software (RevMan 2014) and checked by a second review author for accuracy.
Due to the well‐defined patient characteristics, we did not expect significant effect modifiers and, due to the low number of included studies, we could not systematically analyse effect modifiers.
Assessment of risk of bias in included studies
Two review authors independently assessed the risk of bias for each RCT, using the Cochrane risk of bias tool (Higgins 2011), which utilises the following domains.
Random sequence generation
Allocation concealment
Blinding of participants and personnel
Blinding of outcome assessment
Completeness of outcome data
Selectivity of reporting
Other bias (including baseline imbalance, protocol deviations, inappropriate influence of funders)
We provided a summary risk of bias assessment for each study using the method outlined in the Cochrane Handbook for Systematic Reviews of Interventions (Higgins 2011). Each domain was rated as low (bias is unlikely to seriously alter the results), high (bias is likely to seriously weaken confidence in results), or unclear risk of bias. All discordance was resolved by a third review author.
Measures of treatment effect
We used odds ratios as effect measures for disease control after 12 months and hazard ratios as effect measures for progression‐free survival, both accompanied by 95% confidence intervals (95% CIs). We applied a continuity correction for studies with a zero cell count by adding 0.5 to all cell frequencies. We summarised all results using forest plots with combined effect estimates and size of squares proportional to the inverse of the standard errors. Due to the low number of included studies and the heterogeneity of secondary outcomes, we presented these outcomes for each intervention (if available) using descriptive statistics — i.e. number and percentage of adverse events, and mean and standard deviation of the change of QoL.
We ranked treatments based on P scores, measuring the extent of certainty that a treatment is better than another one, averaged over all competing treatments (Rücker 2015).
Unit of analysis issues
The analysis was made at the individual allocation level.
Multi‐arm trials were included in the network meta‐analysis. The correlation of treatment effects on different comparisons was accounted for by re‐weighting all comparisons of each multi‐arm study (Rücker 2012; Rücker 2014).
We included cross‐over trials in the qualitative analysis. However, they were excluded from the network meta‐analysis due to the inappropriateness of the study design: including only the first intervention period of a cross‐over trial discards more than half of the information in the study.
Dealing with missing data
We contacted authors of included RCT reports for information on unreported outcomes and missing outcome data in their studies.
If a RCT report did not report hazard ratios and further data could not be obtained by contacting authors, we estimated the hazard ratios from reconstructed Kaplan‐Meier curves (if available) by using a Cox proportional hazard model.
Assessment of heterogeneity
We assessed heterogeneity using all pairwise comparisons available from more than one trial. We calculated the between‐study variance Ƭ2, the within‐design component of Cochran's Q (i.e. the weighted sum of squared differences between pairwise comparisons from multiple trials) and the associated I2 (percentage of variation across studies due to heterogeneity rather than chance). If quantification of heterogeneity was not possible (i.e. if there was no comparison done in more than one trial), we fitted fixed‐effect models; otherwise, we used random‐effects models.
We assessed homogeneity and transitivity based on the distribution of neuroendocrine tumour types, and the differences in doses and application route, especially for somatostatin analogues.
We assessed inconsistency using closed loops within the network (if any) and calculated the between‐design component of Cochran's Q and the associated I2. In addition, we performed a netsplit analysis and compared direct and indirect estimates via a ratio of odds or hazard ratios.
We calculated the total Cochran's Q as the sum of between‐ and within‐designs component and the associated I2.
Assessment of reporting biases
To assess the risk for reporting bias, we first searched for a protocol for each of the included studies. For this, we went through the reference lists of corresponding published articles. If there was no reference to a protocol, we searched PubMed, Embase, and the internet for a protocol. If a protocol was available, we compared the mentioned outcomes and planned statistical analyses in the protocol with those in the published report. If no protocol was available, we used information from a corresponding registry entry of the included study to compare planned outcomes and analyses with those in the published report. If neither a protocol, nor a registry entry was available, we compared the outcomes and described analyses in the methods section of the published report with those reported in the results section. Any unexplained differences between the protocol, registry entry, or methods section and the reported results provided evidence for an increased risk of reporting bias of an included study.
If there were 10 or more included studies for individual pairwise meta‐analyses, we created funnel plots for visual inspection to detect potential asymmetry.
Data synthesis
We separately analysed two different outcomes (disease control and progression‐free survival) and two types of NET (pNET and GI‐NET) in four network meta‐analyses. The NET types were distinguished to ensure that the selected studies were similar except for the interventions being compared. If a study included several NET types, we included the respective subgroup analyses (if available): for pNET, one subgroup analysis was included for the analysis of progression‐free survival (Phan 2015 (2) instead of Caplin 2014) and, for GI‐NET, one subgroup analysis was included for the analysis of disease control and progression‐free survival (Castellano 2013 instead of Pavel 2011) and two subgroup analyses were included for the analysis of progression‐free survival (Dasari 2015 instead of Caplin 2014 and Singh 2018 (1) instead of Yao 2016). Otherwise, we relied on expert opinion whether or not to include the study and used sensitivity analyses to assess the effect of the decision.
Before including an intervention in the network meta‐analysis, we assessed the respective study populations critically in terms of the transitivity assumption. Interventions only given to a subset of participants (i.e. those critically ill) were not included in a sensitivity analysis. However, since the network is currently very sparse, the benefit of additional studies might outweigh a certain risk of violation of the transitivity assumption. The comparison among all interventions (including placebo) were of interest and we would not define a decision and a supplementary set. However, if more data become available, we might focus on a specific set of interventions.
Because the network is sparse, we merged similar interventions, i.e. different doses, administration intervals and routes of application of the same compound. When more data become available, we will consider splitting nodes if the effects are suspected to be different.
We performed the network meta‐analyses with a frequentist approach using R‐package (R Core 2019) netmeta (Rücker 2021). If quantification of heterogeneity was possible, i.e. if there were pairwise comparisons included in more than one trial, we used random‐effects models. Otherwise, we used fixed‐effect models. Validity of the network in terms of consistency was assessed quantitatively by comparing direct and indirect estimates for each loop of the network and qualitatively using GRADE (as described in section Assessment of heterogeneity).
Subgroup analysis and investigation of heterogeneity
In view of the small number of RCTs included in this review, we refrained from any subgroup analysis, including subgroup analysis based on tumour grading, since the separate analysis for each treatment included in a RCT was frequently missing.
If there was evidence for heterogeneity, we assessed participant and trial characteristics for a potential source of the heterogeneity.
Sensitivity analysis
Currently, the network is very sparse and we were not able to undertake sensitivity analyses. If sufficient trials would have been identified, we would have considered several sensitivity analyses for the primary outcomes. We would, for example, only use low risk of bias trials (trials without a high risk for selection, performance, detection, attrition, reporting or other biases), exclude trials with a mixture of different types of NETs and use alternative or no merging of nodes. We would have also considered different analytical approaches, such as fixed‐effect only, or a Bayesian instead of the specified frequentist approach (e.g. using R package BUGSnet (Béliveau 2019)).
Summary of findings and assessment of the certainty of the evidence
We used the GRADE approach to assess confidence in estimates of effect (certainty of evidence) associated with specific comparisons, including estimates from direct, indirect, and final network meta‐analysis (Brignardello‐Petersen 2018; Puhan 2014; Salanti 2014). Our confidence assessment addressed risk of bias (limitations in study design and execution), inconsistency (heterogeneity of estimates of effects across trials), indirectness (differences in population, interventions, or outcomes to the target of the network meta‐analysis) and imprecision (e.g. wide 95% confidence intervals including or close to the null effect). Limitations in any of these domains resulted in a decrease of the certainty of evidence from high to moderate, low, or very low‐certainty by ‐1 (serious concern) or ‐2 (very serious concern). We based indirect evidence on the most dominant loops (i.e. the shortest path between two treatments) and potentially rated it down for intransitivity (differences in study characteristics that may modify treatment effect in the direct comparisons along the path). We obtained the final network meta‐analysis confidence rating from the higher of the direct and indirect rating excluding imprecision and we rated it down for imprecision and incoherence (difference between direct and indirect estimates).
All studies and study arms used for the network meta‐analyses had included adult people with advanced GEP‐NET that were in need of and eligible for systematic therapies, supporting the transitivity assumption of the network meta‐analyses.
In the summary of findings tables, we included estimates of effects, ranking and certainty of evidence for different treatment options compared with placebo for disease control and progression‐free survival in pNET and GI‐NET.
Results
Description of studies
See: Characteristics of included studies and Characteristics of excluded studies.
Results of the search
In our previous systematic review and network meta‐analysis on pNETs and GI‐NETs with the same search methods, we included 38 studies in the qualitative synthesis (30 primary studies and 8 subgroup analyses) (Kaderli 2019). The previously published searches on 27 November 2015 and 2 March 2018 led to the identification of 7243 records (Kaderli 2019). Following de‐duplication across the databases, the combined total yield of the updated search on 11 December 2020 was 1058 records:
CENTRAL: 255 records
MEDLINE (Ovid): 546 records
Embase: 257 records
Two additional records were added through scanning the reference lists of included RCT reports. After reading the abstracts, we excluded 991 records because they did not match the inclusion criteria. After assessing the full text, we excluded 23 records. In all, we included 55 studies in the qualitative analysis (39 primary RCTs and 16 subgroup analyses). A total of 22 studies reported disease control and/or progression‐free survival and were included in the network meta‐analyses (see Figure 1).
1.
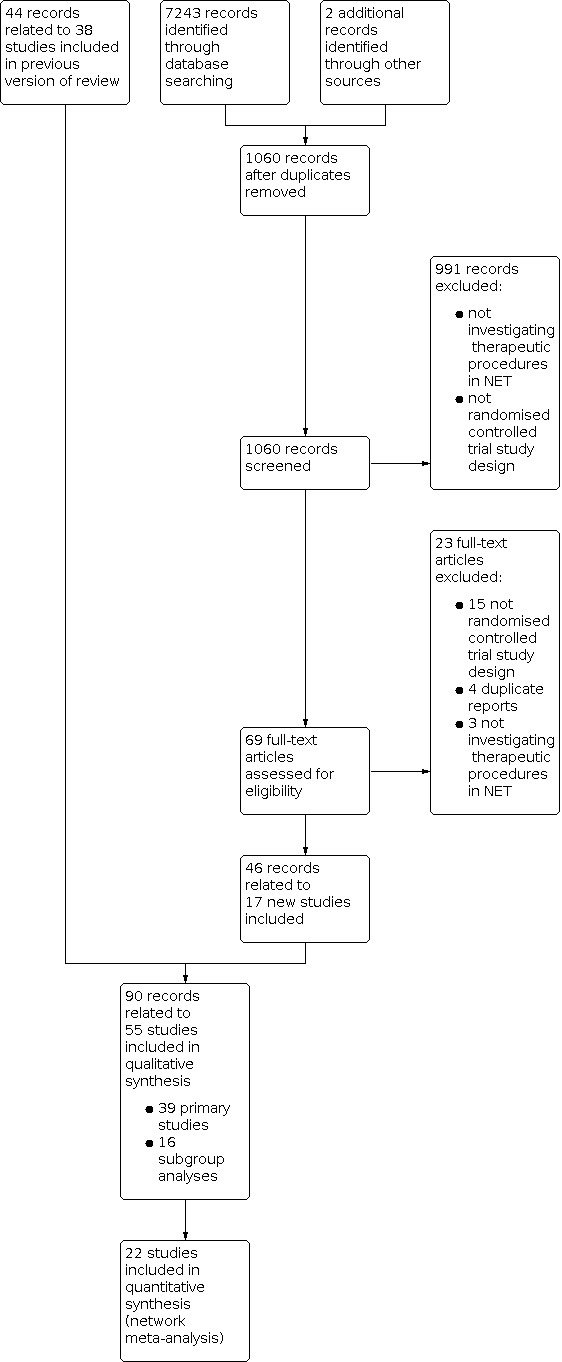
Study flow diagram.
Included studies
We included 55 studies in 90 records in the qualitative analysis, reporting 39 primary RCTs (Arnold 2005; Bergsland 2020; Caplin 2014; Elf 2018; Faiss 2003; Jacobsen 1995; Kölby 2003; Kulke 2016; Kulke 2017 (1); Kulke 2017 (2); Lange 1992; Lepage 2020; Liu 2020; Maire 2012; Meyer 2014; Moertel 1980; Moertel 1992; O'Toole 2000; Öberg 1989; Pavel 2011; Pavel 2018 (1); Pavlakis 2020; Raymond 2011 (1); Rinke 2009; Sakata 2006; Salazar 2018; Saslow 1998; Soulen 2020; Strosberg 2017; Van Der Zwan 2018; Vinik 2016; Wolin 2015; Xu 2020 (ep); Xu 2020 (p); Yao 2008 (1); Yao 2011; Yao 2016; Yao 2017; Zhang 2020) and 16 subgroup analyses (Anthony 2012; Castellano 2013; Dasari 2015; Di Gialleonardo 2020; Fisher 2016; Ito 2012; Lombard‐Bohas 2015; Phan 2015 (1); Phan 2015 (2); Pusceddu 2018; Raymond 2011 (2); Singh 2018 (1); Strosberg 2011; Strosberg 2020; Wolin 2016; Yao 2019) (see Characteristics of included studies for details. Overall, 4654 patients were recruited and 26 different therapies were evaluated, including biotherapies, chemotherapies, targeted drugs, locoregional therapies, surgical treatment, and targeted radiopeptide therapy.
A total of 22 RCTs, which included 4299 patients, reported disease control and/or progression‐free survival and were included in the network meta‐analysis (Arnold 2005; Caplin 2014; Castellano 2013; Dasari 2015; Faiss 2003; Kölby 2003; Kulke 2016; Kulke 2017 (1); Öberg 1989; Pavel 2011; Phan 2015 (2); Raymond 2011 (1); Rinke 2009; Salazar 2018; Singh 2018 (1); Strosberg 2017; Xu 2020 (ep); Xu 2020 (p); Yao 2008 (1); Yao 2011; Yao 2016; Yao 2017).
Eighteen of 22 RCTs included in the network meta‐analysis were industry‐sponsored (Arnold 2005; Caplin 2014; Castellano 2013; Dasari 2015; Faiss 2003; Kulke 2017 (1); Pavel 2011; Phan 2015 (2); Raymond 2011 (1); Rinke 2009; Salazar 2018; Singh 2018 (1); Strosberg 2017; Xu 2020 (ep); Xu 2020 (p); Yao 2008 (1); Yao 2011; Yao 2016).
Excluded studies
During the first phase of record selection, we screened and excluded 991 records, which were not investigating therapeutic procedures in NET or did not fulfil the criteria of an RCT. Twenty‐three of the remaining 69 records were excluded after assessing the full‐text articles. They did not fulfil the criteria of an RCT, were duplicate reports or were not investigating therapeutic procedures in NET (see Characteristics of excluded studies for details).
Risk of bias in included studies
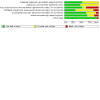
Summaries of the risk of bias for each domain and as percentages across all studies are presented in Figure 2 and Figure 3.
2.
3.
Allocation
Random sequence generation
Twenty‐nine studies described a random component in the sequence generation process and were at low risk of selection bias. The other 26 studies had a randomised controlled trial study design; but in 25 studies there was no further report on the sequence generation process and in one study the randomisation was performed by the study drug supplier (Jacobsen 1995). For these studies, we judged the risk of selection bias as unclear.
Allocation concealment
Twenty‐five studies reported on the method to conceal allocation and were at low risk of selection bias. Twenty‐eight studies provided no further information addressing allocation concealment and were considered to be at unclear risk of selection bias. Two studies without information on allocation concealment and identical numbers of people in all treatment groups were considered to be at unclear risk of selection bias (Kulke 2017 (2); Yao 2008 (1)).
Blinding
Blinding of participants and personnel (performance bias)
Twenty‐nine studies were double‐blinded and were at low risk of performance bias. Six studies (Kulke 2017 (1); Pavlakis 2020; Strosberg 2017; Strosberg 2020; Yao 2017; Zhang 2020) were designed as open‐label studies and in 14 studies participants and/or personnel were not blinded. They were considered to be at high risk of performance bias. Six studies provided no information and were at unclear risk of performance bias.
Blinding of outcome assessment (detection bias)
Eighteen studies reported blinding of outcome assessors and were at low risk of detection bias. Of the remaining studies, 29 studies were at unclear risk of detection bias due to missing information on the blinding of outcome assessment and eight studies were at high risk of detection bias due to a lack of evidence for a blinding of the outcome assessment.
Incomplete outcome data
Thirty‐five studies were at low risk and 16 studies were at unclear risk of attrition bias due to missing information. In three studies, a significant number of people were excluded after randomisation (Moertel 1992; O'Toole 2000; Zhang 2020) and in one study (Öberg 1989) a group cross‐over was performed without additional information, whether intention‐to‐treat or analysis per‐protocol was performed. These four studies were considered to be at high risk of attrition bias.
Selective reporting
Thirty‐two studies published a study protocol or reported all results of the endpoints stated in the methods section and were at low risk of reporting bias. Sixteen studies provided little information on primary or secondary endpoints and their definition and were judged to be at low or unclear risk for reporting bias, depending on a study‐level judgement. In seven studies, not all stated endpoints were reported (Meyer 2014; Moertel 1980; Singh 2018 (1); Strosberg 2017; Strosberg 2020; Yao 2016; Yao 2019). Hence, we judged the risk of reporting bias for these studies as high.
Other potential sources of bias
Two studies were at high risk for other potential sources of bias due to the use of investigator‐dependent measurement methods (Moertel 1980; Moertel 1992).
Effects of interventions
See: Table 1; Table 2; Table 3; Table 4
Summary of findings 1. Estimates of effects, ranking, and certainty of evidence for different treatment options compared with placebo for disease control in pancreatic neuroendocrine tumours (pNET).
|
Total studies: 9 Total participants: 1757 |
Included trials | Median follow‐up (months)1 | Relative effect (95% CI) | Anticipated absolute effects2 | Certainty of evidence3 | P‐score4 | |
| Disease control with intervention | Disease control without intervention | ||||||
|
Everolimus (3 RCTs; 632 participants) |
Kulke 2017 (1); Salazar 2018; Yao 2011 | 17 |
OR 3.29 (2.21 to 4.90) |
80% | 55% | Moderate* | 0.83 |
|
Everolimus + SSA (2 RCTs; 589 participants) |
Kulke 2017 (1); Pavel 2011 | not reported |
OR 2.89 (1.61 to 5.19) |
84% | 65% | Moderate‡ | 0.73 |
|
Interferon + SSA (2 RCTs; 171 participants) |
Arnold 2005; Faiss 2003 | not reported |
OR 2.88 (1.16 to 7.13) |
27% | 11% | Very low*,‡,¶ | 0.71 |
|
Interferon (1 RCT; 66 participants) |
Faiss 2003 | not reported |
OR 2.58 (0.75 to 8.81) |
35% | 17% | Very low**,‡,§§ | 0.63 |
|
SSA (4 RCTs, 804 participants) |
Arnold 2005; Caplin 2014; Faiss 2003; Pavel 2011 | not reported |
OR 2.36 (1.43 to 3.88) |
67% | 47% | Moderate‡ | 0.56 |
|
Surufatinib (1 RCT; 172 participants) |
Xu 2020 (p) | 19 |
OR 1.99 (1.02 to 3.88) |
74% | 59% | High | 0.48 |
|
Sunitinib (1 RCT; 171 participants) |
Raymond 2011 (1) | 60 |
OR 1.72 (0.91 to 3.27) |
72% | 60% | Low*,§ | 0.39 |
|
Placebo (4 RCTs; 957 participants) |
Caplin 2014; Raymond 2011 (1); Xu 2020 (p); Yao 2011 | 27 | Reference comparator | 53% | ‐ | Reference | 0.12 |
|
Dactolisib (1 RCT; 62 participants) |
Salazar 2018 | not reported |
OR 0.56 (0.13 to 2.37) |
61% | 74% | Very low*,§§ | 0.06 |
Population: Patients with pNET
Interventions: Everolimus, everolimus + SSA, interferon + SSA, interferon, SSA, surufatinib, sunitinib, dactolisib
Comparator (reference): Placebo
Outcome: Disease control after 12 months
Abbreviation: OR, odds ratio; CI: confidence interval; SSA, somatostatin analogues
1Weighted average of trials reporting the median follow‐up time
2Absolute effects with the intervention were calculated as weighted average over all treatment arms with the intervention. Absolute effects without the intervention were derived using the odds ratio from the network meta‐analysis.
3Using the Grading of Recommendations Assessment, Development and Evaluation (GRADE) approach
Downgraded for *risk of bias, †inconsistency, ‡indirectness, §imprecision, ¶intransitivity or #incoherence. Severe limitations are indicated by two symbols.
4The P‐score measures the probability that a treatment is better than another treatment, averaged over all competing treatments.
Summary of findings 2. Estimates of effects, ranking, and certainty of evidence for different treatment options compared with placebo for progression‐free survival in pancreatic neuroendocrine tumours (pNET).
|
Total studies: 10 Total participants: 2113 |
Included trials | Median follow‐up (months)1 | Relative effect (95% CI) | Anticipated absolute effect2 | Certainty of evidence3 | P‐score4 | |
| Median PFS with intervention (months) | Median PFS without intervention (months) | ||||||
|
Everolimus (3 RCT; 632 participants) |
Kulke 2017 (1); Salazar 2018; Yao 2011 | 17 |
HR 0.36 (0.28 to 0.46) |
12 | 4 | Moderate* | 0.75 |
|
Interferon + SSA (2 RCTs; 468 participants) |
Faiss 2003; Yao 2017 | not reported |
HR 0.34 (0.14 to 0.80) |
15 | 5 | Very low**,‡ | 0.74 |
|
Everolimus + SSA (3 RCTs; 739 participants) |
Kulke 2016; Kulke 2017 (1); Pavel 2011 | not reported |
HR 0.38 (0.26 to 0.57) |
16 | 6 | Low‡ | 0.68 |
|
Bevacizumab + SSA (1 RCT; 402 participants) |
Yao 2017 | not reported |
HR 0.36 (0.15 to 0.89) |
17 | 6 | Very low**,‡,¶ | 0.65 |
|
Interferon (1 RCT; 66 participants) |
Faiss 2003 | not reported |
HR 0.41 (0.18 to 0.94) |
not reported | ‐ | Very low**,‡ | 0.58 |
|
Sunitinib (1 RCT; 171 participants) |
Raymond 2011 (1) | 60 |
HR 0.42 (0.26 to 0.67) |
11 | 5 | Moderate* | 0.56 |
|
Everolimus + bevacizumab + SSA (1 RCT; 150 participants) |
Kulke 2016 | not reported |
HR 0.48 (0.28 to 0.83) |
17 | 8 | Very low**,¶ | 0.42 |
|
Surufatinib (1 RCT; 172 participants) |
Xu 2020 (p) | 19 |
HR 0.49 (0.32 to 0.76) |
11 | 5 | High | 0.41 |
|
Dactolisib (1 RCT; 62 participants) |
Salazar 2018 | not reported |
HR 0.55 (0.25 to 1.21) |
8 | 4 | Low*,§ | 0.35 |
|
SSA (3 RCTs; 586 participants) |
Faiss 2003; Pavel 2011; Phan 2015 (2) | not reported |
HR 0.51 (0.34 to 0.77) |
11 | 6 | Moderate | 0.33 |
|
Placebo (4 RCTs; 844 participants) |
Phan 2015 (2); Raymond 2011 (1); Xu 2020 (p); Yao 2011 | 27 | Reference comparator | 6 | ‐ | Reference | 0.01 |
Population: Patients with pNET
Interventions: Bevacizumab + SSA, dactolisib, everolimus, everolimus + SSA, everolimus + bevacizumab + SSA, interferon, interferon + SSA, sunitinib, surufatinib, SSA
Comparator (reference): Placebo
Outcome: Progression‐free survival
Abbreviation: HR, hazard ratio; PFS, progression‐free survival; CI, confidence interval; SSA, somatostatin analogues.
1Weighted average of trials reporting the median follow‐up time
2Absolute effects with the intervention were calculated as weighted average over all treatment arms with the intervention. Absolute effects without the intervention were derived using the hazard ratio from the network meta‐analysis assuming an exponential distribution.
3Using the Grading of Recommendations Assessment, Development and Evaluation (GRADE) approach
Downgraded for *risk of bias, †inconsistency, ‡indirectness, §imprecision, ¶intransitivity or #incoherence. Severe limitations are indicated by two symbols.
4The P‐score measures the probability that a treatment is better than another treatment, averaged over all competing treatments.
Summary of findings 3. Estimates of effects, ranking, and certainty of evidence for different treatment options compared with placebo for disease control in gastrointestinal neuroendocrine tumours (GI‐NET).
|
Total studies: 11 Total participants: 1338 |
Included trials | Median follow‐up (months)1 | Relative effect (95% CI) | Anticipated absolute effects2 | Certainty of evidence3 | P‐score4 | |
| Disease control with intervention | Disease control without intervention | ||||||
|
Bevacizumab + SSA (1 RCT; 44 participants) |
Yao 2008 (1) | not reported |
OR 45.0 (3.32 to 609) |
95% | 32% | Very low*,††,‡,¶¶,§ | 0.91 |
|
177‐Lu‐DOTATATE + SSA (1 RCT; 229 participants) |
Strosberg 2017 | 14 |
OR 30.4 (8.19 to 113) |
80% | 12% | Very low**,¶,§ | 0.90 |
|
Everolimus + SSA (1 RCT; 39 participants) |
Castellano 2013 | not reported |
OR 15.1 (2.55 to 88.9) |
63% | 10% | Very low‡,¶,§ | 0.78 |
|
Interferon + SSA (4 RCTs; 283 participants) |
Arnold 2005; Faiss 2003; Kölby 2003; Yao 2008 (1) | 76 |
OR 5.71 (1.90 to 17.2) |
48% | 14% | Very low*,††,‡,¶ | 0.60 |
|
Interferon (2 RCTs; 86 participants) |
Faiss 2003; Öberg 1989 | 7 |
OR 4.03 (0.86 to 18.8) |
55% | 23% | Very low**,‡,¶,§§ | 0.48 |
|
Surufatinib (1 RCT; 198 participants) |
Xu 2020 (ep) | 14 |
OR 3.50 (1.21 to 10.1) |
84% | 61% | Moderate‡ | 0.45 |
|
SSA (7 RCTs; 796 participants) |
Arnold 2005; Caplin 2014; Castellano 2013; Faiss 2003; Kölby 2003; Rinke 2009; Strosberg 2017 | 87 |
OR 2.93 (1.36 to 6.32) |
43% | 21% | Moderate‡ | 0.37 |
|
Everolimus (1 RCT; 302 participants) |
Yao 2016 | 21 |
OR 2.53 (0.95 to 6.79) |
82% | 65% | Very low*,‡,§ | 0.35 |
|
Placebo (4 RCT; 789 participants) |
Caplin 2014; Rinke 2009; Xu 2020 (ep); Yao 2016 | 35 | Reference comparator | 53% | ‐ | Reference | 0.11 |
|
Streptozocin + 5‐FU (1 RCT; 20 participants) |
Öberg 1989 | 12 |
OR 0.13 (0.00 to 4.58) |
40% | 83% | Very low**,‡,¶,§§ | 0.04 |
Population: Patients with GI‐NET
Interventions: 177‐Lu‐DOTATATE + SSA, bevacizumab + SSA, everolimus, everolimus + SSA, interferon, interferon + SSA, SSA, streptozocin + 5‐FU, surufatinib
Comparator (reference): Placebo
Outcome: Disease control after 12 months
Abbreviation: OR, odds ratio; CI: confidence interval; SSA, somatostatin analogues
1Weighted average of trials reporting the median follow‐up time
2Absolute effects with the intervention were calculated as weighted average over all treatment arms with the intervention. Absolute effects without the intervention were derived using the odds ratio from the network meta‐analysis.
3Using the Grading of Recommendations Assessment, Development and Evaluation (GRADE) approach
Downgraded for *risk of bias, †inconsistency, ‡indirectness, §imprecision, ¶intransitivity or #incoherence. Severe limitations are indicated by two symbols.
4The P‐score measures the probability that a treatment is better than another treatment, averaged over all competing treatments.
Summary of findings 4. Estimates of effects, ranking, and certainty of evidence for different treatment options compared with placebo for progression‐free survival in gastrointestinal neuroendocrine tumours (GI‐NET).
|
Total studies: 9 Total participants: 1311 |
Included trials | Median follow‐up (months)1 | Relative effect (95% CI) | Anticipated absolute effect2 | Certainty of evidence3 | P‐score4 | |
| Median PFS with intervention (months) | Median PFS without intervention (months) | ||||||
|
177‐Lu‐DOTATATE + SSA (1 RCT; 229 participants) |
Strosberg 2017 | 14 |
HR 0.07 (0.02 to 0.26) |
not reported | ‐ | Very low**,¶,§ | 0.93 |
|
Everolimus + SSA (1 RCT; 39 participants) |
Castellano 2013 | not reported |
HR 0.12 (0.03 to 0.54) |
30 | 3 | Very low‡,¶,§ | 0.79 |
|
Bevacizumab + SSA (2 RCTs; 446 participants) |
Yao 2008 (1); Yao 2017 | not reported |
HR 0.18 (0.04 to 0.94) |
16 | 3 | Very low**,‡,¶¶,§ | 0.66 |
|
Interferon + SSA (3 RCTs; 512 participants) |
Faiss 2003; Yao 2008 (1); Yao 2017 | not reported |
HR 0.23 (0.06 to 0.93) |
15 | 3 | Very low**,‡,¶,§ | 0.56 |
|
Interferon (1 RCT; 66 participants) |
Faiss 2003 | not reported |
HR 0.27 (0.07 to 1.10) |
not reported | ‐ | Very low**,‡,¶,§§ | 0.49 |
|
Surufatinib (1 RCT; 198 participants) |
Xu 2020 (ep) | 14 |
HR 0.33 (0.12 to 0.88) |
9 | 3 | Moderate‡ | 0.43 |
|
SSA (5 RCTs; 492 participants) |
Castellano 2013; Dasari 2015; Faiss 2003; Rinke 2009; Strosberg 2017 | 96 |
HR 0.34 (0.16 to 0.76) |
10 | 3 | High | 0.39 |
|
Everolimus (1 RCT; 175 participants) |
Singh 2018 (1) | 21 |
HR 0.56 (0.21 to 1.49) |
13 | 7 | Low*,§ | 0.23 |
|
Placebo (4 RCTs; 531 participants) |
Dasari 2015; Rinke 2009; Singh 2018 (1); Xu 2020 (ep) | 38 | Reference comparator | 8 | ‐ | Reference | 0.03 |
Population: Patients with GI‐NET
Interventions: 177‐Lu‐DOTATATE + SSA, bevacizumab + SSA, everolimus, everolimus + SSA, interferon, interferon + SSA, SSA, surufatinib
Comparator (reference): Placebo
Outcome: Progression‐free survival
Abbreviation: HR, hazard ratio; CI: confidence interval; SSA, somatostatin analogues
1Weighted average of trials reporting the median follow‐up time
2Absolute effects with the intervention were calculated as weighted average over all treatment arms with the intervention. Absolute effects without the intervention were derived using the hazard ratio from the network meta‐analysis assuming an exponential distribution.
3Using the Grading of Recommendations Assessment, Development and Evaluation (GRADE) approach
Downgraded for *risk of bias, †inconsistency, ‡indirectness, §imprecision, ¶intransitivity or #incoherence. Severe limitations are indicated by two symbols.
4The P‐score measures the probability that a treatment is better than another treatment, averaged over all competing treatments.
Treatment efficacy in pNETs
Nine RCTs (Arnold 2005; Caplin 2014; Faiss 2003; Kulke 2017 (1); Pavel 2011; Raymond 2011 (1); Salazar 2018; Xu 2020 (p); Yao 2011) compared disease control rates for nine different therapies in pNETs (Figure 4). The network meta‐analysis found that single therapy with everolimus and combination therapies with a somatostatin analogue were highly effective. Specifically, everolimus (P score, 0.83), everolimus plus a somatostatin analogue (P score, 0.73), and interferon plus a somatostatin analogue (P score, 0.71) achieved the highest disease control rates, followed by single treatment with interferon (P score, 0.63), somatostatin analogues (P score, 0.56), surufatinib (P score, 0.48), sunitinib (P score, 0.39), placebo (P score, 0.12), and dactolisib (P score, 0.06). All therapies except interferon, sunitinib, and dactolisib showed significantly higher disease control rates than placebo (Figure 4, Table 5).
4.
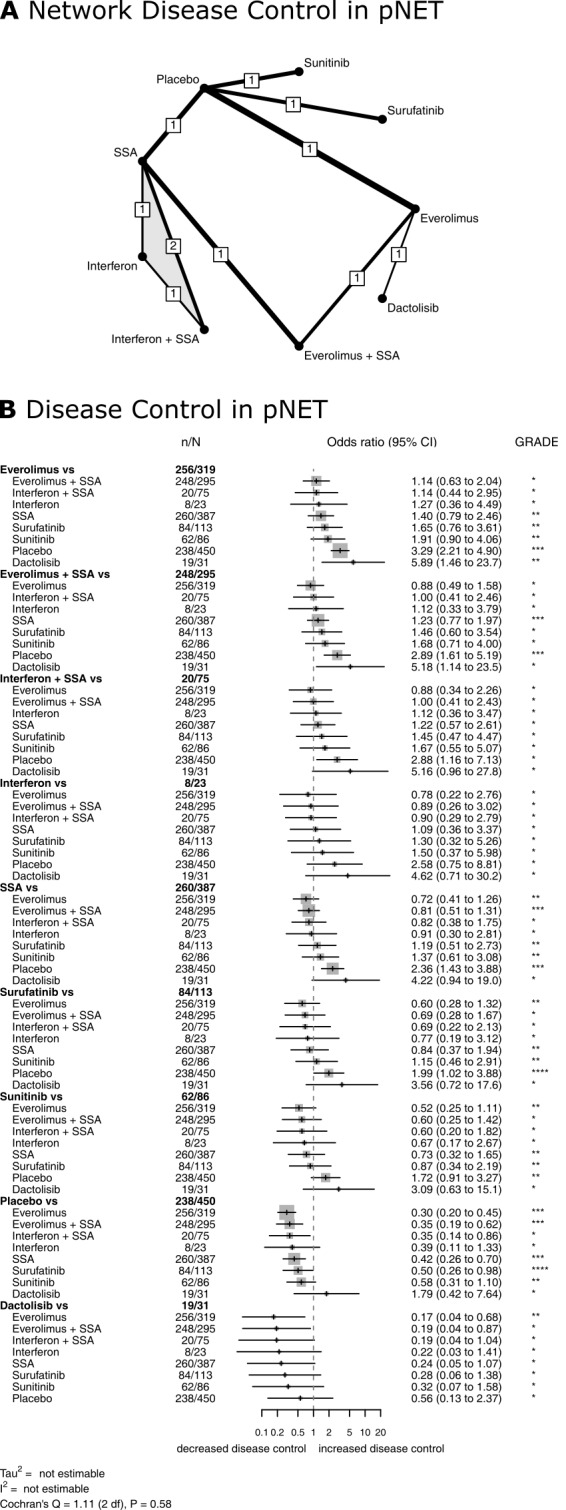
Treatment efficacy in pNET. Network plot (A) and Forest plot (B) for disease control in pNET. The thickness of the edges in the network plots is proportional to the inverse standard errors of the pairwise comparisons, and the numbers indicate the number of studies. One three‐arm study is marked by shading. Each section in the Forest plots refers to one treatment (in bold) compared to all others. An odds ratio larger than one indicates increased disease control of the bold treatment. A hazard ratio smaller than one indicates a reduced risk for progression for the bold treatment. All therapies are listed in order of their P‐scores, with the most effective therapy on top. Heterogeneity was assessed by the between‐study variance tau2, Cochran's Q with a P value, and I2. N refers to the total number of patients, and n to the number of patients with disease control. The Grading of Recommendations Assessment, Development and Evaluation (GRADE) approach was used to rate the quality of evidence of estimates from pairwise and network meta‐analysis. The final network meta‐analysis GRADE evidence quality corresponds to *very low, **low, ***moderate, and ****high. SSA refers to somatostatin analogues.
1. Comparison of all treatment options from the network meta‐analysis of disease control in pancreatic neuroendocrine tumours (pNET).
| Dactolisib | 0.17 (0.04 to 0.68) | 0.19 (0.04 to 0.87) | 0.22 (0.03 to 1.41) | 0.19 (0.04 to 1.04) | 0.56 (0.13 to 2.37) | 0.24 (0.05 to 1.07) | 0.32 (0.07 to 1.58) | 0.28 (0.06 to 1.38) |
| 5.89 (1.46 to 23.7) | Everolimus | 1.14 (0.63 to 2.04) | 1.27 (0.36 to 4.49) | 1.14 (0.44 to 2.95) | 3.29 (2.21 to 4.90) | 1.40 (0.79 to 2.46) | 1.91 (0.90 to 4.06) | 1.65 (0.76 to 3.61) |
| 5.18 (1.14 to 23.5) | 0.88 (0.49 to 1.58) | Everolimus + SSA | 1.12 (0.33 to 3.79) | 1.00 (0.41 to 2.46) | 2.89 (1.61 to 5.19) | 1.23 (0.77 to 1.97) | 1.68 (0.71 to 4.00) | 1.46 (0.60 to 3.54) |
| 4.62 (0.71 to 30.2) | 0.78 (0.22 to 2.76) | 0.89 (0.26 to 3.02) | Interferon | 0.90 (0.29 to 2.79) | 2.58 (0.75 to 8.81) | 1.09 (0.36 to 3.37) | 1.50 (0.37 to 5.98) | 1.30 (0.32 to 5.26) |
| 5.16 (0.96 to 27.8) | 0.88 (0.34 to 2.26) | 1.00 (0.41 to 2.43) | 1.12 (0.36 to 3.47) | Interferon + SSA | 2.88 (1.16 to 7.13) | 1.22 (0.57 to 2.61) | 1.67 (0.55 to 5.07) | 1.45 (0.47 to 4.47) |
| 1.79 (0.42 to 7.64) | 0.30 (0.20 to 0.45) | 0.35 (0.19 to 0.62) | 0.39 (0.11 to 1.33) | 0.35 (0.14 to 0.86) | Placebo | 0.42 (0.26 to 0.70) | 0.58 (0.31 to 1.10) | 0.50 (0.26 to 0.98) |
| 4.22 (0.94 to 19.0) | 0.72 (0.41 to 1.26) | 0.81 (0.51 to 1.31) | 0.91 (0.30 to 2.81) | 0.82 (0.38 to 1.75) | 2.36 (1.43 to 3.88) | SSA | 1.37 (0.61 to 3.08) | 1.19 (0.51 to 2.73) |
| 3.09 (0.63 to 15.1) | 0.52 (0.25 to 1.11) | 0.60 (0.25 to 1.42) | 0.67 (0.17 to 2.67) | 0.60 (0.20 to 1.82) | 1.72 (0.91 to 3.27) | 0.73 (0.32 to 1.65) | Sunitinib | 0.87 (0.34 to 2.19) |
| 3.56 (0.72 to 17.6) | 0.60 (0.28 to 1.32) | 0.69 (0.28 to 1.67) | 0.77 (0.19 to 3.12) | 0.69 (0.22 to 2.13) | 1.99 (1.02 to 3.88) | 0.84 (0.37 to 1.94) | 1.15 (0.46 to 2.91) | Surufatinib |
Effects are odds ratios with 95% confidence intervals.
SSA: somatostatin analogues
Ten RCTs with one 3‐arm trial (Faiss 2003; Kulke 2016; Kulke 2017 (1); Pavel 2011; Phan 2015 (2); Raymond 2011 (1); Salazar 2018; Xu 2020 (p); Yao 2011; Yao 2017) assessed progression‐free survival for 11 different therapies in pNETs (Figure 5). Again, the network meta‐analysis found that single therapy with everolimus and combination therapies with a somatostatin analogue were highly effective, with HRs between 0.34 and 0.38 versus placebo. The lowest hazard for progression was found after treatment with everolimus (P score, 0.75), followed by interferon plus a somatostatin analogue (P score, 0.74), everolimus plus a somatostatin analogue (P score, 0.68), bevacizumab plus a somatostatin analogue (P score, 0.65), interferon (P score, 0.58), sunitinib (P score, 0.56), everolimus plus bevacizumab plus a somatostatin analogue (P score, 0.42), surufatinib (P score, 0.41), dactolisib (P score, 0.35), somatostatin analogues (P score, 0.33), and placebo (P score, 0.01). All therapies but dactolisib significantly reduced the hazard for progression compared with placebo (Figure 5, Table 6).
5.
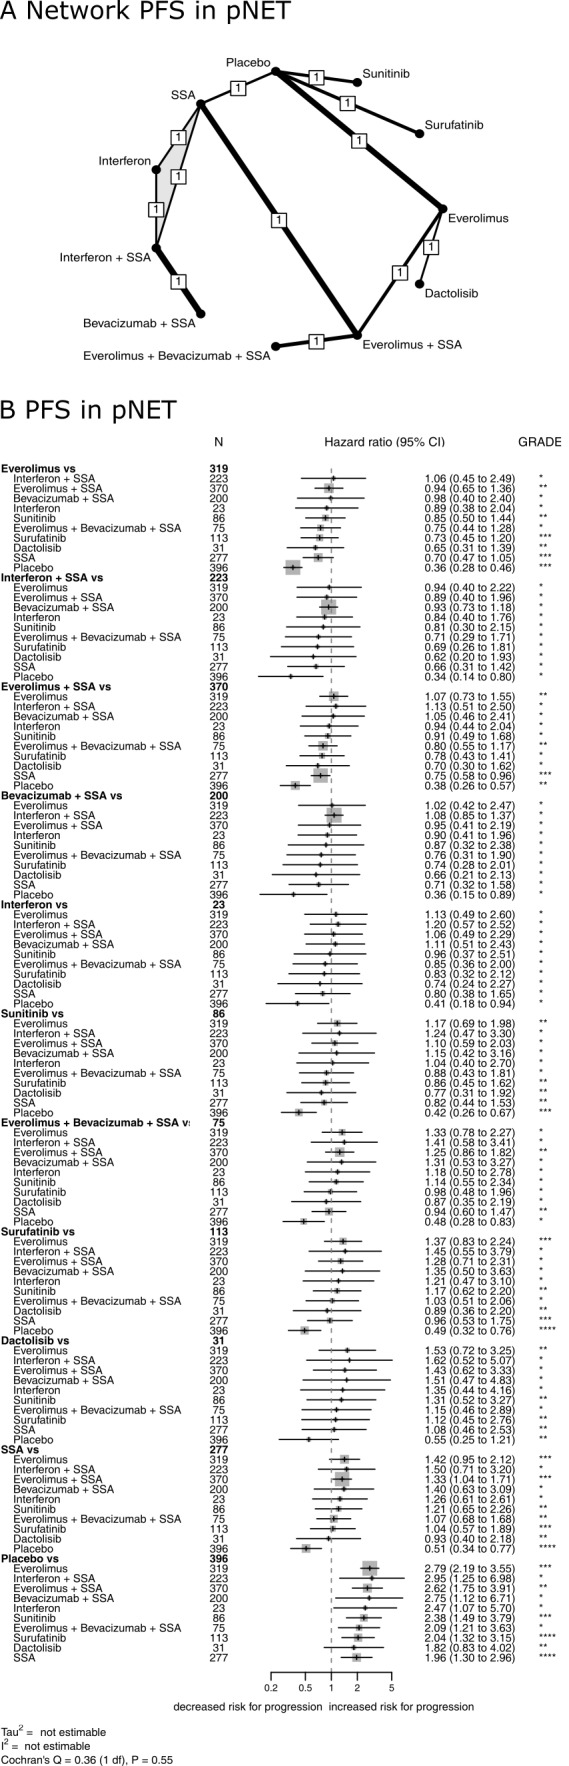
Treatment efficacy in pNET. Network plot (A) and Forest plot (B) for progression‐free survival in pNET. The thickness of the edges in the network plots is proportional to the inverse standard errors of the pairwise comparisons, and the numbers indicate the number of studies. One three‐arm study is marked by shading. Each section in the Forest plots refers to one treatment (in bold) compared to all others. An odds ratio larger than one indicates increased disease control of the bold treatment. A hazard ratio smaller than one indicates a reduced risk for progression for the bold treatment. All therapies are listed in order of their P‐scores, with the most effective therapy on top. Heterogeneity was assessed by the between study variance tau2, Cochran's Q with a P value, and I2. N refers to the total number of patients, and n to the number of patients with disease control. The Grading of Recommendations Assessment, Development and Evaluation (GRADE) approach was used to rate the quality of evidence of estimates from pairwise and network meta‐analysis. The final network meta‐analysis GRADE evidence quality corresponds to *very low, **low, ***moderate, and ****high. SSA refers to somatostatin analogues.
2. Comparison of all treatment options from the network meta‐analysis of progression‐free survival in pancreatic neuroendocrine tumours (pNET).
| Bevacizumab + SSA | 0.66 (0.21 to 2.13) | 1.02 (0.42 to 2.47) | 0.76 (0.31 to 1.90) | 0.95 (0.41 to 2.19) | 0.90 (0.41 to 1.96) | 1.08 (0.85 to 1.37) | 0.36 (0.15 to 0.89) | 0.71 (0.32 to 1.58) | 0.87 (0.32 to 2.38) | 0.74 (0.28 to 2.01) |
| 1.51 (0.47 to 4.83) | Dactolisib | 1.53 (0.72 to 3.25) | 1.15 (0.46 to 2.89) | 1.43 (0.62 to 3.33) | 1.35 (0.44 to 4.16) | 1.62 (0.52 to 5.07) | 0.55 (0.25 to 1.21) | 1.08 (0.46 to 2.53) | 1.31 (0.52 to 3.27) | 1.12 (0.45 to 2.76) |
| 0.98 (0.40 to 2.40) | 0.65 (0.31 to 1.39) | Everolimus | 0.75 (0.44 to 1.28) | 0.94 (0.65 to 1.36) | 0.89 (0.38 to 2.04) | 1.06 (0.45 to 2.49) | 0.36 (0.28 to 0.46) | 0.70 (0.47 to 1.05) | 0.85 (0.50 to 1.44) | 0.73 (0.45 to 1.20) |
| 1.31 (0.53 to 3.27) | 0.87 (0.35 to 2.19) | 1.33 (0.78 to 2.27) | Everolimus + bevacizumab + SSA | 1.25 (0.86 to 1.82) | 1.18 (0.50 to 2.78) | 1.41 (0.58 to 3.41) | 0.48 (0.28 to 0.83) | 0.94 (0.60 to 1.47) | 1.14 (0.55 to 2.34) | 0.98 (0.48 to 1.96) |
| 1.05 (0.46 to 2.41) | 0.70 (0.30 to 1.62) | 1.07 (0.73 to 1.55) | 0.80 (0.55 to 1.17) | Everolimus + SSA | 0.94 (0.44 to 2.04) | 1.13 (0.51 to 2.50) | 0.38 (0.26 to 0.57) | 0.75 (0.58 to 0.96) | 0.91 (0.49 to 1.68) | 0.78 (0.43 to 1.41) |
| 1.11 (0.51 to 2.43) | 0.74 (0.24 to 2.27) | 1.13 (0.49 to 2.60) | 0.85 (0.36 to 2.00) | 1.06 (0.49 to 2.29) | Interferon | 1.20 (0.57 to 2.52) | 0.41 (0.18 to 0.94) | 0.80 (0.38 to 1.65) | 0.96 (0.37 to 2.51) | 0.83 (0.32 to 2.12) |
| 0.93 (0.73 to 1.18) | 0.62 (0.20 to 1.93) | 0.94 (0.40 to 2.22) | 0.71 (0.29 to 1.71) | 0.89 (0.40 to 1.96) | 0.84 (0.40 to 1.76) | Interferon + SSA | 0.34 (0.14 to 0.80) | 0.66 (0.31 to 1.42) | 0.81 (0.30 to 2.15) | 0.69 (0.26 to 1.81) |
| 2.75 (1.12 to 6.71) | 1.82 (0.83 to 4.02) | 2.79 (2.19 to 3.55) | 2.09 (1.21 to 3.63) | 2.62 (1.75 to 3.91) | 2.47 (1.07 to 5.70) | 2.95 (1.25 to 6.98) | Placebo | 1.96 (1.30 to 2.96) | 2.38 (1.49 to 3.79) | 2.04 (1.32 to 3.15) |
| 1.40 (0.63 to 3.09) | 0.93 (0.40 to 2.18) | 1.42 (0.95 to 2.12) | 1.07 (0.68 to 1.68) | 1.33 (1.04 to 1.71) | 1.26 (0.61 to 2.61) | 1.50 (0.71 to 3.20) | 0.51 (0.34 to 0.77) | SSA | 1.21 (0.65 to 2.26) | 1.04 (0.57 to 1.89) |
| 1.15 (0.42 to 3.16) | 0.77 (0.31 to 1.92) | 1.17 (0.69 to 1.98) | 0.88 (0.43 to 1.81) | 1.10 (0.59 to 2.03) | 1.04 (0.40 to 2.70) | 1.24 (0.47 to 3.30) | 0.42 (0.26 to 0.67) | 0.82 (0.44 to 1.53) | Sunitinib | 0.86 (0.45 to 1.62) |
| 1.35 (0.50 to 3.63) | 0.89 (0.36 to 2.20) | 1.37 (0.83 to 2.24) | 1.03 (0.51 to 2.06) | 1.28 (0.71 to 2.31) | 1.21 (0.47 to 3.10) | 1.45 (0.55 to 3.79) | 0.49 (0.32 to 0.76) | 0.96 (0.53 to 1.75) | 1.17 (0.62 to 2.20) | Surufatinib |
Effects are hazard ratios with 95% confidence intervals.
SSA: somatostatin analogues
The quality of evidence in pNETs was generally the highest for everolimus and surufatinib. The detailed results of the quality assessment are displayed in Table 7 and Table 8.
3. Estimates of effects and quality ratings for disease control in pancreatic neuroendocrine tumours (pNET).
| Direct evidence | Indirect evidence | Network meta‐analysis | ||||
| Comparison | Odds ratio (95% CI) | Quality of evidence | Odds ratio (95% CI) | Quality of evidence | Odds ratio (95% CI) | Quality of evidence |
| Dactolisib vs everolimus | 0.17 (0.04 to 0.68) | Low*,§ | 0.17 (0.04 to 0.68) | Low§ | ||
| Dactolisib vs everolimus + SSA | 0.19 (0.04 to 0.87) | Very low||,§ | 0.19 (0.04 to 0.87) | Very low§ | ||
| Dactolisib vs interferon | 0.22 (0.03 to 1.41) | Very low|||,§§ | 0.22 (0.03 to 1.41) | Very low§§ | ||
| Dactolisib vs interferon + SSA | 0.19 (0.04 to 1.04) | Very low||,¶,§§ | 0.19 (0.04 to 1.04) | Very low§§ | ||
| Dactolisib vs placebo | 0.56 (0.13 to 2.37) | Very low|,§§ | 0.56 (0.13 to 2.37) | Very low§§ | ||
| Dactolisib vs SSA | 0.24 (0.05 to 1.07) | Very low|,§§ | 0.24 (0.05 to 1.07) | Very low§§ | ||
| Dactolisib vs sunitinib | 0.32 (0.07 to 1.58) | Very low|,§§ | 0.32 (0.07 to 1.58) | Very low§§ | ||
| Dactolisib vs surufatinib | 0.28 (0.06 to 1.38) | Very low|,§§ | 0.28 (0.06 to 1.38) | Very low§§ | ||
| Everolimus vs everolimus + SSA | 1.41 (0.65 to 3.08) | Very low**,§ | 0.86 (0.35 to 2.08) | Very low|,¶,§ | 1.14 (0.63 to 2.04) | Very low§ |
| Everolimus vs interferon | 1.27 (0.36 to 4.49) | Very low|||,§§ | 1.27 (0.36 to 4.49) | Very low§§ | ||
| Everolimus vs interferon + SSA | 1.14 (0.44 to 2.95) | Very low||,¶,§ | 1.14 (0.44 to 2.95) | Very low§ | ||
| Everolimus vs placebo | 3.08 (2.01 to 4.72) | High | 5.06 (1.68 to 15.2) | Very low||,¶¶ | 3.29 (2.21 to 4.90) | High |
| Everolimus vs SSA | 1.40 (0.79 to 2.46) | Low|,§ | 1.40 (0.79 to 2.46) | Low§ | ||
| Everolimus vs sunitinib | 1.91 (0.90 to 4.06) | Moderate§ | 1.91 (0.90 to 4.06) | Moderate§ | ||
| Everolimus vs surufatinib | 1.65 (0.76 to 3.61) | Moderate§ | 1.65 (0.76 to 3.61) | Moderate§ | ||
| Everolimus + SSA vs interferon | 1.12 (0.33 to 3.79) | Very low|||,¶,§§ | 1.12 (0.33 to 3.79) | Very low§§ | ||
| Everolimus + SSA vs interferon + SSA | 1.00 (0.41 to 2.46) | Very low||,¶,§ | 1.00 (0.41 to 2.46) | Very low§ | ||
| Everolimus + SSA vs placebo | 2.89 (1.61 to 5.19) | Moderate| | 2.89 (1.61 to 5.19) | Moderate | ||
| Everolimus + SSA vs SSA | 1.36 (0.80 to 2.30) | Low‡,§ | 0.83 (0.29 to 2.37) | Very low||,§§ | 1.23 (0.77 to 1.97) | Moderate |
| Everolimus + SSA vs sunitinib | 1.68 (0.71 to 4.00) | Very low|,§ | 1.68 (0.71 to 4.00) | Very low§ | ||
| Everolimus + SSA vs surufatinib | 1.46 (0.60 to 3.54) | Very low|,§ | 1.46 (0.60 to 3.54) | Very low§ | ||
| Interferon vs interferon + SSA | 1.07 (0.31 to 3.72) | Very low**,‡,§§ | 0.39 (0.03 to 5.94) | Very low|||,¶,§§ | 0.90 (0.29 to 2.79) | Very low#,§§ |
| Interferon vs placebo | 2.58 (0.75 to 8.81) | Very low|||,§§ | 2.58 (0.75 to 8.81) | Very low§§ | ||
| Interferon vs SSA | 0.93 (0.28 to 3.16) | Very low**,‡,§§ | 2.64 (0.15 to 46.3) | Very low|||,¶,§§ | 1.09 (0.36 to 3.37) | Very low#,§§ |
| Interferon vs sunitinib | 1.50 (0.37 to 5.98) | Very low|||,§§ | 1.50 (0.37 to 5.98) | Very low§§ | ||
| Interferon vs surufatinib | 1.30 (0.32 to 5.26) | Very low|||,§§ | 1.30 (0.32 to 5.26) | Very low§§ | ||
| Interferon + SSA vs placebo | 2.88 (1.16 to 7.13) | Very low||,¶ | 2.88 (1.16 to 7.13) | Very low | ||
| Interferon + SSA vs SSA | 1.22 (0.57 to 2.61) | Very low*,‡,§ | 1.22 (0.57 to 2.61) | Very low§ | ||
| Interferon + SSA vs sunitinib | 1.67 (0.55 to 5.07) | Very low||,¶,§§ | 1.67 (0.55 to 5.07) | Very low§§ | ||
| Interferon + SSA vs surufatinib | 1.45 (0.47 to 4.47) | Very low||,¶,§§ | 1.45 (0.47 to 4.47) | Very low§§ | ||
| Placebo vs SSA | 0.38 (0.21 to 0.67) | Moderate‡ | 0.62 (0.22 to 1.75) | Very low||,¶,§§ | 0.42 (0.26 to 0.70) | Moderate |
| Placebo vs sunitinib | 0.58 (0.31 to 1.10) | Moderate§ | 0.58 (0.31 to 1.10) | Moderate§ | ||
| Placebo vs surufatinib | 0.50 (0.26 to 0.98) | High | 0.50 (0.26 to 0.98) | High | ||
| SSA vs sunitinib | 1.37 (0.61 to 3.08) | Low|,§ | 1.37 (0.61 to 3.08) | Low§ | ||
| SSA vs surufatinib | 1.19 (0.51 to 2.73) | Low|,§ | 1.19 (0.51 to 2.73) | Low§ | ||
| Sunitinib vs surufatinib | 0.87 (0.34 to 2.19) | Moderate§ | 0.87 (0.34 to 2.19) | Moderate§ |
The confidence assessment addressed *risk of bias, †inconsistency, ‡indirectness, §imprecision, and #incoherence. Indirect estimates were potentially rated down for intransitivity.
Severe limitations are indicated by two symbols. Contributing direct evidence was of |moderate, ||low or |||very low quality.
Abbreviations: SSA: somatostatin analogues; CI: confidence interval
4. Estimates of effects and quality ratings for progression‐free survival in pancreatic neuroendocrine tumors (pNET).
| Direct evidence | Indirect evidence | Network meta‐analysis | ||||
| Comparison | Hazard ratio (95% CI) | Quality of evidence | Hazard ratio (95% CI) | Quality of evidence | Hazard ratio (95% CI) | Quality of evidence |
| Bevacizumab + SSA vs dactolisib | 0.66 (0.21 to 2.13) | Very low|||,¶,§§ | 0.66 (0.21 to 2.13) | Very low§§ | ||
| Bevacizumab + SSA vs everolimus | 1.02 (0.42 to 2.47) | Very low|||,¶,§ | 1.02 (0.42 to 2.47) | Very low§ | ||
| Bevacizumab + SSA vs everolimus + bevacizumab + SSA | 0.76 (0.31 to 1.90) | Very low|||,¶¶,§ | 0.76 (0.31 to 1.90) | Very low§ | ||
| Bevacizumab + SSA vs everolimus + SSA | 0.95 (0.41 to 2.19) | Very low|||,¶¶,§ | 0.95 (0.41 to 2.19) | Very low§ | ||
| Bevacizumab + SSA vs interferon | 0.90 (0.41 to 1.96) | Very low|||,¶,§ | 0.90 (0.41 to 1.96) | Very low§ | ||
| Bevacizumab + SSA vs interferon + SSA | 1.08 (0.85 to 1.37) | Low*,‡ | 1.08 (0.85 to 1.37) | Low | ||
| Bevacizumab + SSA vs placebo | 0.36 (0.15 to 0.89) | Very low|||,¶ | 0.36 (0.15 to 0.89) | Very low | ||
| Bevacizumab + SSA vs SSA | 0.71 (0.32 to 1.58) | Very low|||,¶,§ | 0.71 (0.32 to 1.58) | Very low§ | ||
| Bevacizumab + SSA vs sunitinib | 0.87 (0.32 to 2.38) | Very low|||,¶,§§ | 0.87 (0.32 to 2.38) | Very low§§ | ||
| Bevacizumab + SSA vs surufatinib | 0.74 (0.28 to 2.01) | Very low|||,¶,§ | 0.74 (0.28 to 2.01) | Very low§ | ||
| Dactolisib vs everolimus | 1.53 (0.72 to 3.25) | Low*,§ | 1.53 (0.72 to 3.25) | Low§ | ||
| Dactolisib vs everolimus + bevacizumab + SSA | 1.15 (0.46 to 2.89) | Very low||,¶,§ | 1.15 (0.46 to 2.89) | Very low§ | ||
| Dactolisib vs everolimus + SSA | 1.43 (0.62 to 3.33) | Very low||,§ | 1.43 (0.62 to 3.33) | Very low§ | ||
| Dactolisib vs interferon | 1.35 (0.44 to 4.16) | Very low||,§§ | 1.35 (0.44 to 4.16) | Very low§§ | ||
| Dactolisib vs interferon + SSA | 1.62 (0.52 to 5.07) | Very low||,§§ | 1.62 (0.52 to 5.07) | Very low§§ | ||
| Dactolisib vs placebo | 0.55 (0.25 to 1.21) | Low|,§ | 0.55 (0.25 to 1.21) | Low§ | ||
| Dactolisib vs SSA | 1.08 (0.46 to 2.53) | Low|,§ | 1.08 (0.46 to 2.53) | Low§ | ||
| Dactolisib vs sunitinib | 1.31 (0.52 to 3.27) | Low|,§ | 1.31 (0.52 to 3.27) | Low§ | ||
| Dactolisib vs surufatinib | 1.12 (0.45 to 2.76) | Low|,§ | 1.12 (0.45 to 2.76) | Low§ | ||
| Everolimus vs everolimus + bevacizumab + SSA | 0.75 (0.44 to 1.28) | Very low||,¶,§ | 0.75 (0.44 to 1.28) | Very low§ | ||
| Everolimus vs everolimus + SSA | 1.01 (0.65 to 1.57) | Low** | 0.78 (0.39 to 1.57) | Very low|,¶,§ | 0.94 (0.65 to 1.36) | Low |
| Everolimus vs interferon | 0.89 (0.38 to 2.04) | Very low||,§ | 0.89 (0.38 to 2.04) | Very low§ | ||
| Everolimus vs interferon + SSA | 1.06 (0.45 to 2.49) | Very low||,§ | 1.06 (0.45 to 2.49) | Very low§ | ||
| Everolimus vs placebo | 0.35 (0.27 to 0.45) | High | 0.45 (0.21 to 0.99) | Very low||,¶¶ | 0.36 (0.28 to 0.46) | High |
| Everolimus vs SSA | 0.70 (0.47 to 1.05) | High | 0.70 (0.47 to 1.05) | High | ||
| Everolimus vs sunitinib | 0.85 (0.50 to 1.44) | Moderate§ | 0.85 (0.50 to 1.44) | Moderate§ | ||
| Everolimus vs surufatinib | 0.73 (0.45 to 1.20) | High | 0.73 (0.45 to 1.20) | High | ||
| Everolimus + bevacizumab + SSA vs everolimus + SSA | 1.25 (0.86 to 1.82) | Moderate* | 1.25 (0.86 to 1.82) | Moderate | ||
| Everolimus + bevacizumab + SSA vs interferon | 1.18 (0.50 to 2.78) | Very low||,¶,§ | 1.18 (0.50 to 2.78) | Very low§ | ||
| Everolimus + bevacizumab + SSA vs interferon + SSA | 1.41 (0.58 to 3.41) | Very low||,¶¶,§ | 1.41 (0.58 to 3.41) | Very low§ | ||
| Everolimus + bevacizumab + SSA vs placebo | 0.48 (0.28 to 0.83) | Low|,¶ | 0.48 (0.28 to 0.83) | Low | ||
| Everolimus + bevacizumab + SSA vs SSA | 0.94 (0.60 to 1.47) | Moderate| | 0.94 (0.60 to 1.47) | Moderate | ||
| Everolimus + bevacizumab + SSA vs sunitinib | 1.14 (0.55 to 2.34) | Very low|,¶,§ | 1.14 (0.55 to 2.34) | Very low§ | ||
| Everolimus + bevacizumab + SSA vs surufatinib | 0.98 (0.48 to 1.96) | Very low|,¶,§ | 0.98 (0.48 to 1.96) | Very low§ | ||
| Everolimus + SSA vs interferon | 0.94 (0.44 to 2.04) | Very low||,¶,§ | 0.94 (0.44 to 2.04) | Very low§ | ||
| Everolimus + SSA vs interferon + SSA | 1.13 (0.51 to 2.50) | Very low||,¶,§ | 1.13 (0.51 to 2.50) | Very low§ | ||
| Everolimus + SSA vs placebo | 0.38 (0.26 to 0.57) | Low| | 0.38 (0.26 to 0.57) | Low | ||
| Everolimus + SSA vs SSA | 0.77 (0.59 to 1.00) | Moderate‡ | 0.60 (0.27 to 1.30) | Very low||,§ | 0.75 (0.58 to 0.96) | Moderate |
| Everolimus + SSA vs sunitinib | 0.91 (0.49 to 1.68) | Very low|,§ | 0.91 (0.49 to 1.68) | Very low§ | ||
| Everolimus + SSA vs surufatinib | 0.78 (0.43 to 1.41) | Very low|,§ | 0.78 (0.43 to 1.41) | Very low§ | ||
| Interferon vs interferon + SSA | 1.20 (0.57 to 2.52) | Very low**,‡,§ | 1.20 (0.57 to 2.52) | Very low§ | ||
| Interferon vs placebo | 0.41 (0.18 to 0.94) | Very low||| | 0.41 (0.18 to 0.94) | Very low | ||
| Interferon vs SSA | 0.80 (0.38 to 1.65) | Very low**,‡,§ | 0.80 (0.38 to 1.65) | Very low§ | ||
| Interferon vs sunitinib | 0.96 (0.37 to 2.51) | Very low|||,§ | 0.96 (0.37 to 2.51) | Very low§ | ||
| Interferon vs surufatinib | 0.83 (0.32 to 2.12) | Very low|||,§ | 0.83 (0.32 to 2.12) | Very low§ | ||
| Interferon + SSA vs placebo | 0.34 (0.14 to 0.80) | Very low||| | 0.34 (0.14 to 0.80) | Very low | ||
| Interferon + SSA vs SSA | 0.66 (0.31 to 1.42) | Very low**,‡,§ | 0.66 (0.31 to 1.42) | Very low§ | ||
| Interferon + SSA vs sunitinib | 0.81 (0.30 to 2.15) | Very low|||,§ | 0.81 (0.30 to 2.15) | Very low§ | ||
| Interferon + SSA vs surufatinib | 0.69 (0.26 to 1.81) | Very low|||,§ | 0.69 (0.26 to 1.81) | Very low§ | ||
| Placebo vs SSA | 1.72 (0.96 to 3.11) | Moderate§ | 2.22 (1.25 to 3.95) | Very low||,¶ | 1.96 (1.30 to 2.96) | High |
| Placebo vs sunitinib | 2.38 (1.49 to 3.79) | High | 2.38 (1.49 to 3.79) | High | ||
| Placebo vs surufatinib | 2.04 (1.32 to 3.15) | High | 2.04 (1.32 to 3.15) | High | ||
| SSA vs sunitinib | 1.21 (0.65 to 2.26) | Moderate§ | 1.21 (0.65 to 2.26) | Moderate§ | ||
| SSA vs surufatinib | 1.04 (0.57 to 1.89) | Moderate§ | 1.04 (0.57 to 1.89) | Moderate§ | ||
| Sunitinib vs surufatinib | 0.86 (0.45 to 1.62) | Moderate§ | 0.86 (0.45 to 1.62) | Moderate§ |
The confidence assessment addressed *risk of bias, †inconsistency, ‡indirectness, §imprecision, and #incoherence. Indirect estimates were potentially rated down for intransitivity.
Severe limitations are indicated by two symbols. Contributing direct evidence was of |moderate, ||low or |||very low quality.
Abbreviations: SSA: somatostatin analogues; CI: confidence interval
Treatment efficacy in GI‐NETs
Eleven RCTs (Arnold 2005; Caplin 2014; Castellano 2013; Faiss 2003; Kölby 2003; Öberg 1989; Rinke 2009; Strosberg 2017; Xu 2020 (ep); Yao 2008 (1); Yao 2016) compared disease control rates for 10 different therapies in GI‐NETs (Figure 6). The network meta‐analysis found that combination therapies with a somatostatin analogue were highly effective. Bevacizumab plus a somatostatin analogue resulted in the highest disease control rate (P score, 0.91), followed by 177‐Lu‐DOTATATE plus a somatostatin analogue (P score, 0.90), everolimus plus a somatostatin analogue (P score, 0.78), interferon plus a somatostatin analogue (P score, 0.60), interferon (P score, 0.48), surufatinib (P score, 0.45), somatostatin analogues (P score, 0.37), everolimus (P score, 0.35), placebo (P score, 0.11), and streptozocin plus fluorouracil (P score, 0.04). All therapies but interferon, everolimus, and streptozocin plus fluorouracil showed significantly higher disease control rates than placebo (Figure 6, Table 9).
6.
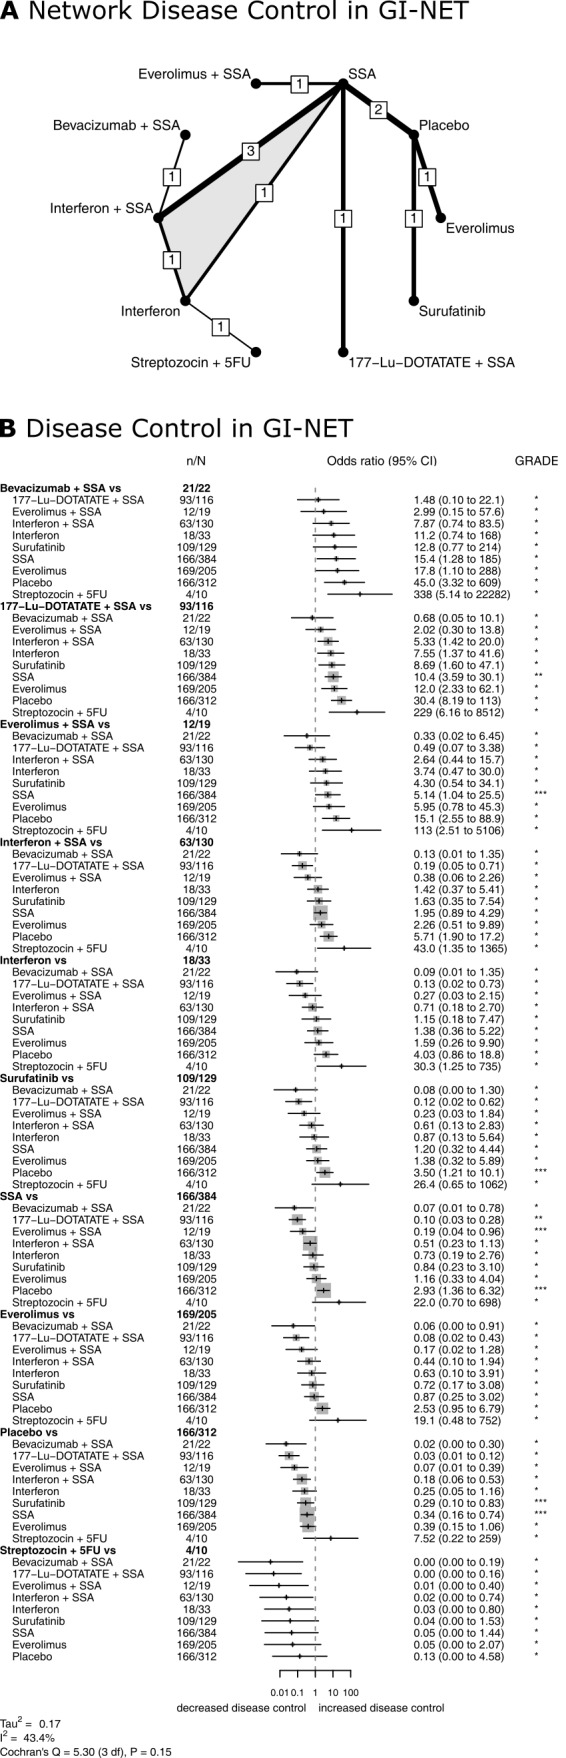
Treatment efficacy in GI‐NET. Network plot (A) and Forest plot (B) for disease control in GI‐NET. The thickness of the edges in the network plots is proportional to the inverse standard errors of the pairwise comparisons, and the numbers indicate the number of studies. One three‐arm study is marked by shading. Each section in the Forest plots refers to one treatment (in bold) compared to all others. An odds ratio larger than one indicates increased disease control of the bold treatment. A hazard ratio smaller than one indicates a reduced risk for progression for the bold treatment. All therapies are listed in order of their P‐scores, with the most effective therapy on top. Heterogeneity was assessed by the between study variance tau2, Cochran's Q with a P value, and I2. N refers to the total number of patients, and n to the number of patients with disease control. The Grading of Recommendations Assessment, Development and Evaluation (GRADE) approach was used to rate the quality of evidence of estimates from pairwise and network meta‐analysis. The final network meta‐analysis GRADE evidence quality corresponds to *very low, **low, ***moderate, and ****high. SSA refers to somatostatin analogues.
5. Comparison of all treatment options from the network meta‐analysis of disease control in gastrointestinal neuroendocrine tumours (GI‐NET).
| 177‐Lu‐DOTATATE + SSA | 0.68 (0.05 to 10.1) | 12.0 (2.33 to 62.1) | 2.02 (0.30 to 13.8) | 7.55 (1.37 to 41.6) | 5.33 (1.42 to 20.0) | 30.4 (8.19 to 113) | 10.4 (3.59 to 30.1) | 229 (6.16 to 8512) | 8.69 (1.60 to 47.1) |
| 1.48 (0.10 to 22.1) | Bevacizumab + SSA | 17.8 (1.10 to 288) | 2.99 (0.15 to 57.6) | 11.2 (0.74 to 168) | 7.87 (0.74 to 83.5) | 45.0 (3.32 to 609) | 15.4 (1.28 to 185) | 338 (5.14 to 22282) | 12.8 (0.77 to 214) |
| 0.08 (0.02 to 0.43) | 0.06 (0.00 to 0.91) | Everolimus | 0.17 (0.02 to 1.28) | 0.63 (0.10 to 3.91) | 0.44 (0.10 to 1.94) | 2.53 (0.95 to 6.79) | 0.87 (0.25 to 3.02) | 19.1 (0.48 to 752) | 0.72 (0.17 to 3.08) |
| 0.49 (0.07 to 3.38) | 0.33 (0.02 to 6.45) | 5.95 (0.78 to 45.3) | Everolimus + SSA | 3.74 (0.47 to 30.0) | 2.64 (0.44 to 15.7) | 15.1 (2.55 to 88.9) | 5.14 (1.04 to 25.5) | 113 (2.51 to 5106) | 4.30 (0.54 to 34.1) |
| 0.13 (0.02 to 0.73) | 0.09 (0.01 to 1.35) | 1.59 (0.26 to 9.90) | 0.27 (0.03 to 2.15) | Interferon | 0.71 (0.18 to 2.70) | 4.03 (0.86 to 18.8) | 1.38 (0.36 to 5.22) | 30.3 (1.25 to 735) | 1.15 (0.18 to 7.47) |
| 0.19 (0.05 to 0.71) | 0.13 (0.01 to 1.35) | 2.26 (0.51 to 9.89) | 0.38 (0.06 to 2.26) | 1.42 (0.37 to 5.41) | Interferon + SSA | 5.71 (1.90 to 17.2) | 1.95 (0.89 to 4.29) | 43.0 (1.35 to 1365) | 1.63 (0.35 to 7.54) |
| 0.03 (0.01 to 0.12) | 0.02 (0.00 to 0.30) | 0.39 (0.15 to 1.06) | 0.07 (0.01 to 0.39) | 0.25 (0.05 to 1.16) | 0.18 (0.06 to 0.53) | Placebo | 0.34 (0.16 to 0.74) | 7.52 (0.22 to 259) | 0.29 (0.10 to 0.83) |
| 0.10 (0.03 to 0.28) | 0.07 (0.01 to 0.78) | 1.16 (0.33 to 4.04) | 0.19 (0.04 to 0.96) | 0.73 (0.19 to 2.76) | 0.51 (0.23 to 1.13) | 2.93 (1.36 to 6.32) | SSA | 22.0 (0.70 to 698) | 0.84 (0.23 to 3.10) |
| 0.00 (0.00 to 0.16) | 0.00 (0.00 to 0.19) | 0.05 (0.00 to 2.07) | 0.01 (0.00 to 0.40) | 0.03 (0.00 to 0.80) | 0.02 (0.00 to 0.74) | 0.13 (0.00 to 4.58) | 0.05 (0.00 to 1.44) | Streptozocin + 5FU | 0.04 (0.00 to 1.53) |
| 0.12 (0.02 to 0.62) | 0.08 (0.00 to 1.30) | 1.38 (0.32 to 5.89) | 0.23 (0.03 to 1.84) | 0.87 (0.13 to 5.64) | 0.61 (0.13 to 2.83) | 3.50 (1.21 to 10.1) | 1.20 (0.32 to 4.44) | 26.4 (0.65 ‐ 1062) | Surufatinib |
Effects are odds ratios with 95% confidence intervals.
SSA: somatostatin analogues
Nine RCTs (Castellano 2013; Dasari 2015; Faiss 2003; Rinke 2009; Singh 2018 (1); Strosberg 2017; Xu 2020 (ep); Yao 2008 (1); Yao 2017) assessed progression‐free survival for nine different therapies in GI‐NETS (Figure 7). Again, the network meta‐analysis found that combination therapies with a somatostatin analogue were highly effective with HRs between 0.07 and 0.23 versus placebo. The lowest hazard for progression was found after treatment with 177‐Lu‐DOTATATE plus a somatostatin analogue (P score, 0.93), followed by everolimus plus a somatostatin analogue (P score, 0.79), bevacizumab plus a somatostatin analogue (P score, 0.66), interferon plus a somatostatin analogue (P score, 0.56), interferon (P score, 0.49), surufatinib (P score, 0.43), somatostatin analogues (P score, 0.39), everolimus (P score, 0.23), and placebo (P score, 0.03). All therapies but interferon and everolimus significantly reduced the hazard for progression compared with placebo (Figure 7, Table 10).
7.
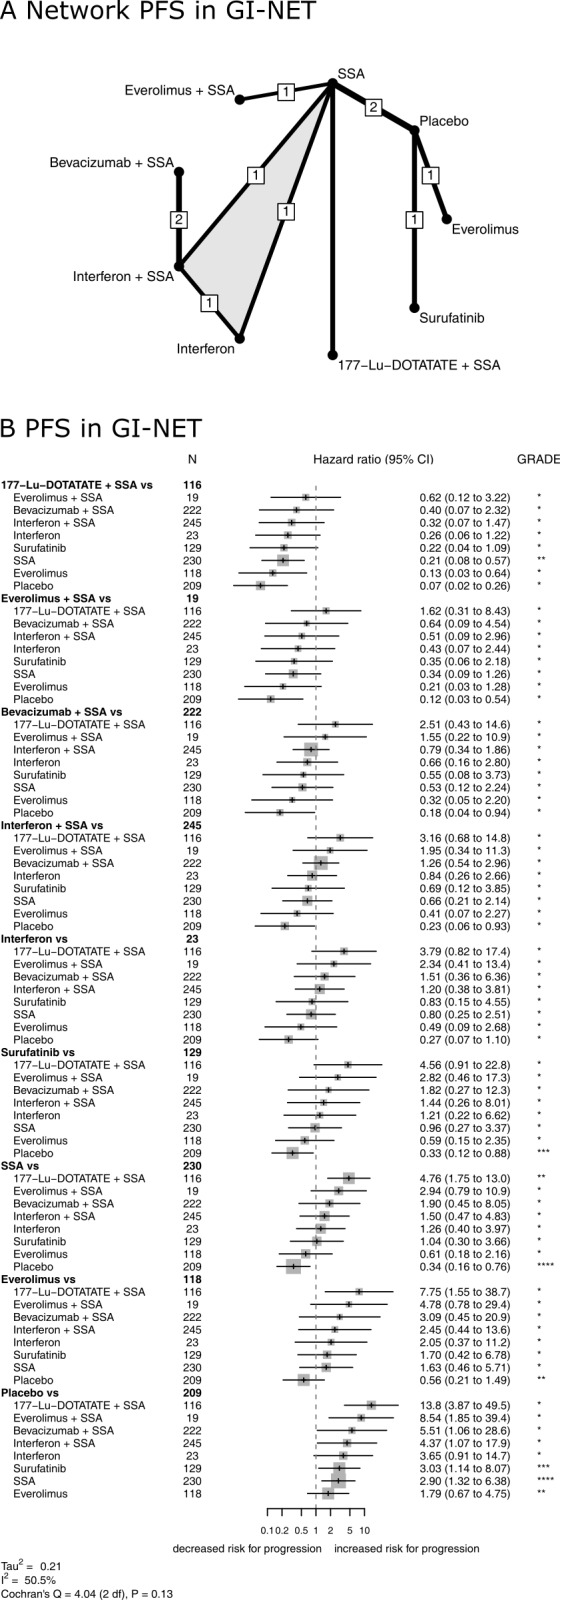
Treatment efficacy in GI‐NET. Network plot (A) and Forest plot (B) for progression‐free survival in GI‐NET. The thickness of the edges in the network plots is proportional to the inverse standard errors of the pairwise comparisons, and the numbers indicate the number of studies. One three‐arm study is marked by shading. Each section in the Forest plots refers to one treatment (in bold) compared to all others. An odds ratio larger than one indicates increased disease control of the bold treatment. A hazard ratio smaller than one indicates a reduced risk for progression for the bold treatment. All therapies are listed in order of their P‐scores, with the most effective therapy on top. Heterogeneity was assessed by the between study variance tau2, Cochran's Q with a P value, and I2. N refers to the total number of patients, and n to the number of patients with disease control. The Grading of Recommendations Assessment, Development and Evaluation (GRADE) approach was used to rate the quality of evidence of estimates from pairwise and network meta‐analysis. The final network meta‐analysis GRADE evidence quality corresponds to *very low, **low, ***moderate, and ****high. SSA refers to somatostatin analogues.
6. Comparison of all treatment options from the network meta‐analysis of progression‐free survival in gastrointestinal neuroendocrine tumours (GI‐NET).
| 177‐Lu‐DOTATATE + SSA | 0.40 (0.07 to 2.32) | 0.13 (0.03 to 0.64) | 0.62 (0.12 to 3.22) | 0.26 (0.06 to 1.22) | 0.32 (0.07 to 1.47) | 0.07 (0.02 to 0.26) | 0.21 (0.08 to 0.57) | 0.22 (0.04 to 1.09) |
| 2.51 (0.43 to 14.6) | Bevacizumab + SSA | 0.32 (0.05 to 2.20) | 1.55 (0.22 to 10.9) | 0.66 (0.16 to 2.80) | 0.79 (0.34 to 1.86) | 0.18 (0.04 to 0.94) | 0.53 (0.12 to 2.24) | 0.55 (0.08 to 3.73) |
| 7.75 (1.55 to 38.7) | 3.09 (0.45 to 20.9) | Everolimus | 4.78 (0.78 to 29.4) | 2.05 (0.37 to 11.2) | 2.45 (0.44 to 13.6) | 0.56 (0.21 to 1.49) | 1.63 (0.46 to 5.71) | 1.70 (0.42 to 6.78) |
| 1.62 (0.31 to 8.43) | 0.64 (0.09 to 4.54) | 0.21 (0.03 to 1.28) | Everolimus + SSA | 0.43 (0.07 to 2.44) | 0.51 (0.09 to 2.96) | 0.12 (0.03 to 0.54) | 0.34 (0.09 to 1.26) | 0.35 (0.06 to 2.18) |
| 3.79 (0.82 to 17.4) | 1.51 (0.36 to 6.36) | 0.49 (0.09 to 2.68) | 2.34 (0.41 to 13.4) | Interferon | 1.20 (0.38 to 3.81) | 0.27 (0.07 to 1.10) | 0.80 (0.25 to 2.51) | 0.83 (0.15 to 4.55) |
| 3.16 (0.68 to 14.8) | 1.26 (0.54 to 2.96) | 0.41 (0.07 to 2.27) | 1.95 (0.34 to 11.3) | 0.84 (0.26 to 2.66) | Interferon + SSA | 0.23 (0.06 to 0.93) | 0.66 (0.21 to 2.14) | 0.69 (0.12 to 3.85) |
| 13.8 (3.87 to 49.5) | 5.51 (1.06 to 28.6) | 1.79 (0.67 to 4.75) | 8.54 (1.85 to 39.4) | 3.65 (0.91 to 14.7) | 4.37 (1.07 to 17.9) | Placebo | 2.90 (1.32 to 6.38) | 3.03 (1.14 to 8.07) |
| 4.76 (1.75 to 13.0) | 1.90 (0.45 to 8.05) | 0.61 (0.18 to 2.16) | 2.94 (0.79 to 10.9) | 1.26 (0.40 to 3.97) | 1.50 (0.47 to 4.83) | 0.34 (0.16 to 0.76) | SSA | 1.04 (0.30 to 3.66) |
| 4.56 (0.91 to 22.8) | 1.82 (0.27 to 12.3) | 0.59 (0.15 to 2.35) | 2.82 (0.46 to 17.3) | 1.21 (0.22 to 6.62) | 1.44 (0.26 to 8.01) | 0.33 (0.12 ‐ 0.88) | 0.96 (0.27 to 3.37) | Surufatinib |
Effects are hazard ratios with 95% confidence intervals.
SSA: somatostatin analogues
The quality of evidence in GI‐NETs was generally the highest for somatostatin analogues. The detailed results of the quality assessment are displayed in Table 11 and Table 12.
7. Estimates of effects and quality ratings for disease control in gastrointestinal neuroendocrine tumors (GI‐NET).
| Direct evidence | Indirect evidence | Network meta‐analysis | ||||
| Comparison | Odds ratio (95% CI) | Quality of evidence | Odds ratio (95% CI) | Quality of evidence | Odds ratio (95% CI) | Quality of evidence |
| 177‐Lu‐DOTATATE + SSA vs bevacizumab + SSA | 0.68 (0.05 to 10.1) | Very low|||,¶¶,§§ | 0.68 (0.05 to 10.1) | Very low§§ | ||
| 177‐Lu‐DOTATATE + SSA vs everolimus | 12.0 (2.33 to 62.1) | Very low||,¶,§ | 12.0 (2.33 to 62.1) | Very low§ | ||
| 177‐Lu‐DOTATATE + SSA vs everolimus + SSA | 2.02 (0.30 to 13.8) | Very low||,§§ | 2.02 (0.30 to 13.8) | Very low§§ | ||
| 177‐Lu‐DOTATATE + SSA vs interferon | 7.55 (1.37 to 41.6) | Very low|||,¶,§ | 7.55 (1.37 to 41.6) | Very low§ | ||
| 177‐Lu‐DOTATATE + SSA vs interferon + SSA | 5.33 (1.42 to 20.0) | Very low|||,¶,§ | 5.33 (1.42 to 20.0) | Very low§ | ||
| 177‐Lu‐DOTATATE + SSA vs placebo | 30.4 (8.19 to 113) | Very low||,¶,§ | 30.4 (8.19 to 113) | Very low§ | ||
| 177‐Lu‐DOTATATE + SSA vs SSA | 10.4 (3.59 to 30.1) | Low** | 10.4 (3.59 to 30.1) | Low | ||
| 177‐Lu‐DOTATATE + SSA vs streptozocin + 5FU | 229 (6.16 to 8512) | Very low|||,¶,§ | 229 (6.16 to 8512) | Very low§ | ||
| 177‐Lu‐DOTATATE + SSA vs surufatinib | 8.69 (1.60 to 47.1) | Very low||,¶,§ | 8.69 (1.60 to 47.1) | Very low§ | ||
| Bevacizumab + SSA vs everolimus | 17.8 (1.10 to 288) | Very low|||,¶¶,§ | 17.8 (1.10 to 288) | Very low§ | ||
| Bevacizumab + SSA vs everolimus + SSA | 2.99 (0.15 to 57.6) | Very low|||,¶¶,§§ | 2.99 (0.15 to 57.6) | Very low§§ | ||
| Bevacizumab + SSA vs interferon | 11.2 (0.74 to 168) | Very low|||,¶¶,§§ | 11.2 (0.74 to 168) | Very low§§ | ||
| Bevacizumab + SSA vs interferon + SSA | 7.88 (0.74 to 83.5) | Very low**,‡,§§ | 7.87 (0.74 to 83.5) | Very low§§ | ||
| Bevacizumab + SSA vs placebo | 45.0 (3.32 to 609) | Very low|||,¶¶,§ | 45.0 (3.32 to 609) | Very low§ | ||
| Bevacizumab + SSA vs SSA | 15.4 (1.28 to 185) | Very low|||,¶¶,§ | 15.4 (1.28 to 185) | Very low§ | ||
| Bevacizumab + SSA vs streptozocin + 5‐FU | 338 (5.14 to 22282) | Very low|||,¶¶,§ | 338 (5.14 to 22282) | Very low§ | ||
| Bevacizumab + SSA vs surufatinib | 12.8 (0.77 to 214) | Very low|||,¶¶,§§ | 12.8 (0.77 to 214) | Very low§§ | ||
| Everolimus vs everolimus + SSA | 0.17 (0.02 to 1.28) | Very low||,¶,§§ | 0.17 (0.02 to 1.28) | Very low§§ | ||
| Everolimus vs interferon | 0.63 (0.10 to 3.91) | Very low|||,¶,§§ | 0.63 (0.10 to 3.91) | Very low§§ | ||
| Everolimus vs interferon + SSA | 0.44 (0.10 to 1.94) | Very low|||,¶,§§ | 0.44 (0.10 to 1.94) | Very low§§ | ||
| Everolimus vs placebo | 2.53 (0.95 to 6.79) | Very low*,‡,§ | 2.53 (0.95 to 6.79) | Very low§ | ||
| Everolimus vs SSA | 0.87 (0.25 to 3.02) | Very low||,§§ | 0.87 (0.25 to 3.02) | Very low§§ | ||
| Everolimus vs streptozocin + 5‐FU | 19.1 (0.48 to 752) | Very low|||,¶,§§ | 19.1 (0.48 to 752) | Very low§§ | ||
| Everolimus vs surufatinib | 0.72 (0.17 to 3.08) | Very low||,§§ | 0.72 (0.17 to 3.08) | Very low§§ | ||
| Everolimus + SSA vs interferon | 3.74 (0.47 to 30.0) | Very low|||,¶,§§ | 3.74 (0.47 to 30.0) | Very low§§ | ||
| Everolimus + SSA vs interferon + SSA | 2.64 (0.44 to 15.7) | Very low|||,¶,§§ | 2.64 (0.44 to 15.7) | Very low§§ | ||
| Everolimus + SSA vs placebo | 15.1 (2.55 to 88.9) | Very low|,¶,§ | 15.1 (2.55 to 88.9) | Very low§ | ||
| Everolimus + SSA vs SSA | 5.14 (1.04 to 25.5) | Moderate§ | 5.14 (1.04 to 25.5) | Moderate§ | ||
| Everolimus + SSA vs streptozocin + 5‐FU | 113 (2.51 to 5106) | Very low|||,¶,§ | 113 (2.51 to 5106) | Very low§ | ||
| Everolimus + SSA vs surufatinib | 4.30 (0.54 to 34.1) | Very low|,¶,§§ | 4.30 (0.54 to 34.1) | Very low§§ | ||
| Interferon vs interferon + SSA | 1.07 (0.24 to 4.74) | Very low**,‡,§§ | 0.13 (0.01 to 2.66) | Very low|||,¶,§§ | 0.71 (0.18 to 2.70) | Very low§§ |
| Interferon vs placebo | 4.03 (0.86 to 18.8) | Very low|||,¶,§§ | 4.03 (0.86 to 18.8) | Very low§§ | ||
| Interferon vs SSA | 0.93 (0.21 to 4.06) | Very low**,‡,§§ | 8.41 (0.35 to 201) | Very low|||,¶,§§ | 1.38 (0.36 to 5.22) | Very low§§ |
| Interferon vs streptozocin + 5‐FU | 30.3 (1.25 to 735) | Very low**,‡,§ | 30.3 (1.25 to 735) | Very low§ | ||
| Interferon vs surufatinib | 1.15 (0.18 to 7.47) | Very low|||,¶,§§ | 1.15 (0.18 to 7.47) | Very low§§ | ||
| Interferon + SSA vs placebo | 5.71 (1.90 to 17.2) | Very low|||,¶ | 5.71 (1.90 to 17.2) | Very low | ||
| Interferon + SSA vs SSA | 1.95 (0.89 to 4.29) | Very low*,††,‡,§ | 1.95 (0.89 to 4.29) | Very low§ | ||
| Interferon + SSA vs streptozocin + 5‐FU | 43.0 (1.35 to 1365) | Very low|||,§ | 43.0 (1.35 to 1365) | Very low§ | ||
| Interferon + SSA vs surufatinib | 1.63 (0.35 to 7.54) | Very low|||,¶,§§ | 1.63 (0.35 to 7.54) | Very low§§ | ||
| Placebo vs SSA | 0.34 (0.16 to 0.74) | Moderate‡ | 0.34 (0.16 to 0.74) | Moderate | ||
| Placebo vs streptozocin + 5‐FU | 7.52 (0.22 to 259) | Very low|||,¶,§§ | 7.52 (0.22 to 259) | Very low§§ | ||
| Placebo vs surufatinib | 0.29 (0.10 to 0.83) | Moderate‡ | 0.29 (0.10 to 0.83) | Moderate | ||
| SSA vs streptozocin + 5‐FU | 22.0 (0.70 to 698) | Very low|||,§§ | 22.0 (0.70 to 698) | Very low§§ | ||
| SSA vs surufatinib | 0.84 (0.23 to 3.10) | Very low|,§§ | 0.84 (0.23 to 3.10) | Very low§§ | ||
| Streptozocin + 5‐FU vs surufatinib | 0.04 (0.00 to 1.53) | Very low|||,¶,§§ | 0.04 (0.00 to 1.53) | Very low§§ |
The confidence assessment addressed *risk of bias, †inconsistency, ‡indirectness, §imprecision, and #incoherence. Indirect estimates were potentially rated down for intransitivity.
Severe limitations are indicated by two symbols. Contributing direct evidence was of |moderate, ||low or |||very low quality.
Abbreviations: SSA: somatostatin analogues; 5‐FU: 5‐Fluorouracil; Lu: Lutetium; CI: confidence interval
8. Estimates of effects and quality ratings for progression‐free survival in gastrointestinal neuroendocrine tumors (GI‐NET).
| Direct evidence | Indirect evidence | Network meta‐analysis | ||||
| Comparison | Hazard ratio (95% CI) | Quality of evidence | Hazard ratio (95% CI) | Quality of evidence | Hazard ratio (95% CI) | Quality of evidence |
| 177‐Lu‐DOTATATE + SSA vs bevacizumab + SSA | 0.40 (0.07 to 2.32) | Very low|||,¶¶,§§ | 0.40 (0.07 to 2.32) | Very low§§ | ||
| 177‐Lu‐DOTATATE + SSA vs everolimus | 0.13 (0.03 to 0.64) | Very low||,¶,§ | 0.13 (0.03 to 0.64) | Very low§ | ||
| 177‐Lu‐DOTATATE + SSA vs everolimus + SSA | 0.62 (0.12 to 3.22) | Very low||,§§ | 0.62 (0.12 to 3.22) | Very low§§ | ||
| 177‐Lu‐DOTATATE + SSA vs interferon | 0.26 (0.06 to 1.22) | Very low|||,¶,§§ | 0.26 (0.06 to 1.22) | Very low§§ | ||
| 177‐Lu‐DOTATATE + SSA vs interferon + SSA | 0.32 (0.07 to 1.47) | Very low|||,¶,§§ | 0.32 (0.07 to 1.47) | Very low§§ | ||
| 177‐Lu‐DOTATATE + SSA vs placebo | 0.07 (0.02 to 0.26) | Very low||,¶,§ | 0.07 (0.02 to 0.26) | Very low§ | ||
| 177‐Lu‐DOTATATE + SSA vs SSA | 0.21 (0.08 to 0.57) | Low** | 0.21 (0.08 to 0.57) | Low | ||
| 177‐Lu‐DOTATATE + SSA vs surufatinib | 0.22 (0.04 to 1.09) | Very low||,¶,§§ | 0.22 (0.04 to 1.09) | Very low§§ | ||
| Bevacizumab + SSA vs everolimus | 0.32 (0.05 to 2.20) | Very low|||,¶¶,§§ | 0.32 (0.05 to 2.20) | Very low§§ | ||
| Bevacizumab + SSA vs everolimus + SSA | 1.55 (0.22 to 10.9) | Very low|||,¶¶,§§ | 1.55 (0.22 to 10.9) | Very low§§ | ||
| Bevacizumab + SSA vs interferon | 0.66 (0.16 to 2.80) | Very low|||,¶¶,§§ | 0.66 (0.16 to 2.80) | Very low§§ | ||
| Bevacizumab + SSA vs interferon + SSA | 0.79 (0.34 to 1.86) | Very low*,††,‡,§ | 0.79 (0.34 to 1.86) | Very low§ | ||
| Bevacizumab + SSA vs placebo | 0.18 (0.04 to 0.94) | Very low|||,¶¶,§ | 0.18 (0.04 to 0.94) | Very low§ | ||
| Bevacizumab + SSA vs SSA | 0.53 (0.12 to 2.24) | Very low|||,¶¶,§§ | 0.53 (0.12 to 2.24) | Very low§§ | ||
| Bevacizumab + SSA vs surufatinib | 0.55 (0.08 to 3.73) | Very low|||,¶¶,§§ | 0.55 (0.08 to 3.73) | Very low§§ | ||
| Everolimus vs everolimus + SSA | 4.78 (0.78 to 29.4) | Very low|,¶,§§ | 4.78 (0.78 to 29.4) | Very low§§ | ||
| Everolimus vs interferon | 2.05 (0.37 to 11.2) | Very low|||,¶,§§ | 2.05 (0.37 to 11.2) | Very low§§ | ||
| Everolimus vs interferon + SSA | 2.45 (0.44 to 13.6) | Very low|||,¶,§§ | 2.45 (0.44 to 13.6) | Very low§§ | ||
| Everolimus vs placebo | 0.56 (0.21 to 1.49) | Low*,§ | 0.56 (0.21 to 1.49) | Low§ | ||
| Everolimus vs SSA | 1.63 (0.46 to 5.71) | Very low|,¶,§§ | 1.63 (0.46 to 5.71) | Very low§§ | ||
| Everolimus vs surufatinib | 1.70 (0.42 to 6.78) | Very low|,§§ | 1.70 (0.42 to 6.78) | Very low§§ | ||
| Everolimus + SSA vs interferon | 0.43 (0.07 to 2.44) | Very low|||,¶,§§ | 0.43 (0.07 to 2.44) | Very low§§ | ||
| Everolimus + SSA vs interferon + SSA | 0.51 (0.09 to 2.96) | Very low|||,¶,§§ | 0.51 (0.09 to 2.96) | Very low§§ | ||
| Everolimus + SSA vs placebo | 0.12 (0.03 to 0.54) | Very low|,¶,§ | 0.12 (0.03 to 0.54) | Very low§ | ||
| Everolimus + SSA vs SSA | 0.34 (0.09 to 1.26) | Very low‡,§§ | 0.34 (0.09 to 1.26) | Very low§§ | ||
| Everolimus + SSA vs surufatinib | 0.35 (0.06 to 2.18) | Very low|,¶,§§ | 0.35 (0.06 to 2.18) | Very low§§ | ||
| Interferon vs interferon + SSA | 1.20 (0.38 to 3.81) | Very low**,‡,§§ | 1.20 (0.38 to 3.81) | Very low§§ | ||
| Interferon vs placebo | 0.27 (0.07 to 1.10) | Very low|||,¶,§§ | 0.27 (0.07 to 1.10) | Very low§§ | ||
| Interferon vs SSA | 0.80 (0.25 to 2.51) | Very low**,‡,§§ | 0.80 (0.25 to 2.51) | Very low§§ | ||
| Interferon vs surufatinib | 0.83 (0.15 to 4.55) | Very low|||,¶,§§ | 0.83 (0.15 to 4.55) | Very low§§ | ||
| Interferon + SSA vs placebo | 0.23 (0.06 to 0.93) | Very low|||,¶,§ | 0.23 (0.06 to 0.93) | Very low§ | ||
| Interferon + SSA vs SSA | 0.66 (0.21 to 2.14) | Very low**,‡,§§ | 0.66 (0.21 to 2.14) | Very low§§ | ||
| Interferon + SSA vs surufatinib | 0.69 (0.12 to 3.85) | Very low|||,¶,§§ | 0.69 (0.12 to 3.85) | Very low§§ | ||
| Placebo vs SSA | 2.90 (1.32 to 6.38) | High | 2.90 (1.32 to 6.38) | High | ||
| Placebo vs surufatinib | 3.03 (1.14 to 8.07) | Moderate‡ | 3.03 (1.14 to 8.07) | Moderate | ||
| SSA vs surufatinib | 1.04 (0.30 to 3.66) | Very low|,§§ | 1.04 (0.30 to 3.66) | Very low§§ |
The confidence assessment addressed *risk of bias, †inconsistency, ‡indirectness, §imprecision, and #incoherence. Indirect estimates were potentially rated down for intransitivity.
Severe limitations are indicated by two symbols. Contributing direct evidence was of |moderate, ||low or |||very low quality.
Abbreviations: SSA: somatostatin analogues; Lu: Lutetium; CI: confidence interval
Disease control, progression‐free survival, and overall survival
Twelve RCTs (Castellano 2013; Faiss 2003; Kulke 2017 (1); Pavel 2011; Raymond 2011 (1); Rinke 2009; Salazar 2018; Strosberg 2017; Xu 2020 (ep); Xu 2020 (p); Yao 2008 (1); Yao 2011) reported data on disease control and progression‐free survival (Figure 8). Moreover, 13 RCTs (Arnold 2005; Bergsland 2020; Kulke 2016; Lepage 2020; Meyer 2014; Moertel 1980; Moertel 1992; Raymond 2011 (1); Rinke 2009; Van Der Zwan 2018; Yao 2011; Yao 2017; Zhang 2020) reported data on overall survival (Table 13) and five RCTs reported both progression‐free survival and overall survival (Kulke 2016; Raymond 2011 (1); Rinke 2009; Yao 2011; Yao 2017). In each of these RCTs, superiority of a therapy regarding progression‐free survival was associated with non‐inferiority regarding overall survival.
8.

Ranking of treatment efficacies for disease control and progression‐free survival. Plot of treatment efficacies in pancreatic neuroendocrine tumors (pNET, A) and gastrointestinal neuroendocrine tumors (GI‐NET, B). Data are expressed as P‐scores, measuring the extent of certainty that one therapy is better than another, averaged over all competing therapies. Black nodes are combination therapies with somatostatin analogues (SSA). Due to a lack of P‐scores for disease control and progression‐free survival, everolimus plus bevacizumab plus somatostatin analogue in pNET and streptozocin plus 5‐FU in GI‐NET are not depicted.
9. Overall survival in months according to the treatment.
| Placebo | Sunitinib | Everolimus | Everolimus + SSA | Everolimus + bevacizumab + SSA | Interferon + SSA | SSA | Streptozocin | Streptozocin + 5‐FU | Streptozocin + doxorubicin | Chlorozotocin | Capecitabine + streptozocin + cisplatin | Capecitabene + streptozocin | Pazopanib | Bevacizumab + SSA | 177‐Lu‐DOTATATE | 177‐Lu‐DOTATATE + capecitabine | Interferon + SSA | Etoposide + cisplatin | Irinotecan + cisplatin | |
| Arnold 2005 | 51 | 35 | ||||||||||||||||||
| Bergsland 2020 | 42 | 41 | ||||||||||||||||||
| Kulke 2016 | 35 | 36.7 | ||||||||||||||||||
| Lepage 2020 | 41.9 | not reached | ||||||||||||||||||
| Meyer 2014 | 27.5 | 26.7 | ||||||||||||||||||
| Moertel 1980 | 16.5 | 26 | ||||||||||||||||||
| Moertel 1992 | 16.8 | 26.4 | 18 | |||||||||||||||||
| Pavel 2011 | 29.2 (23.8 to 35.9) | 35.2 (30.0 to 44.7) | ||||||||||||||||||
| Raymond 2011 (1) | 29.1 (16.4 to 36.8) | 38.6 (25.6 to 56.4) | ||||||||||||||||||
| Rinke 2009 | 83.7 | 84.7 | ||||||||||||||||||
| Van Der Zwan 2018 | 64.6 (39.7 to 89.4) | 75.8 (54.3 to 97.2) | ||||||||||||||||||
| Yao 2011 | 37.7 (29.1 to 45.8) | 44.0 (35.6 to 51.8) | ||||||||||||||||||
| Yao 2017 | 35.2 (33.1 to 42.8) | 47.3 (35.8 to 52.6) | ||||||||||||||||||
| Zhang 2020 | 11.3 | 10.2 |
Values represent the median survival (95% confidence interval).
Quality of life and safety
Nine RCTs (Arnold 2005; Caplin 2014; Kulke 2017 (2); Meyer 2014; Raymond 2011 (1); Rinke 2009; Vinik 2016; Xu 2020 (ep); Xu 2020 (p)) quantified changes for eight different therapies with the Quality of Life Questionnaire C30 of the European Organization for Research and Treatment of Cancer. Of these, telotristat had the greatest effect on improving quality of life, followed by somatostatin analogues (Table 14).
10. Changes in quality of life during treatment based on EORTC QLQ‐30.
| Placebo | SSA | Interferon + SSA | Telotristat | Capecitabine + Streptozocin | Capecitabine + Streptozocin + Cisplatin | Sunitinib | Surufatinib | |
| Arnold 2005 | 11.4 ± 18.6 | ‐6.4 ± 18.6 | ||||||
| Caplin 2014 | ‐4.87 ± 3.7 | ‐5.18 ± 3.73 | ||||||
| Kulke 2017 (2) | 8.5 | 21.6 | ||||||
| Meyer 2014 | 2.2 | ‐3.8 | ||||||
| Raymond 2011 (1) | ‐2.7 | ‐4.6 | ||||||
| Rinke 2009 | ‐2.1 ± 15.8 | 0.0 ± 18.5 | ||||||
| Vinik 2016 | 1.2 ± 2.6 | 5.3 ± 2.1 | ||||||
| Xu 2020 (ep) | ‐6.43 ± 2.61 | ‐9.97 ± 1.87 | ||||||
| Xu 2020 (p) | ‐11.2 ± 2.6 | ‐8.8 ± 1.9 |
Furthermore, 17 RCTs (Caplin 2014; Kölby 2003; Kulke 2017 (1); Maire 2012; Meyer 2014; Moertel 1992; Pavel 2011; Raymond 2011 (1); Salazar 2018; Strosberg 2017; Vinik 2016; Wolin 2015; Xu 2020 (ep); Xu 2020 (p); Yao 2011; Yao 2016; Zhang 2020) reported frequencies of adverse events for 17 different therapies, of which tyrosine kinase inhibitors showed the highest number of grade 1 to 4 adverse events per patient and streptozocin + 5‐FU (fluorouracil) the highest number of serious (grade 3 or 4) adverse events per patient. Interferon plus somatostatin analogues showed the lowest number of grade 1 to 4 and the lowest number of serious adverse events per patient (Table 15).
11. Number of adverse events according to the treatment.
| Treatment | Patients, no. | Grade 3 or 4 (total no.)1 | All grades (total no.) | Sources |
| 177‐Lu‐DOTATATE + octreotide | 111 | 10 | 95 | Strosberg 2017 |
| Capecitabine + streptozocin | 43 | 33 | 195 | Meyer 2014 |
| Capecitabine + streptozocin + cisplatin | 40 | 67 | 302 | Meyer 2014 |
| Chlorozotocin | 51 | 29 | 198 | Moertel 1992 |
| Dactolisib | 31 | 39 | 220 | Salazar 2018 |
| Doxorubicin + streptozocin | 44 | 29 | 202 | Moertel 1992 |
| Etoposide + cisplatin | 33 | 29 | 69 | Zhang 2020 |
| Everolimus | 518 | 219 | 2095 | Kulke 2017 (1), Salazar 2018, Yao 2011, Yao 2016 |
| Everolimus + SSA | 293 | 149 | 975 | Kulke 2017 (1), Pavel 2011 |
| Hepatic arterial chemoembolisation | 12 | 3 | 15 | Maire 2012 |
| Hepatic arterial embolisation | 14 | 2 | 12 | Maire 2012 |
| Interferon + SSA | 33 | 1 | 7 | Kölby 2003 |
| Irinotecan + cisplatin | 33 | 15 | 62 | Zhang 2020 |
| Placebo | 670 | 107 | 1300 | Caplin 2014, Raymond 2011 (1), Vinik 2016, Xu 2020 (ep), Xu 2020 (p), Yao 2011, Yao 2016 |
| SSA | 610 | 38 | 389 | Caplin 2014, Kölby 2003, Pavel 2011, Strosberg 2017, Vinik 2016, Wolin 2015 |
| Streptozocin + 5‐FU | 42 | 86 | 271 | Moertel 1992 |
| Tyrosine kinase inhibitors | 331 | 317 | 2590 | Raymond 2011 (1), Xu 2020 (ep), Xu 2020 (p) |
1Adverse events were classified according to the National Cancer Institute Common Terminology Criteria for Adverse Events: grade 1, mild; grade 2, moderate; grade 3, severe or medically significant; and grade 4, life‐threatening.
Discussion
Summary of main results
Everolimus was the most effective therapy in pNET with the highest certainty of evidence compared to the other treatments. Otherwise, the results suggest a superiority of combination therapies including somatostatin analogues. In pNETs, somatostatin analogues plus interferon, everolimus, or bevacizumab were highly efficacious. The certainty of evidence for these therapies was variable and was the highest for somatostatin analogues plus everolimus. In GI‐NETs, somatostatin analogues plus 177‐Lu‐DOTATATE, bevacizumab, everolimus, or interferon were highly efficacious. The certainty of evidence for these therapies was very low.
Furthermore, the results suggest a range of monotherapies that are superior to placebo, including interferon and sunitinib besides everolimus in pNETs, and surufatinib and somatostatin analogues in pNETs and GI‐NETs. Conversely, the results did not demonstrate efficacy superior to that of placebo for dactolisib in pNETs or for streptozocin + 5‐FU in GI‐NETs. The highest quality of evidence was available for everolimus and surufatinib in pNETs.
The results indicate that NET therapies have a broad range of risk for adverse events and effects on quality of life. Because systemic treatment is commonly noncurative for NETs, adverse events and quality of life are priorities.
Overall completeness and applicability of evidence
All relevant drug therapies for neuroendocrine tumours have been considered in this systematic review. However, there is insufficient precision of treatment effects for the following therapies: dactolisib, interferon and sunitinib in pNET, and 177‐Lu‐DOTATATE + SSA, bevacizumab + SSA, everolimus, everolimus + SSA, interferon, interferon + SSA and streptozocin + 5‐FU in GI‐NET.
We considered all available patient‐relevant outcomes in our review (disease control, progression‐free survival, overall survival, occurrence of adverse events and quality of life). However, we did not find a benefit in terms of overall survival for the included therapies, although we found a correlation of overall survival with progression‐free survival. Quality of life was rarely and inconsistently reported for included trials, which compromises the evidence‐base for decision‐making. Therefore, evidence from this network meta‐analysis (and underlying RCTs) does not support any particular therapy (or combinations of therapies) with respect to patient‐centred outcomes (e.g. overall survival and quality of life). It should be consistently considered as a specified outcome in future trials on the topic.
The people enrolled in included RCTs appeared representative of all people with neuroendocrine tumours treated in high‐income countries.
Our search for eligible trials was comprehensive including several electronic databases, trial registries, handsearching of conference proceedings, and contacts with experts in the field. Therefore, we deem it unlikely that we have missed relevant trials.
The results of this review are applicable to people with pNET or GI‐NET.
Quality of the evidence
When using the available information for therapeutic decisions in treatment of NETs, we propose to consider the following points regarding indirectness, transitivity, risk of bias, inconsistency, incoherence, and imprecision. First, meta‐analyses are based on the assumption of directness, in which populations, therapies, and outcomes of included studies are aligned with population, therapies, and outcomes targeted by the meta‐analysis. Our meta‐analysis targeted all available therapies and included only studies reporting disease control and/or progression‐free survival. Both factors ensured a certain degree of directness. Yet, indirectness was introduced by RCTs including mixed populations of people with pNETs and GI‐NETs. We highlight all comparisons that were affected by indirectness (Table 7; Table 8; Table 11; Table 12) to allow incorporation of this fact into clinical decision‐making.
Second, network meta‐analyses are also based on the assumption of transitivity, in which the included studies are similar enough to build a network. In this study, the moderate differences in study populations and trial methodologies resulted in a network with moderate overall transitivity. The different types of interferons and somatostatin analogues introduced intransitivity for the loop of comparisons of interferon, somatostatin analogues, and their combination, but had no association with the certainty of evidence for the rest of the network.
Third, some RCTs had a high risk of bias due to absent blinding, including an RCT evaluating everolimus (Kulke 2017 (1)), the most efficacious therapy in pNETs, and two others evaluating interferon plus a somatostatin analogue in GI‐NETs (Faiss 2003; Kölby 2003). Absent blinding has been shown to be associated with an average exaggeration of estimated therapeutic effects of approximately 9% (Pildal 2008). However, the therapeutic effect for the three aforementioned therapies compared with placebo substantially exceeds 9% and they most likely represent the superior therapies in GI‐NETs, although the extent of superiority needs to be interpreted with caution.
Fourth, consistency describes the agreement between estimates of different studies for a specific comparison, while coherence describes agreement between direct and indirect estimates for a specific comparison. Owing to the relatively low number of RCTs, the assessment of incoherence and inconsistency was limited. We identified two comparisons in which indirect and direct estimates differed considerably comparing interferon plus a somatostatin analogue with somatostatin analogues and bevacizumab plus somatostatin analogues, without being statistically significant. Furthermore, we identified two cases of inconsistency comparing interferon with somatostatin analogues and interferon plus somatostatin analogues (Table 7; Table 8; Table 11; Table 12). Likely owing to different types of somatostatin analogues and interferons, the RCTs found different effects regarding disease control and progression‐free survival.
Fifth, the low number of RCTs compared with the number of interventions introduced imprecision to several comparisons, manifesting as wide 95% CIs that included or were close to a null effect. A statistically significant effect does not automatically represent a clinically relevant effect, and the consequence of imprecision is that wide 95% CIs might include significant but clinically irrelevant effects. As clinical relevance often depends on an individual patient's situation, we highlighted all comparisons that were affected by imprecision (Table 7; Table 8; Table 11; Table 12) to allow incorporation of this fact into clinical decision‐making. We used the GRADE system to assess the confidence in effect estimates for all comparisons, depending on indirectness, transitivity, risk of bias, inconsistency, incoherence, and imprecision. We incorporated the certainty of evidence in the main results of our analysis to highlight the most robust findings for further use in clinical judgement.
Sixth, we used the endpoints disease control and progression‐free survival for all network analyses, instead of overall survival. Although overall survival is arguably the most relevant clinical endpoint, it is used less frequently than disease control and progression‐free survival because it requires a larger number of patients and longer follow‐up. Cross‐over trial design might obscure conclusions about survival by underestimating the overall survival benefit in a intention‐to‐treat analysis. Overall survival might be confounded by the effect of salvage therapies used after disease progression (Saad 2016). In NETs, progression‐free survival has been shown to be well correlated with overall survival (Imaoka 2017), and the RCTs included in the present study revealed the same correlation. Using disease control and progression‐free survival instead of overall survival in this study allowed us to include more therapies into the network meta‐analyses, which we believe represents the preferred approach.
Furthermore, 18/22 studies included in the network analysis were industry‐sponsored, which generally demonstrates exaggerated clinical benefits compared to the clinical benefits observed in real‐world populations
Potential biases in the review process
We conducted a comprehensive literature search with a sensitive search algorithm and an extensive manual search of reference lists and conference proceedings. We therefore consider it unlikely that we missed relevant RCTs. However, we could not obtain additional unpublished data and are aware that a substantial amount of information is not available to the public. Thus, we cannot rule out publication bias.
Agreements and disagreements with other studies or reviews
The present study is in agreement with the findings of our previous systematic review and network meta‐analysis on therapeutic options for neuroendocrine tumours (Kaderli 2019). Due to the updated literature search, 46 additional records related to 17 new studies were included in the qualitative analysis and six additional RCTs were included in the quantitative analysis. In the updated quantitative analysis, surufatinib was included in the network meta‐analysis for disease control and progression‐free survival for pNET and GI‐NET and bevacizumab plus a somatostatin analogue in the network meta‐analysis for progression‐free survival in pNET. In the updated quantitative analysis, everolimus was the most effective treatment in pNET with respect to both disease control and progression‐free survival.
The present study is also in agreement with clinical practice. Dactolisib ranked lower than placebo regarding disease control in pNET, while streptozocin + 5‐FU ranked lower than placebo regarding disease control in GI‐NET. The clinical development of dactolisib in neuroendocrine tumours was halted, while streptozocin + 5‐FU remains reserved for advanced NET in the clinical setting.
Authors' conclusions
Implications for practice.
Clinical decisions should be based on the best available evidence. The present results provide a comprehensive overview of the existing evidence on NET therapies as well as the best possible comparison of therapies that have not been directly compared in RCTs. Using this approach, the certainty of evidence is incorporated into the results to assist in decision‐making. Safety and efficacy results should both be incorporated into the treatment decision, while in addition the safety results may aid in the decision to establish preventive measures and increase the surveillance for known toxic effects.
However, based on the evidence presented in this review, the results do not allow us to suggest a fixed sequence of therapies or therapy modalities for people with GI‐NET and pNET in the course of disease.
Implications for research.
The present results may guide future research by highlighting necessary head‐to‐head comparisons and facilitating their trial design. Specifically, bevacizumab plus a somatostatin analogue, dactolisib, everolimus plus bevacizumab plus a somatostatin analogue, sunitinib and surufatinib have only been compared with one other active therapy in pNET to date, while bevacizumab plus a somatostatin analogue, everolimus, everolimus plus a somatostatin analogue, surufatinib, streptozocin plus fluorouracil and 177‐Lu‐DOTATATE plus a somatostatin analogue have only been compared with one other active therapy in GI‐NETs.
Sunitinib and everolimus have been compared only with placebo in pNETs and GI‐NETs respectively and, to our knowledge, head‐to‐head comparisons with active therapies in RCTs have not yet been performed. When designing such head‐to‐head comparisons, the estimated associations from our network meta‐analysis can help to select the reference therapy and approximate the required patient numbers. Particularly, because the present results identified eight therapies in pNETs and 6 therapies in GI‐NETs with higher efficacy than placebo, comparisons with placebo as a reference are discouraged for the future. Because of their proven efficacy and central role in current comparisons, somatostatin analogues represent the logical reference compound for further RCTs. Moreover, the quality assessment of currently available RCTs revealed that further studies should incorporate blinding to avoid overestimation of effects and improve the overall quality of evidence in the field.
In addition, this study demonstrates the need for more research in assessing adverse events and effects on quality of life for NET therapies.
Finally, an important research topic would be a randomised evaluation of different sequences of therapies and therapy modalities in order to determine whether certain therapy modalities (i.e. 177‐Lu‐DOTATATE) are more efficient early or late in the course of disease .
History
Protocol first published: Issue 8, 2020
Acknowledgements
We would like to thank the following members of Cochrane Gynaecological, Neuro‐oncology and Orphan Cancers (GNOC): Jo Morrison (Co‐ordinating Editor) for clinical advice; Gail Quinn (Managing Editor) and Tracey Harrison (Assistant Manging Editor) for editorial assistance.
Cochrane Switzerland assisted with the electronic libraries search.
This project was supported by the National Institute for Health Research (NIHR), via Cochrane infrastructure funding to the Cochrane Gynaecological, Neuro‐oncology and Orphan Cancers Group. The views and opinions expressed therein are those of the review authors and do not necessarily reflect those of the Systematic Reviews Programme, NIHR, NHS, or the Department of Health.
The authors and GNOC, are grateful to the following peer reviewers for their time and comments: Helen Bulbeck and Alysia De Nino.
Appendices
Appendix 1. Search strategy for the Cochrane Central Register of Controlled Trials
| ([mh "Neuroendocrine Tumors"] or [mh "Adenoma, Acidophil"] or [mh "Adenoma, Basophil"] or [mh "Adenoma, Chromophobe"] or [mh Apudoma] or [mh "Carcinoid Tumor"] or [mh "Malignant Carcinoid Syndrome"] or [mh "Carcinoma, Neuroendocrine"] or [mh "Carcinoma, Medullary"] or [mh "Carcinoma, Merkel Cell"] or [mh Somatostatinoma] or [mh Vipoma] or [mh Neurilemmoma] or [mh Paraganglioma]) and [mh "Gastrointestinal Neoplasms"]) OR (((Gastroenteropancreatic or Gastro‐enteric pancreatic or Gastro‐entero‐pancreatic or pancreas or pancreatic) and (neuroendocrine and (tumor* or tumour* or neoplasm* or carcinoma*))) or GEPNET* or GEP‐NET* or GEPNEC* or GEP‐NEC* | |
| Therapy search filter | therapy or "diet therapy" or "drug therapy" or radiotherapy or surgery or segmentectomy or resection or debulk* or cryoablat* or cryosurger* or radioablat* or radiofrequency ablat* or radio‐frequency ablat* or RFablat* or thermoablat* or Cryosurgery or Hepatectomy or "Liver transplant*" or "local ablat*" or "transarterial embolization" or "transarterial embolisation" or "transarterial chemoembolization" or "transarterial chemoembolisation" or radioembolization or radioembolisation or somatostatin or chemotherapy or chemotherapies or "peptide receptor radiotherapy" or "targeted molecular therapy" or radiopeptide or DOTATOC or DOTATATE or PRRT |
Appendix 2. Search strategy for MEDLINE (Ovid)
| ("Neuroendocrine Tumors"[Mesh:NoExp] OR "Adenoma, Acidophil"[Mesh] OR "Adenoma, Basophil"[Mesh] OR "Adenoma, Chromophobe"[Mesh] OR "Apudoma"[Mesh] OR "Carcinoid Tumor"[Mesh] OR "Malignant Carcinoid Syndrome"[Mesh] OR "Carcinoma, Neuroendocrine"[Mesh] OR "Carcinoma, Medullary"[Mesh] OR "Carcinoma, Merkel Cell"[Mesh] OR "Somatostatinoma"[Mesh] OR "Vipoma"[Mesh] OR "Neurilemmoma"[Mesh] OR "Paraganglioma"[Mesh]) AND "Gastrointestinal Neoplasms"[Mesh]) OR ("Pancreatic Neoplasms"[Mesh:NoExp] AND neuroendocrine[tiab]) OR "Adenoma, Islet Cell"[Mesh] OR "Insulinoma"[Mesh] OR "Carcinoma, Islet Cell"[Mesh] OR "Gastrinoma"[Mesh] OR "Glucagonoma"[Mesh] OR ((gastroenteropancreatic OR gastro‐enteric pancreatic OR gastro‐entero‐pancreatic OR pancreas OR pancreatic) AND (neuroendocrine AND (tumor OR tumors OR tumour OR tumours OR neoplasm OR neoplasms OR carcinoma OR carcinomas)) OR GEPNET* OR GEP‐NET* OR GEPNEC* OR GEP‐NEC* | |
| Therapy search filter | therapy[sh] OR "diet therapy"[sh] OR "drug therapy"[sh] OR radiotherapy[sh] OR surgery[sh] OR segmentectomy OR resection OR debulk* OR cryoablat* OR cryosurger* OR radioablat* OR radiofrequency ablat* OR radio‐frequency ablat* OR RFablat* OR thermoablat* OR "Cryosurgery"[Mesh] OR "Hepatectomy"[MeSH] OR Liver transplant OR local ablat* OR transarterial embolization OR transarterial embolisation OR transarterial chemoembolization OR transarterial chemoembolisation OR radioembolization OR radioembolisation OR somatostatin OR chemotherapy OR chemotherapies OR peptide receptor radiotherapy OR targeted molecular therapy OR radiopeptide OR DOTATOC OR DOTATATE OR PRRT |
| Study design filter | randomized controlled trial[pt] OR controlled clinical trial[pt] OR randomized[tiab] OR placebo[tiab] OR "drug therapy"[sh] OR randomly[tiab] OR trial[tiab] OR groups[tiab]) NOT ("animals"[mh] NOT ("humans"[mh] AND "animals"[mh]) |
Appendix 3. Search strategy for Embase.com
| (('neuroendocrine tumor'/de OR 'gastroenteropancreatic neuroendocrine tumor'/de OR (adenoma NEAR/3 acidophil*):ti,ab OR (adenoma NEAR/3 basophil):ti,ab OR 'chromophobe adenoma'/de OR 'apudoma'/de OR 'carcinoid'/de OR 'carcinoid syndrome'/de OR (carcinoma NEAR/3 neuroendocrine):ti,ab OR 'medullary carcinoma'/de OR 'merkel cell carcinoma'/de OR 'somatostatinoma'/de OR 'vipoma'/de OR 'neurilemoma'/de OR 'paraganglioma'/de) AND ('gastrointestinal tumor'/de OR 'gastrointestinal stromal tumor'/de OR 'intestine tumor'/exp OR 'pancreas tumor'/exp OR 'stomach tumor'/exp)) or ('pancreas islet cell tumor'/de OR 'glucagonoma'/de OR 'insulinoma'/de OR 'pancreas islet cell carcinoma'/de OR 'gastrinoma'/de) OR (((gastroenteropancreatic OR 'gastro‐enteric pancreatic' OR 'gastro‐entero‐pancreatic' OR pancreas OR pancreatic) AND (neuroendocrine AND (tumor* OR tumour* OR neoplasm* OR carcinoma*))) OR GEPNET OR 'GEP‐NET*' OR GEPNEC* OR GEP‐NEC*) | |
| Therapy search filter | ('disease management':lnk OR 'drug therapy':lnk OR 'surgery':lnk OR 'therapy':lnk OR 'radiotherapy':lnk) OR segmentectomy OR resection OR debulk* OR cryoablat* OR cryosurger* OR radioablat* OR 'radiofrequency ablat*' OR 'radio‐frequency ablat*' OR RFablat* OR thermoablat* OR 'cryosurgery'/de OR 'liver resection'/exp OR 'liver transplant' OR 'local ablat*' OR 'transarterial embolization' OR 'transarterial embolisation' OR 'transarterial chemoembolization' OR 'transarterial chemoembolisation' OR radioembolization OR radioembolisation OR somatostatin OR chemotherapy OR chemotherapies OR 'peptide receptor radiotherapy' OR 'targeted molecular therapy' OR radiopeptide or DOTATOC or DOTATATE or PRRT |
| Study design filter | ((random* OR factorial* OR crossover* OR cross NEXT/1 over* OR placebo* OR doubl* NEXT/1 blind* OR singl* NEXT/1 blind* OR assign* OR allocat* OR volunteer*):de,ab,ti OR 'crossover procedure'/exp OR 'double blind procedure'/exp OR 'randomized controlled trial'/exp OR 'single blind procedure'/exp) NOT ('animal'/exp NOT 'human'/exp) |
Characteristics of studies
Characteristics of included studies [ordered by study ID]
Anthony 2012.
| Study characteristics | ||
| Methods | Multicentre (16 countries), double‐blind, phase 3 study 1:1 randomisation by interactive voice response system Study group assignments were masked. Enrolment: January 2007‐April 2010 Subgroup analysis: effect of previous treatment with a long‐acting SSA on PFS in RADIANT‐2 |
|
| Participants | Inclusion criteria
Exclusion criteria
RADIANT‐2 overall population Total patients: 429 Median age (study group 1 vs. study group 2): 60 vs. 60 Women, % (1 vs. 2): 55 vs. 42 WHO performance status 0/1/2, % (1 vs. 2): 55/39/6 vs. 66/29/5 Primary tumour site, %:
Grade (well differentiated/moderately differentiated/poorly differentiated), % (1 vs. 2): 77/18/1 vs. 82/14/1 Liver involvement, % (1 vs. 2): 92 vs. 92 Previous SSA treatment, % (1 vs. 2): 80 vs. 78 Previous systemic anti‐tumour drugs, % (1 vs. 2): 46 vs. 38 Chemotherapy, % (1 vs. 2): 35 vs. 26 Immunotherapy, % (1 vs. 2): 13 vs. 9 Targeted therapy, % (1 vs. 2): 7 vs. 8 Other, % (1 vs. 2): 10 vs. 13 Prior SSA treatment subgroup Total patients: 429 Previous SSA treatment, % (1 vs. 2): 80 vs. 78
SSA naive, % (1 vs. 2): 20 vs. 22
|
|
| Interventions | Study group 1 (RADIANT‐2 overall: 216/429, prior SSA treatment subgroup: 173/339, SSA‐naive group: 43/90): 10 mg oral everolimus once daily plus intramuscular 30 mg octreotide LAR every 28 days Study group 2 (RADIANT‐2 overall: 213/429, prior SSA treatment subgroup: 166/339, SSA‐naive group: 47/90): matching placebo plus intramuscular 30 mg octreotide LAR every 28 days Treatment duration: until disease progression, withdrawal from treatment because of adverse events, or withdrawal of consent After disease progression in the placebo plus octreotide LAR group, cross over to open‐label everolimus plus octreotide LAR was permitted. |
|
| Outcomes | Primary endpoint:
Secondary endpoints:
Supportive endpoint:
Assessments:
|
|
| Notes | Novartis funded the study and was involved in the study design, data collection and statistical analysis. | |
| Risk of bias | ||
| Bias | Authors' judgement | Support for judgement |
| Random sequence generation (selection bias) | Unclear risk | No information about sequence generation |
| Allocation concealment (selection bias) | Low risk | Allocation was performed centrally. |
| Blinding of participants and personnel (performance bias) All outcomes | Low risk | Double‐blinded trial |
| Blinding of outcome assessment (detection bias) All outcomes | Low risk | Central review for primary analysis of progression‐free survival by an independent, masked committee |
| Incomplete outcome data (attrition bias) All outcomes | Low risk | All randomised patients accounted for efficacy analysis according to the intention‐to‐treat principle. |
| Selective reporting (reporting bias) | Low risk | Except for one secondary endpoint, every endpoint stated in the study protocol was reported in the publication. |
| Other bias | Low risk | No other potential sources of bias found |
Arnold 2005.
| Study characteristics | ||
| Methods | Randomisation was performed by phone at the study centre and done by computer by using the method of random permuted blocks stratified by carcinoid syndrome versus other tumour entities, age ≤ 65 years versus > 65 years, luminal tumours (midgut tumours and duodenal tumours) versus non‐luminal (pancreatic) tumours, prior chemotherapy and prior octreotide treatment. Enrolment: January 1995‐March 1998 Follow‐up investigations were performed until April 2004. |
|
| Participants | Inclusion criteria
Exclusion criteria
Total randomised patients: 109 Total evaluable patients: 105 Age (study arm 1 vs. study arm 2): 58 vs. 57 Women, % (1 vs. 2): 47 vs. 44 Prior treatment, %:
Primary tumour site, %:
Nonfunctioning tumours, % (1 vs. 2): 53 vs. 56 |
|
| Interventions | Study arm 1 (51/105): 200 μg octreotide, thrice daily, subcutaneous injection Study arm 2 (54/105): 200 μg octreotide, thrice daily, subcutaneous injection plus 4.5 × 10⁶ IU interferon‐alpha thrice weekly Treatment duration: until CT or MRI documented tumour progression Additional antiproliferative therapy was not allowed. |
|
| Outcomes | Primary endpoint:
Secondary endpoints:
Assessments:
|
|
| Notes | Novartis Pharma and Roche Pharma participated in the development of the study design and provided funding. | |
| Risk of bias | ||
| Bias | Authors' judgement | Support for judgement |
| Random sequence generation (selection bias) | Low risk | Stratified randomisation was done by computer by using the method of random permuted blocks. |
| Allocation concealment (selection bias) | Low risk | Allocation was performed centrally. |
| Blinding of participants and personnel (performance bias) All outcomes | High risk | Study treatment was not blinded. |
| Blinding of outcome assessment (detection bias) All outcomes | Unclear risk | CT or MRI scans were evaluated by one of the authors in a blinded fashion, but not by independent personnel. |
| Incomplete outcome data (attrition bias) All outcomes | Unclear risk | Biochemical response was evaluated only in one centre. 109 patients were randomised but only 105 were evaluable. |
| Selective reporting (reporting bias) | Low risk | No study protocol available, but all endpoints were reported. |
| Other bias | Low risk | No other potential sources of bias found |
Bergsland 2020.
| Study characteristics | ||
| Methods | Multicentre, randomised, double‐blind, phase II study | |
| Participants | Inclusion criteria
Total patients: 171 Median age (overall): 63 Women (overall): 56% Small bowel primary (overall): 66% Concurrent SSA treatment (overall): 87% |
|
| Interventions | Intervention group (97/171): pazopanib, 800 mg/day, oral intake Control group (74/171): placebo Concurrent SSA allowed if previous progressive disease on SSA was documented. Cross‐over was allowed if progressive disease was confirmed by central review. |
|
| Outcomes | Primary endpoint:
Secondary endpoints:
|
|
| Notes | ||
| Risk of bias | ||
| Bias | Authors' judgement | Support for judgement |
| Random sequence generation (selection bias) | Unclear risk | No information given |
| Allocation concealment (selection bias) | Low risk | No information given |
| Blinding of participants and personnel (performance bias) All outcomes | Unclear risk | No information given |
| Blinding of outcome assessment (detection bias) All outcomes | Unclear risk | Central review was mentioned, but it remained unclear, when and how it was performed. |
| Incomplete outcome data (attrition bias) All outcomes | Unclear risk | No information given |
| Selective reporting (reporting bias) | Unclear risk | One secondary endpoint (objective response rate) was not reported. |
| Other bias | Low risk | No other potential sources of bias found |
Caplin 2014.
| Study characteristics | ||
| Methods | Randomised, double‐blind, placebo‐controlled, parallel‐group, multicentre, phase 3 study
Duration: 96 weeks Computer‐generated randomisation, stratified by presence or absence of tumour progression at baseline and receipt or nonreceipt of previous therapies Conducted between June 2006 and April 2013 |
|
| Participants | Inclusion criteria
Exclusion criteria
Withdrawal
Total patients: 204 Age (lanreotide vs. placebo): 63 vs. 62 Women, % (lanreotide vs. placebo): 48 vs. 48 Prior treatment for neuroendocrine tumour, % (lanreotide vs. placebo): 16 vs. 16 Primary tumour resected, % (lanreotide vs. placebo): 40 vs. 38 Origin of tumour:
Ki‐67 index, 0‐2%/3‐10%, % (lanreotide vs. placebo): 68/32 vs. 70/28 Hepatic tumour volume:
|
|
| Interventions | Intervention group (101/204): extended‐release aqueous‐gel formulation of lanreotide, 120 mg, without dose adjustment, deep subcutaneous injection, every 28 days to a maximum of 24 injections Control group (103/204): placebo (sodium chloride), deep subcutaneous injection, every 28 days to a maximum of 24 injections In case of disease progression while receiving placebo, patients crossed over to lanreotide. |
|
| Outcomes | Primary endpoint:
Secondary endpoints:
Exploratory endpoints:
Assessments:
|
|
| Notes | The study was designed, funded, and conducted by Ipsen in collaboration with the European Neuroendocrine Tumor Society and the UK and Ireland Neuroendocrine Tumour Society. | |
| Risk of bias | ||
| Bias | Authors' judgement | Support for judgement |
| Random sequence generation (selection bias) | Low risk | Computer‐generated randomisation lists were created by a statistician employed by the sponsor who was independent of the study. |
| Allocation concealment (selection bias) | Low risk | The blinded database was held at a third‐party contract clinical research organisation. |
| Blinding of participants and personnel (performance bias) All outcomes | Low risk | Double‐blinded study design. Independent health professionals prepared and administered injections. |
| Blinding of outcome assessment (detection bias) All outcomes | Unclear risk | Disease progression was assessed centrally, but it remained unclear whether it was performed by independent personnel. |
| Incomplete outcome data (attrition bias) All outcomes | Low risk | All randomised patients accounted for in ITT analysis |
| Selective reporting (reporting bias) | Low risk | Study protocol available. One secondary endpoint mentioned in the protocol was not reported as a endpoint in the publication, but was reported in the supplementary appendix. |
| Other bias | Low risk | No other potential sources of bias found |
Castellano 2013.
| Study characteristics | ||
| Methods | Multicentre (16 countries), double‐blind, phase 3 study 1:1 randomisation by interactive voice response system Study group assignments were masked. Enrolment: January 2007‐April 2010 Subgroup analysis: to assess the efficacy and safety of everolimus plus octreotide LAR in patients with colorectal primary NETs |
|
| Participants | Inclusion criteria
Exclusion criteria
RADIANT‐2 overall population Total patients: 429 Median age (study group 1 vs. study group 2): 60 vs. 60 Women, % (1 vs. 2): 55 vs. 42 WHO performance status 0/1/2, % (1 vs. 2): 55/39/6 vs. 66/29/5 Primary tumour site, %:
Grade (well differentiated/moderately differentiated/poorly differentiated), % (1 vs. 2): 77/18/1 vs. 82/14/1 Liver involvement, % (1 vs. 2): 92 vs. 92 Previous SSA treatment, % (1 vs. 2): 80 vs. 78 Previous systemic anti‐tumour drugs, % (1 vs. 2): 46 vs. 38 Chemotherapy, % (1 vs. 2): 35 vs. 26 Immunotherapy, % (1 vs. 2): 13 vs. 9 Targeted therapy, % (1 vs. 2): 7 vs. 8 Other, % (1 vs. 2): 10 vs. 13 Colorectal NET subgroup Total patients: 39 Age < 65 years, % (study group 1 vs. study group 2): 79 vs. 70 Women, % (1 vs. 2): 58 vs. 40 WHO performance status 0/1/2, % (1 vs. 2): 58/32/11 vs. 60/30/10 Grade (well differentiated/moderately differentiated/poorly differentiated), % (1 vs. 2): 74/11/0 vs. 60/40/0 Previous SSA treatment, % (1 vs. 2): 68 vs. 90 Previous chemotherapy, % (1 vs. 2): 37 vs. 45 |
|
| Interventions | Study group 1 (RADIANT‐2 overall: 216/429, colorectal NET subgroup: 19/39): 10 mg oral everolimus once daily plus intramuscular 30 mg octreotide LAR every 28 days Study group 2 (RADIANT‐2 overall: 213/429, colorectal NET subgroup: 20/39): matching placebo plus intramuscular 30 mg octreotide LAR every 28 days Treatment duration: until disease progression, withdrawal from treatment because of adverse events, or withdrawal of consent After disease progression in the placebo plus octreotide LAR group, cross‐over to open‐label everolimus plus octreotide LAR was permitted. |
|
| Outcomes | Primary endpoint:
Secondary endpoints:
Supportive endpoint:
Assessments:
|
|
| Notes | Novartis funded the study and was involved in the study design, data collection and statistical analysis. | |
| Risk of bias | ||
| Bias | Authors' judgement | Support for judgement |
| Random sequence generation (selection bias) | Unclear risk | No information about sequence generation |
| Allocation concealment (selection bias) | Low risk | Allocation was performed centrally. |
| Blinding of participants and personnel (performance bias) All outcomes | Low risk | Double‐blinded trial |
| Blinding of outcome assessment (detection bias) All outcomes | Low risk | Central review for primary analysis of progression‐free survival by an independent, masked committee |
| Incomplete outcome data (attrition bias) All outcomes | Low risk | All randomised patients accounted for efficacy analysis according to the intention to treat principle. |
| Selective reporting (reporting bias) | Low risk | Except for one secondary endpoint, every endpoint stated in the study protocol was reported in the publication. |
| Other bias | Low risk | No other potential sources of bias found |
Dasari 2015.
| Study characteristics | ||
| Methods | Randomised, double‐blind, placebo‐controlled, parallel‐group, multicentre, phase 3 study
Duration: 96 weeks Computer‐generated randomisation, stratified by presence or absence of tumour progression at baseline and receipt or nonreceipt of previous therapies Conducted between June 2006 and April 2013 |
|
| Participants | Inclusion criteria
Exclusion criteria
Withdrawal
CLARINET overall study population Total patients: 204 Age (lanreotide vs. placebo): 63 vs. 62 Women, % (lanreotide vs. placebo): 48 vs. 48 Prior treatment for neuroendocrine tumour, % (lanreotide vs. placebo): 16 vs. 16 Primary tumour resected, % (lanreotide vs. placebo): 40 vs. 38 Origin of tumour:
Ki‐67 index, 0‐2%/3‐10%, % (lanreotide vs. placebo): 68/32 vs. 70/28 Hepatic tumour volume:
Midgut subgroup analysis Total patients: 73 Mean age: 64 Previous NET surgery: 48% Hepatic tumour volume:
|
|
| Interventions | Intervention group (CLARINET overall: 101/204; midgut subgroup: 33/73): extended‐release aqueous‐gel formulation of lanreotide, 120 mg, without dose adjustment, deep subcutaneous injection, every 28 days to a maximum of 24 injections Control group (CLARINET overall: 103/204; midgut subgroup: 40/73): placebo (sodium chloride), deep subcutaneous injection, every 28 days to a maximum of 24 injections In case of disease progression while receiving placebo, patients crossed over to lanreotide. |
|
| Outcomes | Primary endpoint:
Secondary endpoints:
Exploratory endpoints:
Assessments:
|
|
| Notes | The study was designed, funded, and conducted by Ipsen in collaboration with the European Neuroendocrine Tumor Society and the UK and Ireland Neuroendocrine Tumour Society. | |
| Risk of bias | ||
| Bias | Authors' judgement | Support for judgement |
| Random sequence generation (selection bias) | Low risk | Computer‐generated randomisation lists were created by a statistician employed by the sponsor who was independent of the study. |
| Allocation concealment (selection bias) | Low risk | The blinded database was held at a third‐party contract clinical research organisation. |
| Blinding of participants and personnel (performance bias) All outcomes | Low risk | Double‐blinded study design. Independent health professionals prepared and administered injections. |
| Blinding of outcome assessment (detection bias) All outcomes | Unclear risk | Disease progression was assessed centrally, but it remained unclear whether it was performed by independent personnel. |
| Incomplete outcome data (attrition bias) All outcomes | Low risk | All randomised patients accounted for in ITT analysis |
| Selective reporting (reporting bias) | Low risk | Study protocol available. One secondary endpoint mentioned in the protocol was not reported as an endpoint in the publication, but was reported in the supplementary appendix. |
| Other bias | Low risk | No other potential sources of bias found |
Di Gialleonardo 2020.
| Study characteristics | ||
| Methods | International (11 countries), multicentre, randomised, double‐blind, placebo‐controlled phase 3 companion study (TELECAST) 1:1:1 randomisation stratified by baseline u5‐HIAA levels Enrolment: April 2014 to April 2015 Subgroup analysis: assessment of efficacy and safety of telotristat in the TELECAST study population with 2 or fewer bowel movements per day |
|
| Participants | Inclusion criteria
Exclusion criteria
TELECAST overall population Total patients: 76 Mean age (A vs. B vs. C): 62 vs. 64 vs. 63 Women, % (A vs. B vs. C): 50 vs. 44 vs. 40 SSA therapy at study entry, %:
Subgroup: ≤ 2 bowel movements per day population Total patients: 28 |
|
| Interventions | Study group A (TELECAST overall: 26/76, subgroup: 9/28): placebo, oral doses, three times per day for 12 weeks Study group B (TELECAST overall: 25/76, subgroup: 10/28): telotristat ethyl 250 mg, oral doses, three times per day for 12 weeks Study group C (TELECAST overall: 25/76, subgroup: 9/28): telotristat ethyl 500 mg, oral doses, three times per day for 12 weeks Patients continued to receive their baseline stable‐dose SSA therapy. Rescue short‐acting SSA use was allowed. After the study, all patients were offered treatment with telotristat ethyl 500 mg, three times per day in a 36‐week open‐label extension. |
|
| Outcomes | Primary endpoints:
Secondary endpoints:
Additional endpoint:
Assessments:
|
|
| Notes | Trial supported by Lexicon Pharmaceuticals, Inc. | |
| Risk of bias | ||
| Bias | Authors' judgement | Support for judgement |
| Random sequence generation (selection bias) | Unclear risk | No information given |
| Allocation concealment (selection bias) | Unclear risk | Nearly equal amount of participants per study group |
| Blinding of participants and personnel (performance bias) All outcomes | Low risk | Double‐blind study design |
| Blinding of outcome assessment (detection bias) All outcomes | Unclear risk | The majority of endpoints were self‐reported. |
| Incomplete outcome data (attrition bias) All outcomes | Unclear risk | In the main study, all randomised patients accounted for safety analysis but 10 of 76 (13%) randomised patients were excluded from the u5‐HIAA which was the second primary endpoint. It is not clear, if these patients would have been in this subgroup. |
| Selective reporting (reporting bias) | Low risk | No study protocol available, but every stated endpoint was reported. |
| Other bias | Low risk | No other potential sources of bias found |
Elf 2018.
| Study characteristics | ||
| Methods | Randomised phase II study Start: January 2014 Closed: September 2016 |
|
| Participants | Inclusion criteria
Exclusion criteria
Total patients: 11 Median age (RE vs. HAE): 66.5 vs. 67 Women, % (RE vs. HAE): 67 vs. 80 Primary tumour grade 1, % (RE vs. HAE): 83 vs. 40 Primary tumour grade 2, % (RE vs. HAE): 17 vs. 60 Functional tumours: not reported |
|
| Interventions | RE group (6/11): radioembolisation with bilobar infusion in a standard manner. Protective coil embolisation was used when necessary to prevent non‐target embolisation. The administered activity of 90Y resin microspheres (SIR‐spheres™) was calculated using the partition model. HAE group (5/11): hepatic arterial embolisation was performed by infusion of PVA particles (45–150 μm) until stasis was achieved. The right liver lobe was treated first, embolising the remaining left lobe about 6 weeks later. |
|
| Outcomes | Primary endpoint:
Secondary endpoints:
Assessments:
|
|
| Notes | ||
| Risk of bias | ||
| Bias | Authors' judgement | Support for judgement |
| Random sequence generation (selection bias) | Unclear risk | No information given |
| Allocation concealment (selection bias) | Unclear risk | No information given |
| Blinding of participants and personnel (performance bias) All outcomes | High risk | No evidence for blinding |
| Blinding of outcome assessment (detection bias) All outcomes | High risk | No evidence for independent assessment |
| Incomplete outcome data (attrition bias) All outcomes | Low risk | All patients accounted for final analysis |
| Selective reporting (reporting bias) | Low risk | No study protocol available. But all endpoints mentioned were reported. |
| Other bias | Low risk | No other potential sources of bias found |
Faiss 2003.
| Study characteristics | ||
| Methods | Prospective, randomised, multicentre trial Stratified block‐wise randomisation, carried out centrally, stratified by primary tumour localisation (foregut, midgut, hindgut, unknown) and functional or non‐functional tumours Enrolment: July 1995‐October 1998 |
|
| Participants | Inclusion criteria
Exclusion criteria
Total patients: 80 Median age (lanreotide vs. interferon alfa vs. combination): 60 vs. 56 vs. 58 Women, % (lanreotide vs. interferon alfa vs. combination): 52 vs. 37 vs. 36 Functional tumour, % (lanreotide vs. interferon alfa vs. combination): 48 vs. 33 vs. 29 Liver metastases, % (lanreotide vs. interferon alfa vs. combination): 92 vs. 93 vs. 89 Localisation of the primary, %:
Previous surgical resection, % (lanreotide vs. interferon alfa vs. combination): 56 vs. 44 vs. 54 |
|
| Interventions | Study arm 1 (27/80): lanreotide, 1 mg, three times a day, subcutaneous injection Study arm 2 (28/80): interferon alfa, 5 x 10⁶ U, three times a week, subcutaneous injection Study arm 3 (29/80): lanreotide, 1 mg three times a day, subcutaneous injection and interferon alfa, 5 x 10⁶ U, three times a week, subcutaneous injection Patients showing progressive disease while receiving the initially assigned treatment with lanreotide or interferon alfa received the combination of lanreotide and interferon alfa. |
|
| Outcomes | Primary endpoint:
Secondary endpoints:
Assessments:
|
|
| Notes | Ipsen Pharma and Essex Pharma participated in the development of the study design, provided funding and participated also in the collection of the data. | |
| Risk of bias | ||
| Bias | Authors' judgement | Support for judgement |
| Random sequence generation (selection bias) | Low risk | A stratified block‐wise randomisation with block size 6 was carried out centrally by telephone using randomisation tables. |
| Allocation concealment (selection bias) | Low risk | Done centrally |
| Blinding of participants and personnel (performance bias) All outcomes | High risk | No masking |
| Blinding of outcome assessment (detection bias) All outcomes | High risk | Only critical cases were re‐reviewed by an independent radiologist. |
| Incomplete outcome data (attrition bias) All outcomes | Unclear risk | 4 patients had to be excluded after randomisation. |
| Selective reporting (reporting bias) | Low risk | No study protocol available but all endpoints in 'methods' were reported in 'results'. |
| Other bias | Low risk | No other potential sources of bias found |
Fisher 2016.
| Study characteristics | ||
| Methods | 3‐phase, multicentre study in 12 countries
1:1 randomisation using 2 computer‐generated lists (one for the US and one for all other countries) stratified by previous treatment with any long‐ or short‐acting somatostatin analog or SSA‐naive patients Start: May 2009 End: May 2013 Subgroup analysis: Efficacy and safety of lanreotide in the ELECT study subgroup of patients with prior octreotide therapy |
|
| Participants | Inclusion criteria
Exclusion criteria
ELECT overall population Total patients: 115 Mean age (lanreotide vs. placebo): 58 vs. 59 Women, % (lanreotide vs. placebo): 54 vs. 62 Prior SSA therapy, % (lanreotide vs. placebo): 56 vs. 55 Short‐acting octreotide during screening, % (lanreotide vs. placebo): 51 vs. 52 Subgroup: prior octreotide therapy Total patients: 64 Mean age (overall): 59 Women (overall): 55% |
|
| Interventions | Intervention group (ELECT overall population: 59/115, prior octreotide therapy subgroup: 33/64): lanreotide depot/autogel 120 mg, every 4 weeks by deep subcutaneous injection Control group (ELECT overall population: 56/115, prior octreotide therapy subgroup: 31/64): placebo (0.9% saline solution), every 4 weeks by deep subcutaneous injection Self‐injected subcutaneous short‐acting octreotide for symptom rescue at patients' discretion After ≥ 4 weeks in the double‐blind phase, patients could roll over into the open‐label phase if they used octreotide for ≥ 21 days of the 28‐day cycle and used a dose ≥ 300 μg/day for ≥ 14 of the 21 days. |
|
| Outcomes | Primary endpoint:
Secondary endpoints:
Assessments:
|
|
| Notes | Trial funded by Ipsen | |
| Risk of bias | ||
| Bias | Authors' judgement | Support for judgement |
| Random sequence generation (selection bias) | Low risk | Computer‐generated, stratified randomisation |
| Allocation concealment (selection bias) | Unclear risk | Insufficient information given |
| Blinding of participants and personnel (performance bias) All outcomes | Low risk | Double‐blinded trial design with same injection schedules |
| Blinding of outcome assessment (detection bias) All outcomes | Unclear risk | Patient‐reported results |
| Incomplete outcome data (attrition bias) All outcomes | Low risk | Efficacy analyses were performed with all randomised patients on an ITT principle. |
| Selective reporting (reporting bias) | Low risk | No study protocol available, but every stated endpoint was reported. |
| Other bias | Low risk | No other potential sources of bias found |
Ito 2012.
| Study characteristics | ||
| Methods | International, multicentre, double‐blind, phase 3 study
Randomisation:
Start: July 2007 Closed: May 2009 |
|
| Participants | Inclusion criteria:
Exclusion criteria:
RADIANT‐3 overall population:
RADIANT‐3 Japanese subgroup:
|
|
| Interventions | Intervention group (overall: 207/410; Japanese subgroup: 23): oral everolimus, at a dose of 10 mg once daily, in conjunction with best supportive care (e.g. somatostatin analogue therapy) Control group (overall: 203/410; Japanese subgroup: 17): oral matching placebo in conjunction with best supportive care (e.g. somatostatin analogue therapy) Length of treatment: until progression of the disease, development of an unacceptable toxic effect, drug interruption for 3 weeks or longer, or withdrawal of consent Patients who had been assigned to placebo initially could switch to open‐label everolimus after documented progression of disease (RECIST). Doses were delayed/reduced if patients had clinically significant adverse events that were considered to be related to the study treatment. |
|
| Outcomes | Primary endpoint:
Secondary endpoints:
Assessments:
Data collection: sponsor's data management Data analysis: sponsor's statistical team |
|
| Notes | Funding/Sponsor: Novartis Oncology and Novartis Pharma K.K. | |
| Risk of bias | ||
| Bias | Authors' judgement | Support for judgement |
| Random sequence generation (selection bias) | Low risk | Centralised randomisation through interactive voice response system. Stratified by performance status and prior treatment (+/‐ chemotherapy) |
| Allocation concealment (selection bias) | Low risk | Centralised randomisation |
| Blinding of participants and personnel (performance bias) All outcomes | Low risk | Double‐blinded trial design with same schemes for each study group |
| Blinding of outcome assessment (detection bias) All outcomes | Low risk | Endpoints were documented by the local investigator according to RECIST, with independent adjudicated central assessment. |
| Incomplete outcome data (attrition bias) All outcomes | Low risk | All participants accounted for in final analysis |
| Selective reporting (reporting bias) | Unclear risk | Not all secondary endpoints mentioned in the study protocol were published. |
| Other bias | Low risk | No other potential sources of bias found |
Jacobsen 1995.
| Study characteristics | ||
| Methods | Randomised, double‐blind, cross‐over trial | |
| Participants | Inclusion criteria
Exclusion criteria
Total patients: 11 Mean age (overall): 56.5 Women (overall): 55% Primary tumour site (overall):
|
|
| Interventions | Intervention group: 100 μg octreotide, subcutaneous injection, twice daily for 4 weeks Control group: placebo, subcutaneous injection, twice daily for 4 weeks After the first 4 weeks, patients were shifted from placebo to octreotide and vice versa. |
|
| Outcomes | Endpoints:
Assessments:
|
|
| Notes | The study drug was supplied by Sandoz AG. | |
| Risk of bias | ||
| Bias | Authors' judgement | Support for judgement |
| Random sequence generation (selection bias) | Unclear risk | Randomisation was performed by the study drug supplier. |
| Allocation concealment (selection bias) | Unclear risk | At half time, the groups shifted from active treatment to placebo and vice versa. The inclusion criterion "the symptoms had to interfere with daily activity" was not precisely defined. |
| Blinding of participants and personnel (performance bias) All outcomes | Unclear risk | Double‐blind trial, but patients knew they would get both placebo and active treatments. Yet they did not know the order of administration. |
| Blinding of outcome assessment (detection bias) All outcomes | Unclear risk | No information given |
| Incomplete outcome data (attrition bias) All outcomes | Unclear risk | Several patients left the study but it remained unclear whether they were accounted for in final analysis. |
| Selective reporting (reporting bias) | Unclear risk | No study protocol available and no clear endpoints stated |
| Other bias | Low risk | No other potential sources of bias found |
Kölby 2003.
| Study characteristics | ||
| Methods | Prospective randomised multicentre study
Randomisation stratified by the presence or absence of carcinoid heart disease on ultrasonography and urinary 5‐HIAA level Start: April 1991 Enrolment closed: July 1998 Follow up: until April 2001 |
|
| Participants | Inclusion criteria
Exclusion criteria
Total patients: 68 Mean age (study arm 1 vs. 2): 62 vs. 63 Women (overall): 56% Ki‐67 index: not reported All patients underwent hepatic arterial embolisation before randomisation. |
|
| Interventions | Study arm 1 (35/68): Octreotide 100 µg twice daily. If there were persistent carcinoid symptoms, the dose was increased up to 200 µg three times daily. Study arm 2 (33/68): Octreotide 100 µg twice daily. If there were persistent carcinoid symptoms, the dose was increased up to 200 µg three times daily. With interferon‐α. Interferon treatment started with 3 × 10⁶ units on each of 3 days per week and was increased to a maximal dose of 5 × 10⁶ units on each of 5 days per week. |
|
| Outcomes | Endpoints:
Assessments:
|
|
| Notes | ||
| Risk of bias | ||
| Bias | Authors' judgement | Support for judgement |
| Random sequence generation (selection bias) | Unclear risk | Randomisation was stratified according to the presence or absence of carcinoid heart disease on ultrasonography (stenosis and/or regurgitation in the pulmonary and tricuspid valves) and urinary 5‐HIAA level more or less than 500 μmol per 24‐h; but it remained unclear how the randomisation process was performed. |
| Allocation concealment (selection bias) | Unclear risk | No information given |
| Blinding of participants and personnel (performance bias) All outcomes | High risk | Personnel and participants were not blinded. |
| Blinding of outcome assessment (detection bias) All outcomes | High risk | No evidence for independent assessment |
| Incomplete outcome data (attrition bias) All outcomes | Low risk | All patients accounted for in ITT analysis |
| Selective reporting (reporting bias) | Low risk | No protocol available. Every stated endpoint was reported in the results section. |
| Other bias | Low risk | No other potential sources of bias found |
Kulke 2016.
| Study characteristics | ||
| Methods | Randomised phase II trial Randomisation: 1:1 |
|
| Participants | Inclusion criteria:
Total patients: 150 Median age: 59 Women: 44% ECOG 0: 57%; ECOG 1: 43% Grade: not reported Functionality: not reported |
|
| Interventions | Study arm E: everolimus, 10 mg, p.o. qd. Study arm E + B: everolimus, 10 mg, p.o., qd; with bevacizumab, 10 mg/kg, i.v. q2 weeks. All patients received octreotide. |
|
| Outcomes | Primary endpoint:
Secondary endpoints:
|
|
| Notes | ||
| Risk of bias | ||
| Bias | Authors' judgement | Support for judgement |
| Random sequence generation (selection bias) | Unclear risk | No information given |
| Allocation concealment (selection bias) | Unclear risk | No information given |
| Blinding of participants and personnel (performance bias) All outcomes | High risk | Two different application schemes for the study drugs |
| Blinding of outcome assessment (detection bias) All outcomes | Unclear risk | No information given |
| Incomplete outcome data (attrition bias) All outcomes | Unclear risk | Insufficient information given |
| Selective reporting (reporting bias) | Unclear risk | Insufficient information given |
| Other bias | Low risk | No other potential sources of bias found |
Kulke 2017 (1).
| Study characteristics | ||
| Methods | Randomised, global, multicentre, open‐label, phase 2 trial 1:1 randomisation, stratified by prior SSA treatment (yes or no) and the presence of elevated biomarkers at baseline Start: July 2011 Closed: December 2021 |
|
| Participants | Inclusion criteria:
Exclusion criteria:
Total patients: 160 Median age (everolimus + pasireotide LAR vs. everolimus): 57 vs. 59 Women % (everolimus + pasireotide LAR vs. everolimus): 51 vs. 42 WHO performance status 0‐1 (everolimus + pasireotide LAR vs. everolimus): 100% vs. 96% Grade 1 or 2, % (everolimus + pasireotide LAR vs. everolimus): 97.5 vs. 97.5 Functionality: not reported Prior antineoplastic treatment, % (everolimus + pasireotide LAR vs. everolimus): 65 vs. 62 Prior SSA treatment, % (everolimus + pasireotide LAR vs. everolimus): 33 vs. 33 |
|
| Interventions | Study arm 1 (79/160): everolimus, 10 mg/day, per oral; with pasireotide LAR, 60 mg/28 days, intramuscular injection Study arm 2 (81/160): everolimus, 10 mg/day, per oral Length of treatment: until radiologically documented disease progression, start of a new anticancer therapy, intolerable toxicity or withdrawal of consent Dose modifications were permitted for any adverse event suspected to be drug related. Cross‐over: not allowed |
|
| Outcomes | Primary endpoint:
Secondary endpoints:
Biomarker response was evaluated as an exploratory analysis. Assessments:
|
|
| Notes | Funding: Novartis Pharmaceuticals Corporation | |
| Risk of bias | ||
| Bias | Authors' judgement | Support for judgement |
| Random sequence generation (selection bias) | Unclear risk | Randomisation with stratification, but unclear how it was performed |
| Allocation concealment (selection bias) | Unclear risk | No information given |
| Blinding of participants and personnel (performance bias) All outcomes | High risk | Trial was open‐label. |
| Blinding of outcome assessment (detection bias) All outcomes | High risk | No evidence of independent assessment of radiological outcomes |
| Incomplete outcome data (attrition bias) All outcomes | Low risk | All participants accounted for; one patient in the combination arm did not receive study treatment. |
| Selective reporting (reporting bias) | Low risk | No protocol available. Not all endpoints mentioned were shown in the official publication, but can be found in the supplementary data. |
| Other bias | Low risk | No other potential sources of bias found |
Kulke 2017 (2).
| Study characteristics | ||
| Methods | International (12 countries), multicentre, randomised, double‐blind, placebo‐controlled phase III trial (TELESTAR) 1:1:1 randomisation |
|
| Participants | Inclusion criteria
Exclusion criteria
Total patients: 135 Mean age (A vs. B vs. C): 63 vs. 62 vs. 65 Women, % (A vs. B vs. C): 47 vs. 53 vs. 44 SSA therapy at study entry, %:
|
|
| Interventions | Study group A (45/135): placebo, oral doses, three times per day for 12 weeks Study group B (45/135): telotristat ethyl 250 mg, oral doses, three times per day for 12 weeks Study group C (45/135): telotristat ethyl 500 mg, oral doses, three times per day for 12 weeks Continued baseline SSA therapy for all 12 weeks Allowed rescue use of short‐acting octreotide and antidiarrhoeal agents After the study, all patients were offered treatment with telotristat ethyl 500 mg, three times per day in a 36‐week open‐label extension. |
|
| Outcomes | Primary endpoint:
Secondary endpoints:
Additional efficacy endpoints:
Assessments:
|
|
| Notes | Study was supported by Lexicon Pharmaceuticals. | |
| Risk of bias | ||
| Bias | Authors' judgement | Support for judgement |
| Random sequence generation (selection bias) | Unclear risk | No information given |
| Allocation concealment (selection bias) | Unclear risk | No information regarding allocation concealment; all study groups with the same number of patients |
| Blinding of participants and personnel (performance bias) All outcomes | Low risk | Double‐blind trial design |
| Blinding of outcome assessment (detection bias) All outcomes | Unclear risk | Assessment was done by self‐reporting in the majority of endpoints. |
| Incomplete outcome data (attrition bias) All outcomes | Low risk | All randomised patients accounted for in the efficacy analyses in ITT fashion |
| Selective reporting (reporting bias) | Low risk | No study protocol available, but all stated endpoints were reported. |
| Other bias | Low risk | No other potential sources of bias found |
Lange 1992.
| Study characteristics | ||
| Methods | Randomised, double‐blinded, placebo‐controlled trial Randomisation was stratified for diagnosis (gastrinoma vs. insulinoma) and for type of excision (enucleation vs. resection) Start: 1989 Closed: 1991 |
|
| Participants | Inclusion criteria:
Exclusion criteria:
Total patients: 21 Median age (octreotide vs. placebo): 47 vs. 46 Women, % (octreotide vs. placebo): 70 vs. 27 Functionality, % (octreotide vs. placebo): 100 vs. 100 Tumour grade: not reported Prior treatment for NET: not reported |
|
| Interventions | Experimental arm (10/21): octreotide, subcutaneous injection, beginning the day of surgery. Dosage: day 1, 50 μg every 8 hours; day 2, 100 μg every 8 hours; day 3 and for the duration of treatment, 150 μg every 8 hours Control arm (11/21): saline solution, subcutaneous injection, same schedule and in a volume to match that of the experimental arm Octreotide and saline solution injections were continued until 3 days after drain removal. Drain removal was regulated by a standardised algorithm. |
|
| Outcomes | Endpoints:
Assessments:
|
|
| Notes | ||
| Risk of bias | ||
| Bias | Authors' judgement | Support for judgement |
| Random sequence generation (selection bias) | Unclear risk | Randomisation with stratification, but unclear how it was performed |
| Allocation concealment (selection bias) | Unclear risk | No information given |
| Blinding of participants and personnel (performance bias) All outcomes | Low risk | Same protocols for each study arm |
| Blinding of outcome assessment (detection bias) All outcomes | Unclear risk | No information given |
| Incomplete outcome data (attrition bias) All outcomes | Low risk | All participants accounted for in final analysis |
| Selective reporting (reporting bias) | Low risk | No protocol available, but all endpoints stated in the paper as measured were reported. |
| Other bias | Low risk | No other potential sources of bias found |
Lepage 2020.
| Study characteristics | ||
| Methods | Randomised, double‐blind, placebo‐controlled study 1:1 randomisation |
|
| Participants | Inclusion criteria
Total patients: 53 G2 tumour (overall): 81% Metastatic disease (overall): 91% Previous SSA treatment, % (lanreotide vs. placebo): 15 vs. 19 First‐line treatment (overall):
|
|
| Interventions | Intervention group: lanreotide autogel (LAN) every 28 days Control group: placebo every 28 days Treatment duration: until progression or toxicity |
|
| Outcomes | Main endpoint:
Secondary endpoints:
|
|
| Notes | Trial was funded by Ipsen. | |
| Risk of bias | ||
| Bias | Authors' judgement | Support for judgement |
| Random sequence generation (selection bias) | Unclear risk | No information given |
| Allocation concealment (selection bias) | Unclear risk | No information given |
| Blinding of participants and personnel (performance bias) All outcomes | Low risk | Double‐blind trial |
| Blinding of outcome assessment (detection bias) All outcomes | Unclear risk | No information given |
| Incomplete outcome data (attrition bias) All outcomes | Unclear risk | No information given |
| Selective reporting (reporting bias) | Unclear risk | No study protocol available |
| Other bias | Low risk | No other potential sources of bias found |
Liu 2020.
| Study characteristics | ||
| Methods | 1:1:1:2 randomisation Enrolment: August 2017 to February 2019 |
|
| Participants | Inclusion criteria
Total patients: 33 Age (A vs. B vs. C vs. D): 43 vs. 55 vs. 55 vs. 50 Women, % (A vs. B vs. C vs. D): 67 vs. 29 vs. 33 vs. 50 Primary tumour site, %:
Tumour grade, %:
Liver involvement, % (A vs. B vs. C vs. D): 100 vs. 100 vs. 83 vs. 100 Prior treatment, %:
|
|
| Interventions | Group A (6/33): 3.7 GBq (100 mCi) 177Lu‐DOTATATE, one dose Group B (7/33): 1.11 GBq (30 mCi) 177Lu‐DOTA‐EB‐TATE, one dose Group C (6/33): 1.85 GBq (50 mCi) 177Lu‐DOTA‐EB‐TATE, one dose Group D (14/33): 3.7 GBq (100 mCi) 177Lu‐DOTA‐EB‐TATE, one dose |
|
| Outcomes | Endpoints:
Assessments:
|
|
| Notes | ||
| Risk of bias | ||
| Bias | Authors' judgement | Support for judgement |
| Random sequence generation (selection bias) | Low risk | Randomised sequence was generated by computer. |
| Allocation concealment (selection bias) | Unclear risk | Was performed by different people |
| Blinding of participants and personnel (performance bias) All outcomes | Unclear risk | No information given |
| Blinding of outcome assessment (detection bias) All outcomes | Low risk | All images were measured by the same physician who was masked to the clinical data. |
| Incomplete outcome data (attrition bias) All outcomes | Low risk | All patients accounted for in analysis |
| Selective reporting (reporting bias) | Low risk | All stated endpoints were reported. |
| Other bias | Low risk | No other potential sources of bias found |
Lombard‐Bohas 2015.
| Study characteristics | ||
| Methods | International, multicentre, double‐blind, phase 3 study
Randomisation:
Start: July 2007 Closed: May 2009 |
|
| Participants | Inclusion criteria:
Exclusion criteria:
RADIANT‐3 overall population:
Subgroup analysis:
Median age (previous chemotherapy vs. chemo‐naive): 58 vs. 58 Women % (previous chemotherapy vs. chemo‐naive): 43 vs 47 WHO performance status 0 (previous chemotherapy vs. chemo‐naive): 61% vs. 72% Race (%, white): 79 vs. 78
|
|
| Interventions | Intervention group (207/410): oral everolimus, at a dose of 10 mg once daily, in conjunction with best supportive care (e.g. somatostatin analogue therapy) Control group (203/410): oral matching placebo in conjunction with best supportive care (e.g. somatostatin analogue therapy) Length of treatment: until progression of the disease, development of an unacceptable toxic effect, drug interruption for 3 weeks or longer, or withdrawal of consent Patients who had been assigned to placebo initially could switch to open‐label everolimus after documented progression of disease (RECIST). Doses were delayed/reduced if patients had clinically significant adverse events that were considered to be related to the study treatment. |
|
| Outcomes | Primary endpoint:
Secondary endpoints:
Assessments:
Data collection: sponsor's data management Data analysis: sponsor's statistical team |
|
| Notes | Funding/Sponsor: Novartis Oncology | |
| Risk of bias | ||
| Bias | Authors' judgement | Support for judgement |
| Random sequence generation (selection bias) | Low risk | Centralised randomisation through interactive voice response system. Stratified by performance status and prior treatment (+/‐ chemotherapy) |
| Allocation concealment (selection bias) | Low risk | Centralised randomisation |
| Blinding of participants and personnel (performance bias) All outcomes | Low risk | Double‐blinded trial design with same schemes for each study group |
| Blinding of outcome assessment (detection bias) All outcomes | Low risk | Endpoints were documented by the local investigator according to RECIST, with independent adjudicated central assessment. |
| Incomplete outcome data (attrition bias) All outcomes | Low risk | All participants accounted for in final analysis |
| Selective reporting (reporting bias) | Unclear risk | Not all secondary endpoints mentioned in the study protocol were published. |
| Other bias | Low risk | No other potential sources of bias found |
Maire 2012.
| Study characteristics | ||
| Methods | Prospective randomised trial
Central randomisation with an adaptive randomisation procedure stratified per centre and progression group Start: 2002 Closed: 2008 Follow‐up: 24 months after inclusion |
|
| Participants | Inclusion criteria
Exclusion criteria
Total patients: 26 Median age (HAE vs. HACE): 56 vs. 65 Women, % (HAE vs. HACE): 36 vs. 42 Median Karnofsky index (overall): 90 Carcinoid syndrome, % (HAE vs. HACE): 79 vs. 67 Liver involvement, < 25%/25‐50%/> 50%, % (HAE vs. HACE): 43/36/21 vs. 58/25/17 Ki‐67 index, ≤ 2%/3‐5%/6‐10%/unknown, % (overall): 62/19/4/15 Resection of primary tumour, % (HAE vs. HACE): 86 vs. 83 Previous resection of liver metastases, % (HAE vs. HACE): 14 vs. 17 Concomitant treatment with SSA, % (HAE vs. HACE): 79 vs. 67 Primary tumour location unknown (overall): 15% |
|
| Interventions | Study arm 1 (14/26): hepatic arterial embolisation (HAE): transfemoral, embolisation with gelatin sponge particles Study arm 2 (12/26): hepatic arterial chemoembolisation (HACE): transfemoral, doxorubicin (50 mg/m2) dissolved in normal saline and combined with 10–15 mL of iodised oil, injected into the branches of the hepatic artery distal to the gastroduodenal artery, followed by embolisation with gelatin sponge particles Treatment was administered after randomisation and was repeated 3 months thereafter. Carcinoid syndrome had to be controlled by somatostatin analogues. Patients with carcinoid syndrome were administered octreotide 200 µg subcutaneously before the procedure and every 8 h afterward during 48 h to prevent a carcinoid crisis. |
|
| Outcomes | Primary endpoint
Secondary endpoints
Assessments
|
|
| Notes | Funding: Novartis Pharma | |
| Risk of bias | ||
| Bias | Authors' judgement | Support for judgement |
| Random sequence generation (selection bias) | Unclear risk | Randomisation was performed centrally with the use of an adaptive randomisation procedure stratified per centre and progression group, but it remained unclear how this adaptive randomisation procedure worked. |
| Allocation concealment (selection bias) | Low risk | Randomisation was performed centrally. |
| Blinding of participants and personnel (performance bias) All outcomes | High risk | Participants and personnel were not blinded. |
| Blinding of outcome assessment (detection bias) All outcomes | High risk | No evidence of independent assessment |
| Incomplete outcome data (attrition bias) All outcomes | Unclear risk | All patients accounted for in primary endpoint. For morphological response and for biological response only 23 and 20 patients were evaluable. |
| Selective reporting (reporting bias) | Low risk | No study protocol available, but every endpoint mentioned in 'methods' was reported in 'results'. |
| Other bias | Low risk | No other potential sources of bias found |
Meyer 2014.
| Study characteristics | ||
| Methods | Multicentre, randomised trial
1:1 randomisation by stratified random block method Stratification factors: functional or non‐functional tumour, previous somatostatin analogues/interferon treatment versus none and known primary tumour site versus unknown Enrolment start: November 2006 Enrolment closed: October 2010 |
|
| Participants | Inclusion criteria
Total patients: 86. Median age (CapStrep vs. CapStrepCis): 57 vs. 59 Women, % (CapStrep vs. CapStrepCis): 39 vs. 45 Site of origin, %:
Functional tumour, % (CapStrep vs. CapStrepCis): 30 vs. 43 Liver metastases, % (CapStrep vs. CapStrepCis): 93 vs. 81 Ki‐67 index (%) ≤ 9/10‐24/≥ 25, % (CapStrep vs. CapStrepCis): 46/33/21 vs. 50/27/24 Prior treatment received, %:
|
|
| Interventions | CapStrep regimen group (44/86): capecitabine 625 mg/m2 administered orally, twice daily on days 1–21, and streptozocin 1.0 g/m2 (2‐h infusion intravenously in normal saline) on day 1 CapStepCis regimen group (42/86): capecitabine 625 mg/m2 administered orally, twice daily on days 1–21, and streptozocin 1.0 g/m2 (2‐h infusion intravenously in normal saline) on day 1 plus cisplatin 70 mg/m2 (2‐h infusion intravenously in normal saline with hydration) on day 1, directly after the streptozocin infusion Treatment duration: six cycles (and beyond six cycles if there was evidence of benefit) |
|
| Outcomes | Primary endpoint:
Secondary endpoints:
Assessments
|
|
| Notes | ||
| Risk of bias | ||
| Bias | Authors' judgement | Support for judgement |
| Random sequence generation (selection bias) | Low risk | Randomisation by stratified random block method |
| Allocation concealment (selection bias) | Unclear risk | No information given |
| Blinding of participants and personnel (performance bias) All outcomes | High risk | No evidence for blinding |
| Blinding of outcome assessment (detection bias) All outcomes | High risk | Retrospective central radiology review in 10% of randomly selected patients who completed at least three treatment cycles |
| Incomplete outcome data (attrition bias) All outcomes | Unclear risk | No study protocol available, but every mentioned endpoint in 'methods' is reported in 'results'. |
| Selective reporting (reporting bias) | High risk | Four patients were not included in the primary analysis. There was a big loss of patient numbers in the 'quality of life' endpoint. |
| Other bias | Low risk | No other potential sources of bias found |
Moertel 1980.
| Study characteristics | ||
| Methods | Multicentric, randomised trial
Randomisation was stratified according to: performance status, either functioning or nonfunctioning tumour, and use of either laboratory assay or measurable feature to assess objective response. Start: December 1972 Closed: December 1978 |
|
| Participants | Inclusion criteria:
Exclusion criteria:
Exploratory surgery with biopsy within two weeks of treatment start and a resection or anastomosis within three weeks of treatment start Previous radiation therapy or treatment with cytotoxic drugs within one month after registration Present haematologic or renal toxic effect from therapy 103 patients were randomised; 19 were excluded. Mean age (study arm 1 vs. 2): 52 vs. 54 Women % (1 vs. 2): 57 vs. 45 ECOG performance status 0‐1 (1 vs. 2): 71% vs. 71% Functional tumour % (1 vs. 2): 52 vs. 44% Tumour grade: not reported. Prior chemotherapy (overall): 2% |
|
| Interventions | Study arm 1 (42/84): streptozocin, by rapid intravenous injection, 500 mg per square metre of body‐surface area, for five consecutive days, repeated every 6 weeks if disease improved or remained objectively stable Study arm 2 (42/84): streptozocin, by rapid intravenous injection, 500 mg per square metre of body‐surface area, for five consecutive days; and fluorouracil, by rapid intravenous injection, 400 mg per square metre of body‐surface area, for five consecutive days, concurrently with streptozocin, repeated every 6 weeks if disease improved or remained objectively stable Streptozocin dosage was reduced by 50%, if the patient had severe nausea and vomiting or any evidence of renal toxicity was present. Streptozocin was discontinued if these problems persisted after dose reduction. Flourouracil dosage was reduced by 25% if severe leukopenia or thrombocytopenia was present. Phenothiazine antiemetics were recommended for prophylaxis and therapy of nausea and vomiting. |
|
| Outcomes | No clear endpoints were set. Assessments:
|
|
| Notes | ||
| Risk of bias | ||
| Bias | Authors' judgement | Support for judgement |
| Random sequence generation (selection bias) | Unclear risk | Randomisation with stratification, but unclear how it was performed |
| Allocation concealment (selection bias) | Unclear risk | No information given |
| Blinding of participants and personnel (performance bias) All outcomes | Unclear risk | Insufficient information given |
| Blinding of outcome assessment (detection bias) All outcomes | Unclear risk | No information given |
| Incomplete outcome data (attrition bias) All outcomes | Unclear risk | In two patients, the investigators failed to record serial tumour measurements. |
| Selective reporting (reporting bias) | High risk | 19 patients were excluded after randomisation. |
| Other bias | High risk | Investigator‐dependent measurement methods were used. |
Moertel 1992.
| Study characteristics | ||
| Methods | Multinational, randomised trial
Randomisation: stratified according to ECOG performance score and indicator of response (measurable tumour or laboratory assays) Start: November 1978 Closed: June 1985 |
|
| Participants | Inclusion criteria:
Exclusion criteria:
Total patients: 125; 18 patients were subsequently found to be ineligible and two withdrew from the study. Median age (1 vs. 2 vs. 3): 57 vs. 51 vs. 53 Women % (1 vs. 2 vs. 3): 61 vs. 41 vs. 53 ECOG performance status 0‐1 (1 vs. 2 vs. 3): 70% vs. 71% vs. 71% Nonfunctional tumours (overall): 52.4% Tumour grade: not reported Prior therapy for NET: not reported |
|
| Interventions | Study arm 1 (33/105): chlorozotocin, intravenous injection, 150 mg per square metre of body‐surface area, every seven weeks Study arm 2 (34/105): streptozocin, intravenous injection, 500 mg per square metre, for five consecutive days, every six weeks. And, fluorouracil intravenous injection, 400 mg per square metre, for five days, concurrently with streptozocin Study arm 3 (38/105): doxorubicin along with streptozocin, intravenous injection, 50 mg per square metre, days 1 and 22 of each six‐week treatment cycle, with a maximal total dose of 500 mg per square metre Dosages of streptozocin or chlorozotocin were reduced if 1) severe nausea or vomiting, stomatitis, diarrhoea, leukopenia, or thrombocytopenia occurred, or 2) creatinine level became elevated or persistent proteinuria developed. If these abnormalities persisted, treatment with these agents was discontinued. Length of therapy: until disease progression was noted |
|
| Outcomes | Endpoints:
Assessments:
|
|
| Notes | ||
| Risk of bias | ||
| Bias | Authors' judgement | Support for judgement |
| Random sequence generation (selection bias) | Unclear risk | Randomisation with stratification, but unclear how it was performed |
| Allocation concealment (selection bias) | Unclear risk | Insufficient information given |
| Blinding of participants and personnel (performance bias) All outcomes | High risk | Different application schemes and control intervals for each study arm |
| Blinding of outcome assessment (detection bias) All outcomes | Unclear risk | No information given |
| Incomplete outcome data (attrition bias) All outcomes | High risk | 20 patients were excluded after randomisation. |
| Selective reporting (reporting bias) | Low risk | No study protocol available, but the endpoints mentioned in 'methods' were reported in 'results'. |
| Other bias | High risk | Investigator‐dependent measurement methods were used. |
O'Toole 2000.
| Study characteristics | ||
| Methods | Prospective, open, comparative, cross‐over study
|
|
| Participants | Inclusion criteria
Exclusion criteria
Withdrawal
Total patients: 33 Age (A vs. B): 63 vs. 64 Women, % (A vs. B): 50 vs. 53 Previous treatment with octreotide/lanreotide, % (A vs. B): 63/13 vs. 59/0 Primary tumour site, %:
Metastases, % (A vs. B): 100 vs. 100 |
|
| Interventions | Group A (16/33): octreotide, 200 mg, subcutaneously twice or thrice daily for 30 days followed by lanreotide, 30 mg, intramuscularly every 10 days on days 1, 10, and 20 for 30 days Group B (17/33): lanreotide, 30 mg, intramuscularly every 10 days on days 1, 10, and 20 for 30 days followed by octreotide, 200 mg, subcutaneously twice or thrice daily for 30 days A wash‐out period of at least 3 days was applied between the two treatments. Antidiarrhoea agents were prohibited during the study period. |
|
| Outcomes | Endpoints:
Assessments:
|
|
| Notes | ||
| Risk of bias | ||
| Bias | Authors' judgement | Support for judgement |
| Random sequence generation (selection bias) | Unclear risk | No information given |
| Allocation concealment (selection bias) | Unclear risk | No information given |
| Blinding of participants and personnel (performance bias) All outcomes | High risk | Personnel and participants were not blinded. |
| Blinding of outcome assessment (detection bias) All outcomes | Low risk | Analysis was performed by an independent expert who was blinded to the treatment group. |
| Incomplete outcome data (attrition bias) All outcomes | High risk | 5 of 33 (15%) randomised patients were excluded; therefore 28 patients accounted for in efficacy analysis (14 patients per group) |
| Selective reporting (reporting bias) | Low risk | No study protocol available, but all stated endpoints were reported. |
| Other bias | Low risk | No other potential sources of bias found |
Öberg 1989.
| Study characteristics | ||
| Methods | 1:1 randomised trial, stratified by urinary 5‐hydroxyindoleacetic acid level, sex and age | |
| Participants | Inclusion criteria
Total patients: 20 Mean age (overall): 61.5 Women, % (overall): 45% Liver metastases (overall): 100% Carcinoid symptoms (overall): 100% Primary tumour location (overall): 95% ileum, 5% bronchial Previous therapy for NET: not reported |
|
| Interventions | Study arm 1 (10/20): streptozotocin, 1 g, intravenous, for three consecutive days in combination with 5‐fluorouracil, 400 mg/m2. Treatment was repeated every 6 weeks. Study arm 2 (10/20): interferon, 6 MU daily, subcutaneous injection; for the first three days, only half the dose was given. No other treatment for carcinoid syndrome was used. Cross‐over of 8 patients in the study arm 1 to study arm 2 after 6 months; and of 1 patient from study arm 2 to study arm 1 |
|
| Outcomes | No clear primary or secondary endpoints stated Endpoints reported:
Assessments:
|
|
| Notes | ||
| Risk of bias | ||
| Bias | Authors' judgement | Support for judgement |
| Random sequence generation (selection bias) | Unclear risk | No sufficient information given |
| Allocation concealment (selection bias) | Unclear risk | No information given |
| Blinding of participants and personnel (performance bias) All outcomes | High risk | Patients and personal not blinded. Different application and assessment schemes |
| Blinding of outcome assessment (detection bias) All outcomes | High risk | No evidence for independent evaluation |
| Incomplete outcome data (attrition bias) All outcomes | High risk | All patients accounted for in analysis, but group cross‐over was done. Not mentioned if ITT or per‐protocol analysis was performed |
| Selective reporting (reporting bias) | Unclear risk | No clear endpoints stated. No study protocol available |
| Other bias | Low risk | No other potential sources of bias found |
Pavel 2011.
| Study characteristics | ||
| Methods | Multicentre (16 countries), double‐blind, phase 3 study 1:1 randomisation by interactive voice response system Study group assignments were masked. Enrolment: January 2007‐April 2010 |
|
| Participants | Inclusion criteria
Exclusion criteria
Total patients: 429 Median age (study group 1 vs. study group 2): 60 vs. 60 Women, % (1 vs. 2): 55 vs. 42 WHO performance status 0/1/2, % (1 vs. 2): 55/39/6 vs. 66/29/5 Primary tumour site, %:
Grade (well differentiated/moderately differentiated/poorly differentiated), % (1 vs. 2): 77/18/1 vs. 82/14/1 Liver involvement, % (1 vs. 2): 92 vs. 92 Previous SSA treatment, % (1 vs. 2): 80 vs. 78 Previous systemic anti‐tumour drugs, % (1 vs. 2): 46 vs. 38 Chemotherapy, % (1 vs. 2): 35 vs. 26 Immunotherapy, % (1 vs. 2): 13 vs. 9 Targeted therapy, % (1 vs. 2): 7 vs. 8 Other, % (1 vs. 2): 10 vs. 13 |
|
| Interventions | Study group 1 (216/429): 10 mg oral everolimus once daily plus intramuscular 30 mg octreotide LAR every 28 days Study group 2 (213/429): matching placebo plus intramuscular 30 mg octreotide LAR every 28 days Treatment duration: until disease progression, withdrawal from treatment because of adverse events, or withdrawal of consent After disease progression in the placebo plus octreotide LAR group, cross‐over to open‐label everolimus plus octreotide LAR was permitted. |
|
| Outcomes | Primary endpoint:
Secondary endpoints:
Supportive endpoint:
Assessments:
|
|
| Notes | Novartis funded the study and was involved in the study design, data collection and statistical analysis. | |
| Risk of bias | ||
| Bias | Authors' judgement | Support for judgement |
| Random sequence generation (selection bias) | Unclear risk | No information about sequence generation |
| Allocation concealment (selection bias) | Low risk | Allocation was performed centrally |
| Blinding of participants and personnel (performance bias) All outcomes | Low risk | Double‐blinded trial |
| Blinding of outcome assessment (detection bias) All outcomes | Low risk | Central review for primary analysis of progression‐free survival by an independent, masked committee |
| Incomplete outcome data (attrition bias) All outcomes | Low risk | All randomised patients accounted for in efficacy analysis according to the intention‐to‐treat principle. |
| Selective reporting (reporting bias) | Low risk | Except for one secondary endpoint, every endpoint stated in the study protocol was reported in the publication. |
| Other bias | Low risk | No other potential sources of bias found |
Pavel 2018 (1).
| Study characteristics | ||
| Methods | International (11 countries), multicentre, randomised, double‐blind, placebo‐controlled phase 3 companion study (TELECAST) 1:1:1 randomisation stratified by baseline u5‐HIAA levels Enrolment: April 2014 to April 2015 |
|
| Participants | Inclusion criteria
Exclusion criteria
Total patients: 76 Mean age (A vs. B vs. C): 62 vs. 64 vs. 63 Women, % (A vs. B vs. C): 50 vs. 44 vs. 40 SSA therapy at study entry, %:
|
|
| Interventions | Study group A (26/76): placebo, oral doses, three times per day for 12 weeks Study group B (25/76): telotristat ethyl 250 mg, oral doses, three times per day for 12 weeks Study group C (25/76): telotristat ethyl 500 mg, oral doses, three times per day for 12 weeks Patients continued to receive their baseline stable‐dose SSA therapy. Rescue short‐acting SSA use was allowed. After the study, all patients were offered treatment with telotristat ethyl 500 mg, three times per day in a 36‐week open‐label extension. |
|
| Outcomes | Primary endpoints:
Secondary endpoints:
Additional endpoint:
Assessments:
|
|
| Notes | Trial supported by Lexicon Pharmaceuticals, Inc. | |
| Risk of bias | ||
| Bias | Authors' judgement | Support for judgement |
| Random sequence generation (selection bias) | Unclear risk | No information given |
| Allocation concealment (selection bias) | Unclear risk | Nearly equal numbers of participants per study group |
| Blinding of participants and personnel (performance bias) All outcomes | Low risk | Double‐blind study design |
| Blinding of outcome assessment (detection bias) All outcomes | Unclear risk | The majority of endpoints were self‐reported. |
| Incomplete outcome data (attrition bias) All outcomes | Unclear risk | All randomised patients accounted for in safety analysis but 10 of 76 (13%) randomised patients were excluded from the u5‐HIAA which was the second primary endpoint. These excluded patients were from all three study groups. |
| Selective reporting (reporting bias) | Low risk | No study protocol available, but every stated endpoint was reported. |
| Other bias | Low risk | No other potential sources of bias found |
Pavlakis 2020.
| Study characteristics | ||
| Methods | Non‐comparative randomised open‐label parallel‐group phase II trial 2:1 randomisation to PRRT/CAPTEM (experimental arm) vs. PRRT (mNETs control) and CAPTEM (pNETS control) Enrolment: December 2015–November 2018 |
|
| Participants | Inclusion criteria
Total patients: 75 |
|
| Interventions | Experimental arm (33 mNETs and 19 pNETS/75): 7.8 GBq LuTate day 10, 8 weekly x 4, with twice a day oral CAP 750 mg/m2 on days 1‐14 & TEM 75 mg/m2 on days 10‐14, 8 wkly x 4 mNETs control (14/75): PRRT, 8 weekly x 4 pNETS control (9/75): CAPTEM, 8 weekly x 4 |
|
| Outcomes | Primary endpoint:
Secondary endpoints:
|
|
| Notes | ||
| Risk of bias | ||
| Bias | Authors' judgement | Support for judgement |
| Random sequence generation (selection bias) | Unclear risk | No information given |
| Allocation concealment (selection bias) | Unclear risk | No information given |
| Blinding of participants and personnel (performance bias) All outcomes | High risk | Open‐label trial |
| Blinding of outcome assessment (detection bias) All outcomes | Unclear risk | No information given |
| Incomplete outcome data (attrition bias) All outcomes | Unclear risk | No information given |
| Selective reporting (reporting bias) | Low risk | All stated endpoints were reported. |
| Other bias | Low risk | No other potential sources of bias found |
Phan 2015 (1).
| Study characteristics | ||
| Methods | Randomised, double‐blind, placebo‐controlled, parallel‐group, multicentre, phase 3 study
Duration: 96 weeks Computer‐generated randomisation, stratified by presence or absence of tumour progression at baseline and receipt or nonreceipt of previous therapies Conducted between June 2006 and April 2013 Subgroup analysis: Comparison of progression‐free survival and safety data for patients aged < 65 vs. > 65 years |
|
| Participants | Inclusion criteria
Exclusion criteria
Withdrawal
CLARINET overall population: Total patients: 204 Age (lanreotide vs. placebo): 63 vs. 62 Women, % (lanreotide vs. placebo): 48 vs. 48 Prior treatment for neuroendocrine tumour, % (lanreotide vs. placebo): 16 vs. 16 Primary tumour resected, % (lanreotide vs. placebo): 40 vs. 38 Origin of tumour:
Ki‐67 index, 0‐2%/3‐10%, % (lanreotide vs. placebo): 68/32 vs. 70/28 Hepatic tumour volume:
Subgroup analysis:
|
|
| Interventions | Intervention group (101/204): extended‐release aqueous‐gel formulation of lanreotide, 120 mg, without dose adjustment, deep subcutaneous injection, every 28 days to a maximum of 24 injections Control group (103/204): placebo (sodium chloride), deep subcutaneous injection, every 28 days to a maximum of 24 injections In case of disease progression while receiving placebo, patients crossed over to lanreotide. |
|
| Outcomes | Primary endpoint:
Secondary endpoints:
Exploratory endpoints:
Assessments:
|
|
| Notes | The study was designed, funded, and conducted by Ipsen in collaboration with the European Neuroendocrine Tumor Society and the UK and Ireland Neuroendocrine Tumour Society. | |
| Risk of bias | ||
| Bias | Authors' judgement | Support for judgement |
| Random sequence generation (selection bias) | Low risk | Computer‐generated randomisation lists were created by a statistician employed by the sponsor who was independent of the study. |
| Allocation concealment (selection bias) | Low risk | The blinded database was held at a third‐party contract clinical research organisation. |
| Blinding of participants and personnel (performance bias) All outcomes | Low risk | Double‐blinded study design. Independent health professionals prepared and administered injections. |
| Blinding of outcome assessment (detection bias) All outcomes | Unclear risk | Disease progression was assessed centrally, but it remained unclear whether it was performed by independent personnel. |
| Incomplete outcome data (attrition bias) All outcomes | Low risk | All randomised patients accounted for in ITT analysis |
| Selective reporting (reporting bias) | Low risk | Study protocol available. One secondary endpoint mentioned in the protocol was not reported as an endpoint in the publication, but was reported in the supplementary appendix. |
| Other bias | Low risk | No other potential sources of bias found |
Phan 2015 (2).
| Study characteristics | ||
| Methods | Randomised, double‐blind, placebo‐controlled, parallel‐group, multicentre, phase 3 study
Duration: 96 weeks Computer‐generated randomisation, stratified by presence or absence of tumour progression at baseline and receipt or nonreceipt of previous therapies Conducted between June 2006 and April 2013 Subgroup analysis: investigation on consistency of treatment effects of lanreotide compared with placebo for patients with pNET |
|
| Participants | Inclusion criteria
Exclusion criteria
Withdrawal
CLARINET overall population: Total patients: 204. Age (lanreotide vs. placebo): 63 vs. 62 Women, % (lanreotide vs. placebo): 48 vs. 48 Prior treatment for neuroendocrine tumour, % (lanreotide vs. placebo): 16 vs. 16 Primary tumour resected, % (lanreotide vs. placebo): 40 vs. 38 Origin of tumour:
Ki‐67 index, 0‐2%/3‐10%, % (lanreotide vs. placebo): 68/32 vs. 70/28 Hepatic tumour volume:
Subgroup analysis: Total patients: 91 Mean age, (lanreotide vs. placebo): 64 vs. 64 Hepatic tumour load > 25% (overall): 37% Previous surgery on the tumour (overall): 38% No previous treatment (overall): 77% |
|
| Interventions | Intervention group (CLARINET overall: 101/204; pNET subgroup: 42/91): extended‐release aqueous‐gel formulation of lanreotide, 120 mg, without dose adjustment, deep subcutaneous injection, every 28 days to a maximum of 24 injections Control group (CLARINET overall: 103/204; pNET subgroup: 49/91): placebo (sodium chloride), deep subcutaneous injection, every 28 days to a maximum of 24 injections In case of disease progression while receiving placebo, patients crossed over to lanreotide. |
|
| Outcomes | Primary endpoint:
Secondary endpoints:
Exploratory endpoints:
Assessments:
|
|
| Notes | The study was designed, funded, and conducted by Ipsen in collaboration with the European Neuroendocrine Tumor Society and the UK and Ireland Neuroendocrine Tumour Society. | |
| Risk of bias | ||
| Bias | Authors' judgement | Support for judgement |
| Random sequence generation (selection bias) | Low risk | Computer‐generated randomisation lists were created by a statistician employed by the sponsor who was independent of the study. |
| Allocation concealment (selection bias) | Low risk | The blinded database was held at a third‐party contract clinical research organisation. |
| Blinding of participants and personnel (performance bias) All outcomes | Low risk | Double‐blinded study design. Independent health professionals prepared and administered injections. |
| Blinding of outcome assessment (detection bias) All outcomes | Unclear risk | Disease progression was assessed centrally, but it remained unclear whether it was performed by independent personnel. |
| Incomplete outcome data (attrition bias) All outcomes | Low risk | All randomised patients accounted for in ITT analysis |
| Selective reporting (reporting bias) | Low risk | Study protocol available. One secondary endpoint mentioned in the protocol was not reported as an endpoint in the publication, but was reported in the supplementary appendix. |
| Other bias | Low risk | No other potential sources of bias found |
Pusceddu 2018.
| Study characteristics | ||
| Methods | Randomised, double‐blind, placebo‐controlled, parallel‐group, multicentre, phase 3 study
Duration: 96 weeks Computer‐generated randomisation, stratified by presence or absence of tumour progression at baseline and receipt or nonreceipt of previous therapies Conducted between June 2006 and April 2013 Evaluation on impact of diabetes on progression‐free survival in patients with advanced, nonfunctioning GEP‐NETs |
|
| Participants | Inclusion criteria
Exclusion criteria
Withdrawal
CLARINET overall population: Total patients: 204 Age (lanreotide vs. placebo): 63 vs. 62 Women, % (lanreotide vs. placebo): 48 vs. 48 Prior treatment for neuroendocrine tumour, % (lanreotide vs. placebo): 16 vs. 16 Primary tumour resected, % (lanreotide vs. placebo): 40 vs. 38 Origin of tumour:
Ki‐67 index, 0‐2%/3‐10%, % (lanreotide vs. placebo): 68/32 vs. 70/28 Hepatic tumour volume:
Subgroup analysis: Patients with diabetes mellitus (DM): 79 Patients without diabetes mellitus (N‐DM): 125 |
|
| Interventions | Intervention group (101/204): extended‐release aqueous‐gel formulation of lanreotide, 120 mg, without dose adjustment, deep subcutaneous injection, every 28 days to a maximum of 24 injections Control group (103/204): placebo (sodium chloride), deep subcutaneous injection, every 28 days to a maximum of 24 injections In case of disease progression while receiving placebo, patients crossed over to lanreotide. |
|
| Outcomes | Primary endpoint:
Secondary endpoints:
Exploratory endpoints:
Assessments:
|
|
| Notes | The study was designed, funded, and conducted by Ipsen in collaboration with the European Neuroendocrine Tumor Society and the UK and Ireland Neuroendocrine Tumour Society. | |
| Risk of bias | ||
| Bias | Authors' judgement | Support for judgement |
| Random sequence generation (selection bias) | Low risk | Computer‐generated randomisation lists were created by a statistician employed by the sponsor who was independent of the study. |
| Allocation concealment (selection bias) | Low risk | The blinded database was held at a third‐party contract clinical research organisation. |
| Blinding of participants and personnel (performance bias) All outcomes | Low risk | Double‐blinded study design. Independent health professionals prepared and administered injections. |
| Blinding of outcome assessment (detection bias) All outcomes | Unclear risk | Disease progression was assessed centrally, but it remained unclear whether it was performed by independent personnel. |
| Incomplete outcome data (attrition bias) All outcomes | Low risk | All randomised patients accounted for in ITT analysis |
| Selective reporting (reporting bias) | Low risk | Study protocol available. One secondary endpoint mentioned in the protocol was not reported as an endpoint in the publication, but was reported in the supplementary appendix. |
| Other bias | Low risk | No other potential sources of bias found |
Raymond 2011 (1).
| Study characteristics | ||
| Methods | Multinational, randomised, double‐blind, placebo‐controlled phase 3 trial
1:1 randomisation ratio by centralised internet/telephone registration system (IMPALA), balanced by country/region Start: June 2007 Closed: April 2009 (discontinuation because of the greater number of deaths and serious adverse events in the placebo group and the difference in progression‐free survival favouring sunitinib) |
|
| Participants | Inclusion criteria:
Exclusion criteria:
Total patients: 171 Median age (sunitinib vs. placebo): 56 vs. 57 Women % (sunitinib vs. placebo): 51 vs. 53 Ethnicity (sunitinib vs. placebo): 56% white vs. 62% white Geographic region (sunitinib vs. placebo): 69% Europe vs. 66% Europe ECOG performance status 0 (sunitinib vs. placebo): 62% vs. 48% Nonfunctional tumours % (sunitinib vs. placebo): 49 vs. 52 Liver metastases, % (sunitinib vs. placebo): 95 vs. 94 Ki‐67 index ≤ 2%/≻ 2%‐5%/≻ 5%‐10%/≻ 10%/not reported, % (sunitinib vs. placebo): 8/19/6/9/58 vs. 7/16/12/7/58 Previous treatment for NET:
|
|
| Interventions | Intervention group (86/171): once‐daily oral sunitinib at a dose of 37.5 mg per day Control group (85/171): once‐daily oral matching placebo per day Treatment interruptions and a dose reduction to 25 mg per day were permitted to manage adverse events, with a subsequent increase in dose if toxicity of grade 2 or higher did not recur. The dose could be increased up to 50 mg per day, if 1) there was no objective tumour response, and 2) patients had grade 1 or lower non‐haematologic or grade 2 or lower haematologic treatment‐related adverse events during the first 8 weeks. Treatment continued until RECIST‐defined progression was documented, unacceptable adverse events occurred, or the patient died. Patients with disease progression while receiving placebo could enter an open‐label sunitinib extension protocol. Patients could receive somatostatin analogues at the investigator's discretion. |
|
| Outcomes | Primary endpoint: progression‐free survival Secondary endpoints: overall survival, objective response rate (RECIST), time to tumour response, duration of response, safety, patient‐reported outcomes (QLQ‐C30, version 3.0) Assessments:
|
|
| Notes | Funding: Pfizer | |
| Risk of bias | ||
| Bias | Authors' judgement | Support for judgement |
| Random sequence generation (selection bias) | Low risk | Done by centralised internet/telephone registration system. Balanced by country/region |
| Allocation concealment (selection bias) | Low risk | Centralised allocation system used |
| Blinding of participants and personnel (performance bias) All outcomes | Low risk | Double‐blinded trial design with same schemes for each study group |
| Blinding of outcome assessment (detection bias) All outcomes | Unclear risk | No sufficient information given |
| Incomplete outcome data (attrition bias) All outcomes | Low risk | All participants accounted for in final analysis. Equal numbers (n = 3) in each arm did not receive allocated treatment. |
| Selective reporting (reporting bias) | Low risk | Data collection and statistical analysis were performed by the sponsor. Every study protocol mentioned endpoint was published. |
| Other bias | Low risk | No other potential sources of bias found |
Raymond 2011 (2).
| Study characteristics | ||
| Methods | Multinational, randomised, double‐blind, placebo‐controlled phase 3 trial
1:1 randomisation ratio by centralised internet/telephone registration system (IMPALA), balanced by country/region Start: June 2007 Closed: April 2009 (discontinuation because of the greater number of deaths and serious adverse events in the placebo group and the difference in progression‐free survival favouring sunitinib) |
|
| Participants | Inclusion criteria:
Exclusion criteria:
Total patients: 171 Median age (sunitinib vs. placebo): 56 vs. 57 Women % (sunitinib vs. placebo): 51 vs. 53 Ethnicity (sunitinib vs. placebo): 56% white vs. 62% white Geographic region (sunitinib vs. placebo): 69% Europe vs. 66% Europe ECOG performance status 0 (sunitinib vs. placebo): 62% vs. 48% Nonfunctional tumours % (sunitinib vs. placebo): 49 vs. 52 Liver metastases, % (sunitinib vs. placebo): 95 vs. 94 Ki‐67 index ≤ 2%/≻ 2%‐5%/≻ 5%‐10%/≻ 10%/not reported, % (sunitinib vs. placebo): 8/19/6/9/58 vs. 7/16/12/7/58 Previous treatment for NET:
Subgroup analysis:
|
|
| Interventions | Intervention group (86/171): once‐daily oral sunitinib at a dose of 37.5 mg per day Control group (85/171): once‐daily oral matching placebo per day Treatment interruptions and a dose reduction to 25 mg per day were permitted to manage adverse events, with a subsequent increase in dose if toxicity of grade 2 or higher did not recur. The dose could be increased up to 50 mg per day, if 1) there was no objective tumour response, and 2) patients had grade 1 or lower non‐haematologic or grade 2 or lower haematologic treatment‐related adverse events during the first 8 weeks. Treatment continued until RECIST‐defined progression was documented, unacceptable adverse events occurred, or the patient died. Patients with disease progression while receiving placebo could enter an open‐label sunitinib extension protocol. Patients could receive somatostatin analogues at the investigator's discretion. |
|
| Outcomes | Primary endpoint: progression‐free survival Secondary endpoints: overall survival, objective response rate (RECIST), time to tumour response, duration of response, safety, patient‐reported outcomes (QLQ‐C30, version 3.0) Aims of subgroup analysis:
Assessments:
|
|
| Notes | Funding: Pfizer | |
| Risk of bias | ||
| Bias | Authors' judgement | Support for judgement |
| Random sequence generation (selection bias) | Low risk | Done by centralised internet/telephone registration system. Balanced by country/region |
| Allocation concealment (selection bias) | Low risk | Centralised allocation system used |
| Blinding of participants and personnel (performance bias) All outcomes | Low risk | Double‐blinded trial design with same schemes for each study group |
| Blinding of outcome assessment (detection bias) All outcomes | Unclear risk | No sufficient information given |
| Incomplete outcome data (attrition bias) All outcomes | Low risk | All participants accounted for in final analysis. Equal numbers (n = 3) in each arm did not receive allocated treatment. |
| Selective reporting (reporting bias) | Low risk | Data collection and statistical analysis were performed by the sponsor. Every study protocol mentioned endpoint was published. |
| Other bias | Low risk | No other potential sources of bias found |
Rinke 2009.
| Study characteristics | ||
| Methods | Randomised, double‐blind, placebo‐controlled trial
Central, computer‐generated 1:1 randomisation, stratified by study centre, tumour functionality, presence of distant metastases (liver or elsewhere), Ki‐67 index and age Start of enrolment: March 2001 Enrolment closed: January 2008 |
|
| Participants | Inclusion criteria
Exclusion criteria
Total patients: 85 Median age (octreotide LAR vs. placebo): 63.5 vs. 61 Women % (octreotide LAR vs. placebo): 52% vs. 47% Karnofsky performance status > 80 % (octreotide LAR vs. placebo): 83% vs. 88% Ki‐67 up to 2%, % (octreotide LAR vs. placebo): 97.6 vs. 93 Liver involvement, % (octreotide LAR vs. placebo): 83.3 vs. 88.4 Carcinoid syndrome, % (octreotide LAR vs. placebo): 40.5 vs. 37.2 Resection of primary tumour, % (octreotide LAR vs. placebo): 69 vs. 63 Unknown site of primary tumour, % (overall): 25% |
|
| Interventions | Intervention arm (42/85): octreotide LAR, 30 mg, intramuscularly, every 28 days Control arm (43/85): placebo (sodium chloride), intramuscularly, every 28 days Length of therapy: until CT‐ or MRI‐documented tumour progression Additional antiproliferative therapy was not allowed. Poststudy treatment in patients with tumour progression was at the discretion of the investigator. |
|
| Outcomes | Primary endpoint:
Secondary endpoints:
|
|
| Notes | Research funding through Novartis | |
| Risk of bias | ||
| Bias | Authors' judgement | Support for judgement |
| Random sequence generation (selection bias) | Low risk | Computer‐generated, stratified randomisation |
| Allocation concealment (selection bias) | Low risk | Central allocation |
| Blinding of participants and personnel (performance bias) All outcomes | Low risk | Double‐blinded trial. Same application schemes for each study arm |
| Blinding of outcome assessment (detection bias) All outcomes | Low risk | All clinical assessments were performed without knowledge of the assigned treatment. |
| Incomplete outcome data (attrition bias) All outcomes | Low risk | All randomised patients accounted for in ITT analysis 2/42 of patients in the study arm and 1/43 in the placebo arm were censored for conservative ITT analysis. 12/42 of patients in the study arm and 3/43 in the placebo arm were censored for per‐protocol analysis. |
| Selective reporting (reporting bias) | Low risk | No study protocol available, but every endpoint mentioned in the 'methods' section was mentioned in the 'results' section. The timing of the assessment for most endpoints was unclear. Progression‐free survival and overall survival were both reported. |
| Other bias | Low risk | No other potential sources of bias found |
Sakata 2006.
| Study characteristics | ||
| Methods | Randomisation according to a table of random permutations Start: 1993 Closed: 2002 Follow‐up: > 3 years |
|
| Participants | Inclusion criteria
Total patients: 15 Mean age (group 1 vs. 2): 60.2 vs. 62.6 Women, % (1 vs. 2): 43 vs. 38 Carcinoid symptoms (overall): 0% Tumour grade: not reported Metastatic disease: not reported Previous treatment for NET: not reported |
|
| Interventions | Group 1 (7/15): endoscopic mucosal resection, snare with a conventional single‐channel colonoscopy Group 2 (8/15): endoscopic resection, ligation device |
|
| Outcomes | Endpoints:
Assessments: not reported |
|
| Notes | ||
| Risk of bias | ||
| Bias | Authors' judgement | Support for judgement |
| Random sequence generation (selection bias) | Low risk | According to a table of random permutations |
| Allocation concealment (selection bias) | Unclear risk | No information given |
| Blinding of participants and personnel (performance bias) All outcomes | High risk | Personnel not blinded; unclear, if participants were blinded |
| Blinding of outcome assessment (detection bias) All outcomes | High risk | No evidence for independent assessment |
| Incomplete outcome data (attrition bias) All outcomes | Low risk | All patients accounted for in final analysis |
| Selective reporting (reporting bias) | Unclear risk | No study protocol available |
| Other bias | Low risk | No other potential sources of bias found |
Salazar 2018.
| Study characteristics | ||
| Methods | Randomised, phase II trial Randomisation: 1:1 |
|
| Participants | Inclusion criteria:
Total patients: 62 Median age (BEZ235 vs. everolimus): 56 vs. 57 Women % (BEZ235 vs. everolimus): 45 vs. 52 ECOG performance status 0‐1 (BEZ235 vs. everolimus): 97% vs. 100% Functional tumours: not reported Tumour grade: not reported Every patient had 2 prior therapy regimens. |
|
| Interventions | Study arm 1 (31/62): oral BEZ235 400 mg, twice daily Study arm 2 (31/62): oral everolimus 10 mg, once daily |
|
| Outcomes | Primary endpoint:
Secondary endpoints:
|
|
| Notes |
|
|
| Risk of bias | ||
| Bias | Authors' judgement | Support for judgement |
| Random sequence generation (selection bias) | Unclear risk | No information given |
| Allocation concealment (selection bias) | Unclear risk | No information given |
| Blinding of participants and personnel (performance bias) All outcomes | High risk | Different schemes for study drug intake |
| Blinding of outcome assessment (detection bias) All outcomes | Unclear risk | No information given |
| Incomplete outcome data (attrition bias) All outcomes | Low risk | All participants accounted for in final analysis |
| Selective reporting (reporting bias) | Low risk | No protocol available, but all outcomes stated in the paper as measured were reported. |
| Other bias | Low risk | No other potential sources of bias found |
Saslow 1998.
| Study characteristics | ||
| Methods | Single‐centre, randomised, double‐blind trial 1:1:1 randomisation Duration: 4 weeks |
|
| Participants | Inclusion criteria
Exclusion criteria
Total patients: 26 Mean age (0.1 vs. 0.5 vs. 2.0): 65 vs. 65 vs. 71 Women, % (0.1 vs. 0.5 vs. 2.0): 38 vs. 66 vs. 22 Metastases in abdominal nodes or liver, % (0.1 vs. 0.5 vs. 2.0): 100 vs. 100 vs. 100 Urinary 5‐hydroxyindoleacetic acid concentration, mg/24‐h (0.1 vs. 0.5 vs. 2.0): 37 vs. 12 vs. 32 |
|
| Interventions | Group 0.1 (8/26): placebo for 1 week, followed by alosetron 0.1 mg twice daily as two tablets with breakfast and dinner Group 0.5 (9/26): placebo for 1 week, followed by alosetron 0.5 mg twice daily as two tablets with breakfast and dinner Group 2.0 (9/26): placebo for 1 week, followed by alosetron 2.0 mg twice daily as two tablets with breakfast and dinner During the 24‐h test period, caffeine‐free drinks were allowed; cigarette smoking was not permitted. |
|
| Outcomes | Primary endpoints:
Secondary endpoints:
Assessments:
|
|
| Notes | ||
| Risk of bias | ||
| Bias | Authors' judgement | Support for judgement |
| Random sequence generation (selection bias) | Unclear risk | No information given |
| Allocation concealment (selection bias) | Unclear risk | No information given |
| Blinding of participants and personnel (performance bias) All outcomes | Low risk | Double‐blind trial design |
| Blinding of outcome assessment (detection bias) All outcomes | Unclear risk | No information given |
| Incomplete outcome data (attrition bias) All outcomes | Unclear risk | 24 of 26 patients had evaluable data. |
| Selective reporting (reporting bias) | Low risk | No study protocol available, but all stated endpoints were reported. |
| Other bias | Low risk | No other potential sources of bias found |
Singh 2018 (1).
| Study characteristics | ||
| Methods | International, multicentre, randomised, double‐blind, placebo‐controlled, phase 3 study
2:1 randomisation by interactive voice response systems, stratified by 1) previous somatostatin analogue treatment for at least 12 weeks, 2) tumour origin (stratum A: appendix, caecum, jejunum, ileum, duodenum, or neuroendocrine tumour of unknown primary origin vs. stratum B: lung, stomach, colon or rectum, and 3) WHO performance status (0 vs. 1). Start enrolment: April 2012 Closed enrolment: August 2013 Subgroup analysis: effect of everolimus in patients with advanced, progressive, nonfunctional GI or unknown primary NET |
|
| Participants | Inclusion criteria
Exclusion criteria
RADIANT‐4 overall population Total patients: 302 Age (everolimus vs. placebo): 65 vs. 60 Women, % (everolimus vs. placebo): 57 vs. 45 WHO performance status 0, % (everolimus vs. placebo): 73 vs. 75 Tumour grade 1, % (everolimus vs. placebo): 63 vs. 67 Primary tumour site, %:
Liver involvement, % (everolimus vs. placebo): 80 vs. 78 Previous treatment, %:
Subgroup analysis: gastrointestinal tract Total patients: 175 Age (everolimus vs. placebo): 63 vs. 60 Women, % (everolimus vs. placebo): 59 vs. 46 WHO performance status 0, % (everolimus vs. placebo): 75 vs. 84 Tumour grade 1, % (everolimus vs. placebo): 74 vs. 77 Primary tumour site, %:
Without liver involvement, % (everolimus vs. placebo): 14 vs. 11 Previous treatment, %:
Subgroup analysis: unknown primary Total patients: 36 Age (everolimus vs. placebo): 61 vs. 54 Women, % (everolimus vs. placebo): 65 vs. 46 WHO performance status 0, % (everolimus vs. placebo): 61 vs. 54 Tumour grade 1, % (everolimus vs. placebo): 65 vs. 62 Primary tumour site, %:
Without liver involvement, % (everolimus vs. placebo): 9 vs. 23 Previous treatment, %:
|
|
| Interventions | Study group (203/302): oral everolimus, 10 mg per day Control group (97/302): identical placebo Duration of treatment: until 1) documented radiological disease progression, 2) start of new cancer therapy, 3) development of an intolerable adverse event, or 4) withdrawal of consent Allowed:
Not allowed:
Exceptions:
|
|
| Outcomes | Primary endpoint:
Secondary endpoints:
Assessments:
|
|
| Notes | Trial sponsored by Novartis Pharmaceuticals Corporation | |
| Risk of bias | ||
| Bias | Authors' judgement | Support for judgement |
| Random sequence generation (selection bias) | Low risk | Stratified randomisation by interactive voice response systems |
| Allocation concealment (selection bias) | Low risk | Randomisation centrally managed by Novartis Pharmaceutical |
| Blinding of participants and personnel (performance bias) All outcomes | Low risk | Participants and personnel were blinded. Study drugs looked identical. Assessments were the same in both groups. |
| Blinding of outcome assessment (detection bias) All outcomes | Low risk | Central radiology review, masked to treatment |
| Incomplete outcome data (attrition bias) All outcomes | Low risk | All patients were included in the full analysis set. |
| Selective reporting (reporting bias) | High risk | Not all endpoints reported in the study protocol were published. |
| Other bias | Low risk | No other potential sources of bias found |
Soulen 2020.
| Study characteristics | ||
| Methods | Prospective randomised controlled trial | |
| Participants | Inclusion criteria
Total patients: not reported (first safety report) |
|
| Interventions | Study arm 1: bland embolisation. Study arm 2: cTACE (conventional transarterial chemoembolisation) Study arm 3: DEB‐TACE (drug‐eluting bead transarterial chemoembolisation) |
|
| Outcomes | Endpoint:
|
|
| Notes | ||
| Risk of bias | ||
| Bias | Authors' judgement | Support for judgement |
| Random sequence generation (selection bias) | Unclear risk | No information given |
| Allocation concealment (selection bias) | Unclear risk | No information given |
| Blinding of participants and personnel (performance bias) All outcomes | Unclear risk | No information given |
| Blinding of outcome assessment (detection bias) All outcomes | Low risk | Blinded review was performed by independent oncologists. |
| Incomplete outcome data (attrition bias) All outcomes | Unclear risk | No information given |
| Selective reporting (reporting bias) | Low risk | The stated endpoint was reported. |
| Other bias | Low risk | No other potential sources of bias found |
Strosberg 2011.
| Study characteristics | ||
| Methods | International, multicentre, double‐blind, phase 3 study
Randomisation:
Start: July 2007 Closed: May 2009 |
|
| Participants | Inclusion criteria:
Exclusion criteria:
RADIANT‐3 overall population:
|
|
| Interventions | Intervention group (207/410): oral everolimus, at a dose of 10 mg once daily, in conjunction with best supportive care (e.g. somatostatin analogue therapy) Control group (203/410): oral matching placebo in conjunction with best supportive care (e.g. somatostatin analogue therapy) Length of treatment: until progression of the disease, development of an unacceptable toxic effect, drug interruption for 3 weeks or longer, or withdrawal of consent Patients who had been assigned to placebo initially could switch to open‐label everolimus after documented progression of disease (RECIST). Doses were delayed/reduced if patients had clinically significant adverse events that were considered to be related to the study treatment. |
|
| Outcomes | Primary endpoint:
Secondary endpoints:
Subgoup analysis:
Assessments:
Data collection: sponsor's data management Data analysis: sponsor's statistical team |
|
| Notes | Funding/Sponsor: Novartis Oncology | |
| Risk of bias | ||
| Bias | Authors' judgement | Support for judgement |
| Random sequence generation (selection bias) | Low risk | Centralised randomisation through interactive voice response system. Stratified by performance status and prior treatment (+/‐ chemotherapy) |
| Allocation concealment (selection bias) | Low risk | Centralised randomisation |
| Blinding of participants and personnel (performance bias) All outcomes | Low risk | Double‐blinded trial design with same schemes for each study group |
| Blinding of outcome assessment (detection bias) All outcomes | Low risk | Endpoints were documented by the local investigator according to RECIST, with independent adjudicated central assessment. |
| Incomplete outcome data (attrition bias) All outcomes | Low risk | All participants accounted for in final analysis |
| Selective reporting (reporting bias) | Unclear risk | Not all secondary endpoints mentioned in the study protocol were published in the main study (Yao 2011), but one secondary endpoint was analysed as an exploratory endpoint in this study. |
| Other bias | Low risk | No other potential sources of bias found |
Strosberg 2017.
| Study characteristics | ||
| Methods | International multicentre, open‐label, randomised phase 3 trial
1:1 randomisation performed with a centralised permuted block randomisation scheme, stratified by highest tumour uptake score on somatostatin receptor scintigraphy and the length of time that a patient had been receiving a constant dose of octreotide Start: September 2012 Closed: January 2016 |
|
| Participants | Inclusion criteria
Exclusion criteria
Total patients: 229 Age (177Lu‐Dotatate group vs. control group): 63 vs. 64 Women, % (177Lu‐Dotatate group vs. control group): 46 vs. 53 Primary tumour site:
Previous surgical resection, % (177Lu‐Dotatate group vs. control group): 78 vs. 82 Previous systemic therapy other than SSA, % (177Lu‐Dotatate group vs. control group): 41 vs. 45 Liver metastases (177Lu‐Dotatate group vs. control group): 84 vs. 83 Low‐grade tumours (Ki‐67 of 0 to 2%) (177Lu‐Dotatate group vs. control group): 66% vs. 72%. Functional tumours: not reported |
|
| Interventions |
177Lu‐Dotatate group (116/229): 177Lu‐Dotatate, 7.4 GBq (200 mCi), intravenously over a period of 30 minutes, four infusions every 8 weeks, unless 1) unacceptable toxic effects occurred, 2) centrally confirmed disease progression was present on imaging, 3) the patient was unable or unwilling to adhere to trial procedures, 4) the patient withdrew consent, or 5) the patient died. For renal protection, an intravenous amino acid solution was administered concomitantly. And octreotide LAR at a dose of 30 mg every 4 weeks, intramuscularly at a dose of 30 mg, approximately 24 hours after each infusion of 177Lu‐Dotatate Control group (113/229): high‐dose octreotide LAR, at a dose of 60 mg, intramuscularly every 4 weeks Subcutaneous rescue injections of octreotide in the event of hormonal symptoms associated with their carcinoid syndrome were allowed in both groups. |
|
| Outcomes | Primary endpoint:
Secondary endpoints:
Assessments:
|
|
| Notes | Trial sponsored and designed by Advanced Accelerator Applications | |
| Risk of bias | ||
| Bias | Authors' judgement | Support for judgement |
| Random sequence generation (selection bias) | Low risk | Stratified 1:1 randomisation performed with a centralised permuted block randomisation scheme |
| Allocation concealment (selection bias) | Low risk | Centralised randomisation |
| Blinding of participants and personnel (performance bias) All outcomes | High risk | Open‐label trial |
| Blinding of outcome assessment (detection bias) All outcomes | Low risk | CT and MRI images were reviewed by independent central reviewers. |
| Incomplete outcome data (attrition bias) All outcomes | Low risk | All randomised patients were included in the analyses of efficacy, demographics, and baseline characteristics. Safety analyses, were performed with all randomised patients who received at least one dose of trial treatment. |
| Selective reporting (reporting bias) | High risk | Study protocol available. Not all secondary outcomes were reported. |
| Other bias | Low risk | No other potential sources of bias found |
Strosberg 2020.
| Study characteristics | ||
| Methods | International multicentre, open‐label, randomised phase 3 trial
1:1 randomisation performed with a centralised permuted block randomisation scheme, stratified by highest tumour uptake score on somatostatin receptor scintigraphy and the length of time that a patient had been receiving a constant dose of octreotide Start: September 2012 Closed: January 2016 |
|
| Participants | Inclusion criteria
Exclusion criteria
Total patients: 229 Age (177Lu‐Dotatate group vs. control group): 63 vs. 64 Women, % (177Lu‐Dotatate group vs. control group): 46 vs. 53 Primary tumour site:
Previous surgical resection, % (177Lu‐Dotatate group vs. control group): 78 vs. 82 Previous systemic therapy other than SSA, % (177Lu‐Dotatate group vs. control group): 41 vs. 45 Liver metastases (177Lu‐Dotatate group vs. control group): 84 vs. 83 Low‐grade tumours (Ki‐67 of 0 to 2%) (177Lu‐Dotatate group vs. control group): 66% vs. 72% Functional tumours: not reported |
|
| Interventions |
177Lu‐Dotatate group (116/229): 177Lu‐Dotatate, 7.4 GBq (200 mCi), intravenously over a period of 30 minutes, four infusions every 8 weeks, unless 1) unacceptable toxic effects occurred, 2) centrally confirmed disease progression was present on imaging, 3) the patient was unable or unwilling to adhere to trial procedures, 4) the patient withdrew consent, or 5) the patient died. For renal protection, an intravenous amino acid solution was administered concomitantly. And octreotide LAR at a dose of 30 mg every 4 weeks, intramuscularly at a dose of 30 mg, approximately 24 hours after each infusion of 177Lu‐Dotatate Control group (113/229): high‐dose octreotide LAR, at a dose of 60 mg, intramuscularly every 4 weeks Subcutaneous rescue injections of octreotide in the event of hormonal symptoms associated with their carcinoid syndrome were allowed in both groups. |
|
| Outcomes | Primary endpoint:
Secondary endpoints:
Assessments:
In this subgroup analysis, progression‐free survival was stratified by liver tumour burden, alkaline phosphatase elevation and presence or absence of a large target lesion (> 30 mm) at any site of the body on CT or MRI. |
|
| Notes | Trial sponsored and designed by Advanced Accelerator Applications | |
| Risk of bias | ||
| Bias | Authors' judgement | Support for judgement |
| Random sequence generation (selection bias) | Low risk | Stratified 1:1 randomisation performed with a centralised permuted block randomisation scheme |
| Allocation concealment (selection bias) | Low risk | Centralised randomisation |
| Blinding of participants and personnel (performance bias) All outcomes | High risk | Open‐label trial |
| Blinding of outcome assessment (detection bias) All outcomes | Low risk | CT and MRI images were reviewed by independent central reviewers. |
| Incomplete outcome data (attrition bias) All outcomes | Low risk | All randomised patients were included in the analyses of efficacy, demographics, and baseline characteristics. Safety analyses were performed with all randomised patients who received at least one dose of trial treatment. |
| Selective reporting (reporting bias) | High risk | Study protocol available. Not all secondary outcomes were reported. |
| Other bias | Low risk | No other potential sources of bias found |
Van Der Zwan 2018.
| Study characteristics | ||
| Methods | Two‐arm, randomised controlled, prospective, non‐blinded study Enrolment: 2006‐2013 |
|
| Participants | Inclusion criteria
Total patients: 111 |
|
| Interventions | Investigational arm (50/111): 29.6 GBq (800 mCi) 177Lu‐DOTATATE and capecitabine, 1650 mg/m2/day, two divided doses, for the first two weeks of each cycle starting on the morning of the day of administration of LuTate Control arm (61/111): 29.6 GBq (800 mCi) 177Lu‐DOTATATE |
|
| Outcomes | Endpoints:
|
|
| Notes | ||
| Risk of bias | ||
| Bias | Authors' judgement | Support for judgement |
| Random sequence generation (selection bias) | Unclear risk | No information given |
| Allocation concealment (selection bias) | Unclear risk | No information given |
| Blinding of participants and personnel (performance bias) All outcomes | High risk | Study was non‐blinded |
| Blinding of outcome assessment (detection bias) All outcomes | Unclear risk | No information given |
| Incomplete outcome data (attrition bias) All outcomes | Unclear risk | No information given |
| Selective reporting (reporting bias) | Low risk | All stated endpoints were reported. |
| Other bias | Low risk | No other potential sources of bias found |
Vinik 2016.
| Study characteristics | ||
| Methods | 3‐phase, multicentre study in 12 countries
1:1 randomisation using 2 computer‐generated lists (one for the U.S. and one for all other countries) stratified by previous treatment with any long‐ or short‐acting somatostatin analog or SSA‐naive patients Start: May 2009 End: May 2013 |
|
| Participants | Inclusion criteria
Exclusion criteria
Total patients: 115 Mean age (lanreotide vs. placebo): 58 vs. 59 Women, % (lanreotide vs. placebo): 54 vs. 62 Prior SSA therapy, % (lanreotide vs. placebo): 56 vs. 55 Short‐acting octreotide during screening, % (lanreotide vs. placebo): 51 vs. 52 |
|
| Interventions | Intervention group (59/115): lanreotide depot/autogel 120 mg, every 4 weeks by deep subcutaneous injection Control group (56/115): placebo (0.9% saline solution), every 4 weeks by deep subcutaneous injection Self‐injected subcutaneous short‐acting octreotide for symptom rescue at patients' discretion After ≥ 4 weeks in the double‐blind phase, patients could roll over into the open‐label phase if they used octreotide for ≥ 21 days of the 28‐day cycle and used a dose ≥ 300 μg/day for ≥ 14 of the 21 days. |
|
| Outcomes | Primary endpoint:
Secondary endpoints:
Assessments:
|
|
| Notes | Trial funded by Ipsen | |
| Risk of bias | ||
| Bias | Authors' judgement | Support for judgement |
| Random sequence generation (selection bias) | Low risk | Computer‐generated, stratified randomisation |
| Allocation concealment (selection bias) | Unclear risk | Insufficient information given |
| Blinding of participants and personnel (performance bias) All outcomes | Low risk | Double‐blinded trial design with same injection schedules |
| Blinding of outcome assessment (detection bias) All outcomes | Unclear risk | Patient‐reported results |
| Incomplete outcome data (attrition bias) All outcomes | Low risk | Efficacy analyses were performed with all randomised patients by an ITT principle. |
| Selective reporting (reporting bias) | Low risk | No study protocol available, but every stated endpoint was reported. |
| Other bias | Low risk | No other potential sources of bias found |
Wolin 2015.
| Study characteristics | ||
| Methods | Multicentre, randomised, blinded, efficacy and safety, phase III study
1:1 randomisation by interactive voice response system Treatment and evaluation period: 6 months for core study and up to 2 years (except in the UK) Enrolment: April 2008‐April 2012 |
|
| Participants | Inclusion criteria
Exclusion criteria
Total patients: 110 Median age (pasireotide LAR vs. octreotide LAR): 61 vs. 63 Women, % (pasireotide LAR vs. octreotide LAR): 45 vs. 40 Karnofsky performance status 80‐100/< 80/missing, % (pasireotide LAR vs. octreotide LAR): 93/6/2 vs. 88/11/2 Primary tumour site, %:
Grade, %:
Previous therapies, %:
Previous SSA treatment, %:
|
|
| Interventions | Group A (53/110): pasireotide LAR 60 mg, via intragluteal depot, every 28 days Group B (57/110): octreotide LAR 40 mg, via intragluteal depot, every 28 days Rescue medication was permitted after the first injection: pasireotide 600 μg bid SC for patients randomised to pasireotide LAR and octreotide 100 μg tid SC for patients randomised to octreotide LAR. Dose reductions to pasireotide LAR 40 mg and octreotide LAR 30 mg for safety and tolerability were allowed. Cross‐over to pasireotide after 6 months without benefit from octreotide was allowed for entry into the extension phase. |
|
| Outcomes | Primary endpoint:
Secondary endpoints:
Assessments:
|
|
| Notes | Study funded by Novartis Pharmaceuticals Corporation | |
| Risk of bias | ||
| Bias | Authors' judgement | Support for judgement |
| Random sequence generation (selection bias) | Low risk | Randomisation by interactive voice response system |
| Allocation concealment (selection bias) | Unclear risk | No information given |
| Blinding of participants and personnel (performance bias) All outcomes | Unclear risk | True double blinding was not feasible due to the different appearances of the LAR formulations. |
| Blinding of outcome assessment (detection bias) All outcomes | Unclear risk | No information given |
| Incomplete outcome data (attrition bias) All outcomes | Low risk | All randomised patients accounted for in ITT analysis |
| Selective reporting (reporting bias) | Low risk | No study protocol available, but every stated endpoint was reported. |
| Other bias | Low risk | No other potential sources of bias found |
Wolin 2016.
| Study characteristics | ||
| Methods | Randomised, double‐blind, placebo‐controlled, parallel‐group, multicentre, phase 3 study
Duration: 96 weeks Computer‐generated randomisation, stratified by presence or absence of tumour progression at baseline and receipt or nonreceipt of previous therapies Conducted between June 2006 and April 2013 Subgroup analysis: treatment effects within subgroups defined post hoc by baseline BMI |
|
| Participants | Inclusion criteria
Exclusion criteria
Withdrawal
CLARINET overall study population: Total patients: 204 Age (lanreotide vs. placebo): 63 vs. 62 Women, % (lanreotide vs. placebo): 48 vs. 48 Prior treatment for neuroendocrine tumour, % (lanreotide vs. placebo): 16 vs. 16 Primary tumour resected, % (lanreotide vs. placebo): 40 vs. 38 Origin of tumour:
Ki‐67 index, 0‐2%/3‐10%, % (lanreotide vs. placebo): 68/32 vs. 70/28 Hepatic tumour volume:
|
|
| Interventions | Intervention group (101/204): extended‐release aqueous‐gel formulation of lanreotide, 120 mg, without dose adjustment, deep subcutaneous injection, every 28 days to a maximum of 24 injections Control group (103/204): placebo (sodium chloride), deep subcutaneous injection, every 28 days to a maximum of 24 injections In case of disease progression while receiving placebo, patients crossed over to lanreotide. |
|
| Outcomes | Primary endpoint:
Secondary endpoints:
Exploratory endpoints:
Assessments:
|
|
| Notes | The study was designed, funded, and conducted by Ipsen in collaboration with the European Neuroendocrine Tumor Society and the UK and Ireland Neuroendocrine Tumour Society. | |
| Risk of bias | ||
| Bias | Authors' judgement | Support for judgement |
| Random sequence generation (selection bias) | Low risk | Computer‐generated randomisation lists were created by a statistician employed by the sponsor who was independent of the study. |
| Allocation concealment (selection bias) | Low risk | The blinded database was held at a third‐party contract clinical research organisation. |
| Blinding of participants and personnel (performance bias) All outcomes | Low risk | Double‐blinded study design. Independent health professionals prepared and administered injections. |
| Blinding of outcome assessment (detection bias) All outcomes | Unclear risk | Disease progression was assessed centrally, but it remained unclear whether it was performed by independent personnel. |
| Incomplete outcome data (attrition bias) All outcomes | Low risk | All randomised patients accounted for in ITT analysis |
| Selective reporting (reporting bias) | Low risk | Study protocol available. One secondary endpoint mentioned in the protocol was not reported as a endpoint in the publication, but was reported in the supplementary appendix. |
| Other bias | Low risk | No other potential sources of bias found |
Xu 2020 (ep).
| Study characteristics | ||
| Methods | Randomised, double‐blind, placebo‐controlled, phase 3 study
2:1 randomisation performed centrally using block randomisation; stratified by previous systemic anti‐tumour treatment for advanced disease, pathological grade and primary tumour site; implemented via an interactive web response system Enrolment: December 2015 to March 2019 |
|
| Participants | Inclusion criteria
Exclusion criteria
Total patients: 198 Age (surufatinib vs. placebo): 52 vs. 54 Women, % (surufatinib vs. placebo): 43 vs. 49 ECOG performance status 0, % (surufatinib vs. placebo): 56 vs. 67 Primary tumour site, %:
Ki‐67, %:
Functioning tumours, % (surufatinib vs. placebo): 4 vs. 3 Liver involvement, % (surufatinib vs. placebo): 75 vs. 77 Previous systematic anti‐tumour drug for advanced disease, % (surufatinib vs. placebo): 69 vs. 64
|
|
| Interventions | Intervention group (129/198): oral surufatinib 300 mg, once daily in 4‐week treatment cycles Control group (69/198): matching placebo, once daily in 4‐week treatment cycles Treatment duration: until disease progression or intolerable toxicity, withdrawal of patient consent, poor compliance, use of other anti‐tumour medication, pregnancy, loss to follow‐up, or if the investigator deemed discontinuation was in the patient's best interest At disease progression confirmed by the independent image reviewers, treatment assignments were unblinded, and patients who had been receiving placebo were permitted to switch to open‐label surufatinib. |
|
| Outcomes | Primary endpoint:
Secondary endpoints:
Supportive outcome:
Exploratory outcome:
Assessments:
|
|
| Notes | Trial funded by Hutchison MediPharma. The funder and authors were involved in the data collection, data analysis, interpretation of the results, and writing of the report. In the interim analysis, the results met the predefined criteria for early discontinuation of the study, therefore the trial was terminated on recommendation of the independent data monitoring committee. |
|
| Risk of bias | ||
| Bias | Authors' judgement | Support for judgement |
| Random sequence generation (selection bias) | Low risk | Stratified block randomisation implemented via an interactive web response system |
| Allocation concealment (selection bias) | Low risk | Randomisation was performed centrally and the allocation sequence was concealed. |
| Blinding of participants and personnel (performance bias) All outcomes | Low risk | Double‐blinded trial |
| Blinding of outcome assessment (detection bias) All outcomes | Unclear risk | Tumour assessment was done by investigators (primary endpoint), but scans were reviewed in parallel by a blinded independent image review committee (supportive outcome). |
| Incomplete outcome data (attrition bias) All outcomes | Unclear risk | Eight patients were excluded from the interim intention‐to‐treat set (three in the surufatinib group, five in the placebo group). |
| Selective reporting (reporting bias) | Low risk | Primary and secondary endpoints stated in the protocol were published, except overall survival (not mature at the time of interim analysis). A few exploratory endpoints stated in the protocol were not published. |
| Other bias | Low risk | No other potential sources of bias found |
Xu 2020 (p).
| Study characteristics | ||
| Methods | Randomised, double‐blind, placebo‐controlled, multicenter, phase 3 study
2:1 randomisation via an interactive web response system. Done centrally using stratified block randomisation, stratified by pathological grade, previous systemic anti‐tumour treatment, and ECOG performance status score Start: February 2016 Closed: November 2019 |
|
| Participants | Inclusion criteria:
Exclusion criteria:
Total patients: 172 Median age (surufatinib vs. placebo): 51 vs. 48 Women % (surufatinib vs. placebo): 47 vs. 53 ECOG performance status score 0 (surufatinib vs. placebo): 65% vs. 73% Functional tumours, % (surufatinib vs. placebo): 10 vs. 5 Ki‐67 index < 5%/5‐10%/> 10%, % (surufatinib vs. placebo): 35.5/50.5/14 vs. 35.5/52.5/12 Any previous systemic anti‐tumour treatment, % (surufatinib vs. placebo): 65 vs. 66 Previous SSA treatment, % (surufatinib vs. placebo): 42 vs. 47 Previous systemic chemotherapy, % (surufatinib vs. placebo): 29 vs. 20 Previous everolimus treatment, % (surufatinib vs. placebo): 11 vs. 7 Previous antiangiogenic treatment, % (surufatinib vs. placebo): 4 vs. 10
|
|
| Interventions | Intervention group (113/172): surufatinib, 300 mg, p.o., once per day, p.o., in consecutive 4‐week treatment cycles Control group (59/172): placebo, p.o., once per day, p.o., in consecutive 4‐week treatment cycles Length of treatment: until disease progression, intolerable toxicity, withdrawal of consent, poor compliance, use of other anti‐tumour medication, pregnancy, loss to follow‐up, or if the investigator deemed discontinuation in the patient's best interest Cross‐over to surufatinib was permitted for patients in the placebo group with disease progression. |
|
| Outcomes | Primary endpoint:
Secondary endpoints:
Exploratory endpoint:
Assessment:
|
|
| Notes |
|
|
| Risk of bias | ||
| Bias | Authors' judgement | Support for judgement |
| Random sequence generation (selection bias) | Low risk | Stratified randomisation via an interactive web response system |
| Allocation concealment (selection bias) | Low risk | Done centrally |
| Blinding of participants and personnel (performance bias) All outcomes | Low risk | Patients, investigators, research staff, and the sponsor study team were masked to treatment allocation. |
| Blinding of outcome assessment (detection bias) All outcomes | Low risk | Measurement of endpoints by investigator assessment, but also by a blinded independent image review committee |
| Incomplete outcome data (attrition bias) All outcomes | Low risk | All participants accounted for in final analysis |
| Selective reporting (reporting bias) | Unclear risk | The primary and secondary endpoints that were published corresponded to those in the study protocol. However, not all exploratory endpoints were published. |
| Other bias | Low risk | No other potential sources of bias found |
Yao 2008 (1).
| Study characteristics | ||
| Methods | Two‐stage random assignment phase II trial Enrolment: May 2002‐May 2003 |
|
| Participants | Inclusion criteria
Exclusion criteria
Total patients: 44 Mean age (study arm 1 vs. study arm 2): 55 vs. 55 Women, % (study arm 1 vs. study arm 2): 41 vs. 50 Primary tumour site, %:
Liver metastases, %:
|
|
| Interventions | Study arm 1 (22/44): PEG interferon alfa‐2b 0.5 mcg/kg subcutaneously once per week for 18 weeks Study arm 2 (22/44): bevacizumab 15 mg/kg intravenously once every 3 weeks for 18 weeks All patients continued depot octreotide at the prestudy dosage. After the completion of the 18‐week therapy, or at first evidence of disease progression, patients received both PEG interferon and bevacizumab. |
|
| Outcomes | Endpoints:
Assessments:
|
|
| Notes | Disclosures:
|
|
| Risk of bias | ||
| Bias | Authors' judgement | Support for judgement |
| Random sequence generation (selection bias) | Unclear risk | Insufficient information given |
| Allocation concealment (selection bias) | Unclear risk | No information regarding allocation concealment and identical numbers of patients in all treatment groups |
| Blinding of participants and personnel (performance bias) All outcomes | High risk | Different application intervals for each study arm, so at least study personnel were not blinded. |
| Blinding of outcome assessment (detection bias) All outcomes | Unclear risk | No evidence for independent assessment |
| Incomplete outcome data (attrition bias) All outcomes | Low risk | All patients accounted for response rate and progression‐free survival data. |
| Selective reporting (reporting bias) | Low risk | No study protocol available, but every endpoint was reported in 'results'. |
| Other bias | Low risk | No other potential sources of bias found |
Yao 2011.
| Study characteristics | ||
| Methods | International, multicentre, double‐blind, phase 3 study
Randomisation:
Start: July 2007 Closed: May 2009 |
|
| Participants | Inclusion criteria:
Exclusion criteria:
RADIANT‐3 overall population:
|
|
| Interventions | Intervention group (207/410): oral everolimus, at a dose of 10 mg once daily, in conjunction with best supportive care (e.g. somatostatin analogue therapy) Control group (203/410): oral matching placebo in conjunction with best supportive care ( e.g. somatostatin analogue therapy) Length of treatment: until progression of the disease, development of an unacceptable toxic effect, drug interruption for 3 weeks or longer, or withdrawal of consent Patients who had been assigned to placebo initially could switch to open‐label everolimus after documented progression of disease (RECIST). Doses were delayed/reduced if patients had clinically significant adverse events that were considered to be related to the study treatment. |
|
| Outcomes | Primary endpoint:
Secondary endpoints:
Assessments:
Data collection: sponsor's data management Data analysis: sponsor's statistical team |
|
| Notes | Funding/Sponsor: Novartis Oncology | |
| Risk of bias | ||
| Bias | Authors' judgement | Support for judgement |
| Random sequence generation (selection bias) | Low risk | Centralised randomisation through interactive voice response system. Stratified by performance status and prior treatment (+/‐ chemotherapy) |
| Allocation concealment (selection bias) | Low risk | Centralised randomisation |
| Blinding of participants and personnel (performance bias) All outcomes | Low risk | Double‐blinded trial design with same schemes for each study group |
| Blinding of outcome assessment (detection bias) All outcomes | Low risk | Endpoints were documented by the local investigator according to RECIST, with independent adjudicated central assessment. |
| Incomplete outcome data (attrition bias) All outcomes | Low risk | All participants accounted for in final analysis |
| Selective reporting (reporting bias) | Unclear risk | Not all secondary endpoints mentioned in the study protocol were published. |
| Other bias | Low risk | No other potential sources of bias found |
Yao 2016.
| Study characteristics | ||
| Methods | International, multicentre, randomised, double‐blind, placebo‐controlled, phase 3 study
2:1 randomisation by interactive voice response systems, stratified by 1) previous somatostatin analogue treatment for at least 12 weeks, 2) tumour origin (stratum A: appendix, caecum, jejunum, ileum, duodenum, or neuroendocrine tumour of unknown primary origin vs. stratum B: lung, stomach, colon or rectum, and 3) WHO performance status (0 vs. 1) Start enrolment: April 2012 Closed enrolment: August 2013 |
|
| Participants | Inclusion criteria
Exclusion criteria
Total patients: 302 Age (everolimus vs. placebo): 65 vs. 60 Women, % (everolimus vs. placebo): 57 vs. 45 WHO performance status 0, % (everolimus vs. placebo): 73 vs. 75 Tumour grade 1, % (everolimus vs. placebo): 63 vs. 67 Primary tumour site, %:
Liver involvement, % (everolimus vs. placebo): 80 vs. 78 Previous treatment, %:
|
|
| Interventions | Study group (203/302): oral everolimus, 10 mg per day Control group (97/302): identical placebo Duration of treatment: until 1) documented radiological disease progression, 2) start of new cancer therapy, 3) development of an intolerable adverse event, or 4) withdrawal of consent Allowed:
Not allowed:
Exceptions:
|
|
| Outcomes | Primary endpoint:
Secondary endpoints:
Assessments:
|
|
| Notes | Trial sponsored by Novartis Pharmaceuticals Corporation | |
| Risk of bias | ||
| Bias | Authors' judgement | Support for judgement |
| Random sequence generation (selection bias) | Low risk | Stratified randomisation by interactive voice response systems |
| Allocation concealment (selection bias) | Low risk | Randomisation centrally managed by Novartis Pharmaceutical |
| Blinding of participants and personnel (performance bias) All outcomes | Low risk | Participants and personnel were blinded. Study drugs looked identical. Assessments were the same in both groups. |
| Blinding of outcome assessment (detection bias) All outcomes | Low risk | Central radiology review, masked to treatment |
| Incomplete outcome data (attrition bias) All outcomes | Low risk | All patients were included in the full analysis set. |
| Selective reporting (reporting bias) | High risk | Not all endpoints reported in the study protocol were published. |
| Other bias | Low risk | No other potential sources of bias found |
Yao 2017.
| Study characteristics | ||
| Methods | Open‐label, phase III study 1:1 randomisation using a dynamic balancing algorithm by Pocock and Simon, stratified by primary site, progressive disease, grade, and prior octreotide (treatment within 2 months before registration vs none within 2 months) Enrolment: December 2007‐September 2012 |
|
| Participants | Inclusion criteria
Total patients: 402 Median age (study arm 1 vs. study arm 2): 61 vs. 61 Women, % (1 vs. 2): 49 vs. 55 Zubrod performance status 0/1/2, % (1 vs. 2): 54/44/3 vs. 49/49/2 Primary tumour site:
Grade 1/2, % (1 vs. 2): 84/15 vs. 85/15 Liver involvement, % (1 vs. 2): 86 vs. 86 Prior therapy:
Radiologic disease progression, % (1 vs. 2): 91 vs. 93 |
|
| Interventions | Study arm 1 (200/402): depot octreotide 20 mg intramuscularly on day 1 of each 21‐day cycle and bevacizumab 15 mg/kg intravenously on day 1 Study arm 2 (202/402): depot octreotide 20 mg intramuscularly on day 1 of each 21‐day cycle and 5 million units of interferon alfa‐2b three times per week as a subcutaneous injection |
|
| Outcomes | Primary endpoint:
Secondary endpoints:
Assessment:
|
|
| Notes | ||
| Risk of bias | ||
| Bias | Authors' judgement | Support for judgement |
| Random sequence generation (selection bias) | Low risk | Randomisation performed by dynamic balancing algorithm |
| Allocation concealment (selection bias) | Unclear risk | No information given |
| Blinding of participants and personnel (performance bias) All outcomes | High risk | Open‐label study |
| Blinding of outcome assessment (detection bias) All outcomes | Low risk | Blinded, central and independent radiology review was performed. |
| Incomplete outcome data (attrition bias) All outcomes | Low risk | All eligible patients were included in the ITT analysis. |
| Selective reporting (reporting bias) | Low risk | No study protocol available, but all endpoints stated in 'methods' were reported in 'results'. |
| Other bias | Low risk | No other potential sources of bias found |
Yao 2019.
| Study characteristics | ||
| Methods | International, multicentre, randomised, double‐blind, placebo‐controlled, phase 3 study
2:1 randomisation by interactive voice response systems, stratified by 1) previous somatostatin analogue treatment for at least 12 weeks, 2) tumour origin (stratum A: appendix, caecum, jejunum, ileum, duodenum, or neuroendocrine tumour of unknown primary origin vs. stratum B: lung, stomach, colon or rectum, and 3) WHO performance status (0 vs. 1) Start enrolment: April 2012 Closed enrolment: August 2013 |
|
| Participants | Inclusion criteria
Exclusion criteria
Core study:
Primary tumour site, %:
Previous treatment, %:
Subgroup analysis:
Primary tumour site, %:
Previous treatment, %:
|
|
| Interventions | Study group (core study: 203/302; subgroup analysis: 28/46): oral everolimus, 10 mg per day Control group (core study: 97/302; subgroup analysis: 18/46): identical placebo Duration of treatment: until 1) documented radiological disease progression, 2) start of new cancer therapy, 3) development of an intolerable adverse event, or 4) withdrawal of consent Allowed:
Not allowed:
Exceptions:
|
|
| Outcomes | Primary endpoint:
Secondary endpoints:
Assessments:
|
|
| Notes | Core study was sponsored by Novartis Pharmaceuticals Corporation. Novartis shared their data with researchers. | |
| Risk of bias | ||
| Bias | Authors' judgement | Support for judgement |
| Random sequence generation (selection bias) | Low risk | Stratified randomisation by interactive voice response systems |
| Allocation concealment (selection bias) | Unclear risk | Randomisation centrally managed by Novartis Pharmaceutical |
| Blinding of participants and personnel (performance bias) All outcomes | Low risk | Participants and personnel were blinded. Study drugs looked identical. Assessments were the same in both groups. |
| Blinding of outcome assessment (detection bias) All outcomes | Low risk | Central radiology review, masked to treatment |
| Incomplete outcome data (attrition bias) All outcomes | Low risk | All patients were included in the full analysis set. |
| Selective reporting (reporting bias) | High risk | Not all endpoints reported in the study protocol were published. Data was shared by core study sponsor. |
| Other bias | Low risk | No other potential sources of bias found |
Zhang 2020.
| Study characteristics | ||
| Methods | Investigator‐initiated, randomised, open‐label, phase 2 study 1:1 randomisation Enrolment: June 2017 to February 2019 |
|
| Participants | Inclusion criteria
Exclusion criteria
Total patients: 66 Age < 65/≥ 65, % (EP vs. IP): 55/46 vs. 52/49 Women, % (EP vs. IP): 33 vs. 27 ECOG performance score 0/1, % (EP vs. IP): 70/30 vs. 67/33 Primary tumour site, %:
Ki‐67 index < 55%/≥ 55%, % (EP vs. IP): 6/94 vs. 9/91 Morphology, %:
Surgery of primary tumour, % (EP vs. IP): 18 vs. 21 Liver metastases, % (EP vs. IP): 39 vs. 30 |
|
| Interventions | EP arm 1 (33/66): 100 mg/m2 of etoposide on days 1, 2, and 3 and cisplatin at a dose of 75 mg/m2 on day 1 of a 21‐day cycle IP arm 2 (33/66): 60 mg/m2 of irinotecan on days 1 and 8 and cisplatin at a dose of 60 mg/m2 on day 1 of a 21‐day cycle Treatment duration: 6 cycles or until disease progression, patient refusal, or the occurrence of unacceptable toxicity Maintenance irinotecan for patients on IP regimen who achieved objective response or stable disease after 6 cycles |
|
| Outcomes | Primary endpoint:
Secondary endpoints:
Assessments:
|
|
| Notes | ||
| Risk of bias | ||
| Bias | Authors' judgement | Support for judgement |
| Random sequence generation (selection bias) | Unclear risk | No information given |
| Allocation concealment (selection bias) | Unclear risk | No information given Identical number of patients in both study arms |
| Blinding of participants and personnel (performance bias) All outcomes | High risk | Open‐label study |
| Blinding of outcome assessment (detection bias) All outcomes | Unclear risk | No information given |
| Incomplete outcome data (attrition bias) All outcomes | High risk | 5 patients (2 in the EP arm and 3 in the IP arm) were excluded from the efficacy assessment. The planned size of the study population was 144 patients, but enrolment was terminated early (at 66 patients) because the premature analysis found similar responses in the two treatment arms. |
| Selective reporting (reporting bias) | Low risk | No study protocol available, but all endpoints stated were reported. |
| Other bias | Low risk | No other potential sources of bias found |
AE: adverse event ALT: alanine aminotransferase AST: aspartate aminotransferase BEZ235: dactolisib bid: two times a day BM: bowel movement BMI: body mass index CAP: capecitabine CapStrep: capecitabine and streptozocin CapStrepCis: capecitabine, streptozocin and cisplatin CAPTEM: capecitabine and temozolomide CgA: chromogranin A CT: computed tomography (c)TACE: (conventional) transarterial chemoembolization CUP: cancer of unknown primary DEB‐TACE: drug‐eluting bead transarterial chemoembolization DM: diabetes mellitus (d)u5‐HIAA: 24‐h urinary 5‐hydroxyindoleacetic acid excretion ECG: electrocardiogram ECOG: Eastern Cooperative Oncology Group ELECT: evaluation of lanreotide depot/autogel afficacy and safety as a carcinoid syndrome treatment EORTC: European Organization for Research and Treatment of Cancer EP: etoposide cisplatin G(1/2/3): grade (1/2/3) GBq: gigabecquerel GEP‐NEC: gastroenteropancreatic neuroendocrine carcinoma GEP‐NET: gastroenteropanreatic neuroendocrine tumour h: hour HACE: hepatic artery chemoembolization HAE: hepatic artery embolization HR: hazard ratio IFNα: interferon alpha IMPALA: centralised internet/telephone registration system IP: irinotecan cisplatin ITT: intention‐to‐treat IU: international unit i.v.: intravenous IVRS: interactive voice response system IWRS: interactive web response system Ki‐67: nuclear protein encoded by the MKI67 gene LAN: lanreotide LAR: long‐acting release mCi: millicurie MEN1: multiple endocrine neoplasia type 1 MiNEC: mixed neuroendocrine non‐neuroendocrine carcinoma (m)(p)NET: (midgut)/(pancreatic) neuroendocrine tumour MRI: magnetic resonance imaging mTOR: mammalian target of rapamycin MU: million units N‐DM: without diabetes mellitus NSE: neuron‐specific enolase PD: progressive disease PEG: pegylated PET: positron emission tomography PFS: progression‐free survival p.o.: peroral PRRT: peptide receptor radionuclide therapy PVA: polyvinyl alcohol q2: every second qd: once a day QLQ‐C30: quality of life questionnaire C30 QLQ‐GI.NET21: quality of life questionnaire ‐ neuroendocrine carcinoid module QT(c): corrected QT interval (time from the start of the Q wave to the end of the T wave) RADIANT: radiotherapy assessments during intervention and treatment RE: radio embolization RECIST: response evaluation criteria in solid tumours SC: subcutaneous SI: small intestinal SIR: sirtex SR: slow release SSA: somatostatin analogue TELECAST: telotristat ethyl in carcinoid syndrome TELESTAR: telotristat etiprate for somatostatin analogue not adequately controlled carcinoid syndrome TEM: temozolomide tid: three times a day (u)5‐HIAA: (urine) 5‐hydroxyindoleacetic acid VEGF(R): vascular endothelial growth factor (receptor) vs.: versus WHO: World Health Organization
Characteristics of excluded studies [ordered by study ID]
| Study | Reason for exclusion |
|---|---|
| Caplin 2014 | Not randomised controlled trial study design |
| Chan 2018 | Not randomised controlled trial study design |
| Cwikla 2017 | Not randomised controlled trial study design |
| Fazio 2018 | Not randomised controlled trial study design |
| Herrera Cabezón 2019 | Not investigating therapeutic procedures in NET |
| Hörsch 2018 | Not randomised controlled trial study design |
| Ito 2011 | Duplicate report |
| Kulke 2019 | Erratum (funding information added) |
| Lapuerta 2018 | Not randomised controlled trial study design |
| Meyer 2016 | Duplicate report |
| Miller 2020 | Not investigating therapeutic procedures in NET |
| Okusaka 2012 | Duplicate report |
| Pavel 2015 | Not randomised controlled trial study design |
| Pavel 2018 (2) | Not randomised controlled trial study design |
| Pavel 2018 (3) | Duplicate report |
| Phan 2017 | Not randomised controlled trial study design |
| Raderer 2015 | Not randomised controlled trial study design |
| Salazar 2015 | Not randomised controlled trial study design |
| Singh 2018 (2) | Not investigating therapeutic procedures in NET |
| Wolin 2013 | Not randomised controlled trial study design |
| Wolin 2018 | Not randomised controlled trial study design |
| Yao 2015 | Not randomised controlled trial study design |
NET: Neuroendocrine tumour
Characteristics of ongoing studies [ordered by study ID]
NCT01744249.
| Study name | NCT01744249 |
| Methods | Phase II/III, prospective, multicenter, randomized (1:1), double‐blind study. |
| Participants | Patients diagnosed with advanced G1‐G2 neuroendocrine tumors (WHO 2010) of nonpancreatic origin that have presented documented disease progression in the 12 months prior to entering the study. |
| Interventions | Experimental: axitinib + sandostatin LAR Placebo comparator: placebo + sandostatin LAR |
| Outcomes | Primary outcome: effectiveness of axitinib in terms of progression‐free survival. Secondary outcomes:
|
| Starting date | November 2011 |
| Contact information | |
| Notes |
NCT02246127.
| Study name | NCT02246127 |
| Methods | Randomized Open Label Study |
| Participants | Patients with advanced progressive pancreatic neuroendocrine tumours |
| Interventions | Active comparator: everolimus first (everolimus (10mg/daily, oral) followed by STZ‐5FU (injection/infusion; Moertel or Uppsala regime). Experimental: STZ‐5FU first (STZ‐5FU (injection/infusion; Moertel or Uppsala regime) followed by everolimus (10 mg/ daily, oral). |
| Outcomes | Primary outcome: first progression‐free survival (time frame: up to 84 weeks). Secondary outcomes:
|
| Starting date | 27 October 2014 |
| Contact information | |
| Notes |
NCT03049189.
| Study name | NCT03049189 |
| Methods | Prospective, randomised, controlled, open‐label, multicentre phase III study |
| Participants | Patients with inoperable, progressive, somatostatin receptor‐positive (SSTR+), neuroendocrine tumours of gastroenteric or pancreatic origin (GEP‐NET) |
| Interventions | Experimental: 177Lu‐edotreotide PRRT (maximum of four cycles of 7.5 ± 0.7 GBq) Active comparator: everolimus (10mg/d) |
| Outcomes | Primary outcome: progression‐free survival. Secondary outcome: overall survival. |
| Starting date | 2 February 2017 |
| Contact information | info@itm‐solucin.de |
| Notes |
G(1/2): grade (1/2) GBq: gigabecquerel GEP‐NET: gastroenteropanreatic neuroendocrine tumour LAR: long‐acting release PRRT: peptide receptor radionuclide therapy STZ‐5FU: streptozotocin‐fluorouracil SSTR+: somatostatin receptor‐positive WHO: World Health Organization
Differences between protocol and review
There are no differences between protocol and review.
Contributions of authors
Designing and writing the protocol: MAW, LB, MB and RMK
Co‐ordinating the protocol: RMK
Designing the search strategies: MAW and RMK
Title and abstract screening: MAW, AK, CAS, ERC, PR, RMK
Full‐text screening: MAW, AK, CAS, ERC, PR, RMK
Data extraction: AK, CAS, ERC, PR, RMK
Analysing data: CN, LB, RMK
Risk of bias: CN, MS, AK, CAS, ERC, PR, RMK
GRADE assessment: LB
All authors approved the final version of the protocol and the final manuscript.
Sources of support
Internal sources
No sources of support provided
External sources
-
National Institute for Health Research (NIHR), UK
Funding via Cochrane infrastructure to the Cochrane Gynaecological, Neuro‐oncology and Orphan Cancers Group.
Declarations of interest
Martin Alexander Walter: None known. Marko Spanjol: None known. Cédric Nesti: Meeting honoraria from IPSEN. Attila Kollár: Advisory board and meeting honoraria from IPSEN. Lukas Bütikofer: Affiliation with CTU Bern, University of Bern, which has a staff policy of not accepting honoraria or consultancy fees. However, CTU Bern is involved in design, conduct, or analysis of clinical studies funded by not‐for‐profit and for‐profit organizations. In particular, pharmaceutical and medical device companies provide direct funding to some of these studies. For an up‐to‐date list of CTU Bern’s conflicts of interest see http://www.ctu.unibe.ch/research/declaration_of_interest/index_eng.html. Viktoria L Gloy: None known. Rebecca Anne Dumont: None known. Christian A Seiler: None known. Emanuel R Christ: Advisory board honoraria from IPSEN, Novartis and Pfizer. Piotr Radojewski: None known. Matthias Briel: None known. Reto Martin Kaderli: Meeting honoraria from IPSEN.
These authors contributed equally to this work
These authors contributed equally to this work.
Affiliation since January 2020: Institute of Diagnostic and Interventional Neuroradiology, Bern University Hospital, Inselspital, University of Bern, Switzerland Freiburgstrasse 18, 3010 Bern, Switzerland
New
References
References to studies included in this review
Anthony 2012 {published data only}
- Anthony L, Singh N, Passos VQ, Pavel M, Oberg K, Yao JC. Impact of prior somatostatin analog use on PFS in the phase III radiant-2 trial of everolimus + octreotide lar vs placebo + octreotide lar in patients with advanced neuroendocrine tumors. Pancreas 2012;41:342. [DOI: 10.1097/MPA.0b013e3182433b9f] [DOI] [Google Scholar]
- Pavel ME, Hainsworth JD, Baudin E, Peeters M, Hörsch D, Winkler RE, Radiant-Study Group. Everolimus plus octreotide long-acting repeatable for the treatment of advanced neuroendocrine tumours associated with carcinoid syndrome (RADIANT-2): a randomised, placebo-controlled, phase 3 study. Lancet 2012;378(9808):2005-12. [DOI] [PubMed] [Google Scholar]
- Strosberg JR, Yao JC, Bajetta E, Aout M, Hainsworth JD, Bakker B, et al. Efficacy of octreotide long-acting repeatable (OCT) from the phase III RADIANT-2 study in patients with advanced neuroendocrine tumors (NET): A post-hoc analysis of the placebo (PBO) arm with updated survival data. Pancreas 2015;44:359. [DOI: 10.1097/MPA.0000000000000289] [DOI] [Google Scholar]
Arnold 2005 {published data only}
- Arnold R, Rinke A, Klose KJ, Muller HH, Wied M, Zamzow K, et al. Octreotide versus octreotide plus interferon-alpha in endocrine gastroenteropancreatic tumors: a randomized trial. Clinical Gastroenterolology and Hepatolology 2005;3(8):761-71. [DOI] [PubMed] [Google Scholar]
Bergsland 2020 {published data only}
- Bergsland E, Mahoney M, Asmis T, Hall N, Kumthekar P, Maitland M, et al. Randomized phase II trial of pazopanib versus placebo in patients (Pts) with progressive carcinoid tumors (CARC) (Alliance A021202). Pancreas 2020;49:464. [DOI: 10.1097/MPA.0000000000001516] [DOI] [Google Scholar]
- Bergsland EK, Mahoney MR, Asmis TR, Hall N, Kumthekar P, Maitland ML, et al. Prospective randomized phase II trial of pazopanib versus placebo in patients with progressive carcinoid tumors (CARC) (Alliance A021202). Journal of Clinical Oncology 2019;37(15_suppl):4005. [DOI: 10.1200/JCO.2019.37.15-suppl.4005] [DOI] [Google Scholar]
Caplin 2014 {published data only}
- Caplin ME, Pavel M, Cwikla JB, Phan AT, Raderer M, Sedlackova E, et al, Clarinet Investigators. Lanreotide in metastatic enteropancreatic neuroendocrine tumors. New England Journal of Medicine 2014;371(3):224-33. [DOI] [PubMed] [Google Scholar]
- Phan A, Caplin M, Pavel M, Cwikła J, Raderer M, Sedláčková E, et al. Relative risk analysis of safety profile of lanreotide autogel/depot vs. placebo in patients with pancreatic and intestinal neuroendocrine tumours. European Journal of Cancer 2015;51:S460. [EMBASE: 72067952] [Google Scholar]
- Phan AT, Caplin ME, Pavel ME, Cwikla JB, Raderer M, Sedlackova E, et al. Relative risk of adverse events with lanreotide depot/autogel (LAN) vs. Placebo (PBO) in patients with intestinal and pancreatic neuroendocrine tumors (NETs). Journal of Clinical Oncology 2015;33(15 SUPPL. 1):e15181. [EMBASE: 72012104] [Google Scholar]
- Phan AT, Dasari A, Liyanage N, Cox D, Pitman Lowenthal S, Wolin EM. Tumor response in the CLARINET study of lanreotide depot vs placebo in patients with metastatic gastroenteropancreatic neuroendocrine tumors (GEP-NETs). Journal of Clinical Oncology 2016;34(4 suppl):434. [DOI: 10.1200/jco.2016.34.4_ suppl.434] [Google Scholar]
- Regnault A, Ferrer L, Dinet J, Gabriel S, Pavel ME, Ruszniewski PB, et al. Health-related quality of life in CLARINET, a phase III trial of lanreotide autogel 120 mg in patients with non-functioning entero-pancreatic neuroendocrine tumour: Analytical challenges and statistical solutions. Quality of Life Research 2015;24:75. [EMBASE: 623526027] [Google Scholar]
- Ruszniewski P, Phan AT, Caplin ME, Pavel ME, Ćwikła JB, Raderer M, et al. Quality of life (QoL) with lanreotide autogel/depot (LAN) vs. placebo in patients with enteropancreatic neuroendocrine tumors: results from the CLARINET core study. 2015 Pancreas;44:357. [EMBASE: 620121000] [Google Scholar]
- Wolin EM, Caplin ME, Pavel ME, Ćwikla JB, Phan AT, Raderer M, et al. Multivariate analysis of progression-free survival in the CLARINET study of lanreotide autogel/depot vs placebo identifies prognostic factors in neuroendocrine tumors. Pancreas 2016;Conference: 8th Annual Meeting of the North American NeuroEndocrine Tumor Society. United States. 45(3):486. [EMBASE: 617770785] [Google Scholar]
- Wolin EM, Caplin ME, Pavel ME, Cwikla JB, Phan AT, Raderer M, et al. Prognostic factors for progression-free survival (PFS) in CLARINET study of lanreotide depot/autogel (LAN) vs placebo (PBO) in neuroendocrine tumors (NETs). Journal of Clinical Oncology 2015;33(15_suppl):e15180. [Google Scholar]
Castellano 2013 {published data only}
- Castellano D, Bajetta E, Panneerselvam A, Saletan S, Kocha W, O'Dorisio T, et al. Everolimus plus octreotide long-acting repeatable in patients with colorectal neuroendocrine tumors: a subgroup analysis of the phase III RADIANT-2 study. Oncologist 2013;18(1):46-53. [DOI] [PMC free article] [PubMed] [Google Scholar]
- Pavel ME, Hainsworth JD, Baudin E, Peeters M, Hörsch D, Winkler RE, et al. Everolimus plus octreotide long-acting repeatable for the treatment of advanced neuroendocrine tumours associated with carcinoid syndrome (RADIANT-2): a randomised, placebo-controlled, phase 3 study. Lancet 2011;378(9808):2005-12. [DOI] [PubMed] [Google Scholar]
Dasari 2015 {published data only}
- Caplin ME, Pavel M, Cwikla JB, Phan AT, Raderer M, Sedlackova E, et al. Lanreotide in metastatic enteropancreatic neuroendocrine tumors. New England Journal of Medicine 2014;371(3):224-33. [DOI] [PubMed] [Google Scholar]
- Dasari A, Phan AT, Caplin ME, Pavel ME, Cwikla JB, Raderer M, et al. Lanreotide depot/autogel (LAN) in patients with neuroendocrine tumors (NETs) aged > 65 vs. >65 years: subgroup analyses from the CLARINET study. Journal of Clinical Oncology 2015;33(15_suppl):e15177. [EMBASE: 72012341] [Google Scholar]
Di Gialleonardo 2020 {published data only}
- Di Gialleonardo V, Tesfaye E, Kittur A, Giacalone S, Lapuerta P. Improvement in carcinoid syndrome-related symptoms with telotristat ethyl in patients with 2 or less bowel movements per day. Pancreas 2020;49:467-68. [DOI: 10.1097/MPA.0000000000001516] [DOI] [Google Scholar]
- Pavel M, Gross DJ, Benavent M, Perros P, Srirajaskanthan R, Warner RRP, et al. Telotristat ethyl in carcinoid syndrome: safety and efficacy in the TELECAST phase 3 trial. Endocrine-related Cancer 2018;25(3):309-22. [DOI] [PMC free article] [PubMed] [Google Scholar]
Elf 2018 {published data only}
- Elf AK, Andersson M, Henrikson O, Jalnefjord O, Ljungberg M, Svensson J, et al. Radioembolization versus bland embolization for hepatic metastases from small intestinal neuroendocrine tumors: Short-term results of a randomized clinical trial. World Journal of Surgery 2018;42(2):506-13. [DOI] [PMC free article] [PubMed] [Google Scholar]
Faiss 2003 {published data only}
- Faiss S, Pape UF, Bohmig M, Dorffel Y, Mansmann U, Golder W, et al. Prospective, randomized, multicenter trial on the antiproliferative effect of lanreotide, interferon alfa, and their combination for therapy of metastatic neuroendocrine gastroenteropancreatic tumors--the International Lanreotide and Interferon Alfa Study Group. Journal of Clinical Oncology 2003;21(14):2689-96. [DOI] [PubMed] [Google Scholar]
Fisher 2016 {published data only}
- Anselmo L, Shaheen M, Casellini C, Vinik AI, Wolin E, Kunz P, et al. Safety and efficacy of lanreotide depot vs. placebo in neuroendocrine tumor patients with a history of carcinoid syndrome and prior octreotide therapy. Journal of Oncology Pharmacy Practice 2016;22:19-20. [Google Scholar]
- Fisher GA, Wolin EM, Kunz P, Liyanage N, Gomez‐Panzani E, Lowenthal SP, et al. Efficacy and safety of lanreotide depot vs placebo in patients with neuroendocrine tumor and a history of carcinoid syndrome and prior octreotide therapy. 2016 Pancreas;45:475. [Google Scholar]
- Fisher GA, Wolin EM, Kunz P, Liyanage N, Gomez-Panzani E, Lowenthal SP, et al. Safety and efficacy of lanreotide depot versus placebo in neuroendocrine tumor patients with a history of carcinoid syndrome and prior octreotide therapy. American Journal of Gastroenterology 2015;110:S1007. [Google Scholar]
- Pommier RF, Fisher GA, Wolin EM, Liyanage N, Lowenthal SP, Mirakhur B, et al. Lanreotide depot/autogel for symptomatic control of carcinoid syndrome (CS) in patients with neuroendocrine tumors (NETs) previously responsive to octreotide: subanalysis of patient-reported symptoms from the phase 3 elect study. Pancreas 2018;47:352. [Google Scholar]
- Vinik AI, Wolin EM, Liyanage N, Gomez-Panzani E, Fisher GA, Elect Study Group. Evaluation of lanreotide depot/autogel efficacy and safety as a carcinoid syndrome treatment (elect): A randomized, double-blind, placebo-controlled trial. Endocrine Practice 2016;22(9):1068-80. [DOI] [PubMed] [Google Scholar]
Ito 2012 {published data only}
- Ito T, Okusaka T, Ikeda M, Igarashi H, Morizane C, Nakachi K, et al. Everolimus for advanced pancreatic neuroendocrine tumours: a subgroup analysis evaluating Japanese patients in the RADIANT-3 trial. Japanese Journal of Clinical Oncology 2012;42(10):903-11. [DOI] [PMC free article] [PubMed] [Google Scholar]
- Yao JC, Shah MH, Ito T, Lombard-Bohas C, Wolin EM, Van Cutsem E, et al, Rad001 in Advanced Neuroendocrine Tumors, Third Trial Study Group. Everolimus for advanced pancreatic neuroendocrine tumors. New England Journal of Medicine 2011;364(6):514-23. [DOI] [PMC free article] [PubMed] [Google Scholar]
Jacobsen 1995 {published data only}
- Jacobsen MB, Hanssen LE. Clinical effects of octreotide compared to placebo in patients with gastrointestinal neuroendocrine tumours. Report on a double-blind, randomized trial. Journal of Internal Medicine 1995;237(3):269-75. [DOI] [PubMed] [Google Scholar]
Kölby 2003 {published data only}
- Kölby L, Persson G, Franzen S, Ahren B. Randomized clinical trial of the effect of interferon alpha on survival in patients with disseminated midgut carcinoid tumours. British Journal of Surgery 2003;90(6):687-93. [DOI] [PubMed] [Google Scholar]
Kulke 2016 {published data only}
- Kulke MH, Niedzwiecki D, Foster NR, Fruth B, Kunz PL, Kennecke H, et al. Randomized phase II study of everolimus (E) versus everolimus plus bevacizumab (E+B) in patients (Pts) with locally advanced or metastatic pancreatic neuroendocrine tumors (pNET), CALGB 80701 (alliance). Pancreas 2016;45(3):477. [Google Scholar]
Kulke 2017 (1) {published data only}
- Kulke MH, Ruszniewski P, Van Cutsem E, Lombard-Bohas C, Valle JW, De Herder WW, et al. A randomized, open-label, phase 2 study of everolimus in combination with pasireotide LAR or everolimus alone in advanced, well-differentiated, progressive pancreatic neuroendocrine tumors: COOPERATE-2 trial. Annals of Oncology 2017;28(6):1309-15. [DOI] [PMC free article] [PubMed] [Google Scholar]
Kulke 2017 (2) {published data only}
- Dillon JS, Kulke MH, Pavel M, Hörsch D, Anthony LB, Warner RRP, et al. Time to sustained improvement in bowel movement frequency with telotristat ethyl: Analysis of the phase 3 telestar study. Pancreas 2018;47:337-38. [Google Scholar]
- Kulke MH, Hörsch D, Caplin ME, Anthony LB, Bergsland E, Öberg K, et al. Telotristat ethyl, a tryptophan hydroxylase inhibitor for the treatment of carcinoid syndrome. Journal of Clinical Oncology 2017;35(1):14-23. [DOI] [PubMed] [Google Scholar]
- Weickert MO, Kaltsas G, Hörsch D, Lapuerta P, Pavel M, Valle JW, et al. Weight change associated with telotristat ethyl in the treatment of carcinoid syndrome. Pancreas 2018;47:357-58. [DOI: 10.1097/MPA.0000000000000997] [DOI] [PubMed] [Google Scholar]
Lange 1992 {published data only}
- Lange JR, Steinberg SM, Doherty GM, Langstein HN, White DE, Shawker TH, et al. A randomized, prospective trial of postoperative somatostatin analogue in patients with neuroendocrine tumors of the pancreas. Surgery 1992;112(6):1033-7; discussion 1037-8. [PubMed] [Google Scholar]
Lepage 2020 {published data only}
- Lepage C, Phelip JM, Lièvre A, Le Malicot K, Tougeron D, Dahan L, et al. Lanreotide as maintenance therapy after first-line treatment in patients with non-resectable duodeno-pancreatic neuroendocrine tumours (NETs): An international double-blind, placebo-controlled randomized phase II trial. Annals of Oncology 2020;31:S774. [DOI: 10.1016/j.annonc.2020.08.1376] [DOI] [PubMed] [Google Scholar]
Liu 2020 {published data only}
- Liu Q, Cheng Y, Zang J, Sui H, Wang H, Jacobson O, et al. Dose escalation of an Evans blue–modified radiolabeled somatostatin analog 177Lu-DOTA-EB-TATE in the treatment of metastatic neuroendocrine tumors. European Journal of Nuclear Medicine and Molecular Imaging 2020;47(4):947-57. [DOI: 10.1007/s00259-019-04530-1] [DOI] [PMC free article] [PubMed] [Google Scholar]
Lombard‐Bohas 2015 {published data only}
- Lombard-Bohas C, Yao JC, Hobday T, Van Cutsem E, Wolin EM, Panneerselvam A, et al. Impact of prior chemotherapy use on the efficacy of everolimus in patients with advanced pancreatic neuroendocrine tumors: a subgroup analysis of the phase III RADIANT-3 trial. Pancreas 2015;44(2):181-9. [DOI] [PMC free article] [PubMed] [Google Scholar]
- Yao JC, Shah MH, Ito T, Lombard-Bohas C, Wolin EM, Van Cutsem E, et al, Rad001 in Advanced Neuroendocrine Tumors, Third Trial Study Group. Everolimus for advanced pancreatic neuroendocrine tumors. New England Journal of Medicine 2011;364(6):514-23. [DOI] [PMC free article] [PubMed] [Google Scholar]
Maire 2012 {published data only}
- Maire F, Lombard-Bohas C, O'Toole D, Vullierme MP, Rebours V, Couvelard A, et al. Hepatic arterial embolization versus chemoembolization in the treatment of liver metastases from well-differentiated midgut endocrine tumors: a prospective randomized study. Neuroendocrinology 2012;96(4):294-300. [DOI] [PubMed] [Google Scholar]
Meyer 2014 {published data only}
- Meyer T, Qian W, Caplin ME, Armstrong G, Lao-Sirieix S, Hardy R, et al. Capecitabine and streptozocin ± cisplatin in advanced gastroenteropancreatic neuroendocrine tumours. European Journal of Cancer 2014;50(5):902‐11. [DOI] [PubMed] [Google Scholar]
- Meyer T, Qian W, Valle JW, Talbot D, Cunningham D, Reed N, et al. Capecitabine and streptozocin ± cisplatin for gastroenteropancreatic neuroendocrine tumours: predictors of long-term survival in the NET01 trial. Annals of Oncology 2016;27(6):136-48. [EMBASE: 613912194] [Google Scholar]
Moertel 1980 {published data only}
- Moertel CG, Hanley JA, Johnson LA. Streptozocin alone compared with streptozocin plus fluorouracil in the treatment of advanced islet-cell carcinoma. New England Journal of Medicine 1980;303(21):1189-94. [DOI] [PubMed] [Google Scholar]
Moertel 1992 {published data only}
- Moertel CG, Lefkopoulo M, Lipsitz S, Hahn RG, Klaassen D. Streptozocin-doxorubicin, streptozocin-fluorouracil or chlorozotocin in the treatment of advanced islet-cell carcinoma. New England Journal of Medicine 1992;326(8):519-23. [DOI] [PubMed] [Google Scholar]
O'Toole 2000 {published data only}
- O'Toole D, Ducreux M, Bommelaer G, Wemeau JL, Bouche O, Catus F, et al. Treatment of carcinoid syndrome: a prospective crossover evaluation of lanreotide versus octreotide in terms of efficacy, patient acceptability, and tolerance. Cancer 2000;88(4):770-6. [DOI] [PubMed] [Google Scholar]
Öberg 1989 {published data only}
- Oberg K, Norheim I, Alm G. Treatment of malignant carcinoid tumors: a randomized controlled study of streptozocin plus 5-FU and human leukocyte interferon. European Journal of Cancer and Clinical Oncology 1989;25(10):1475-9. [DOI] [PubMed] [Google Scholar]
Pavel 2011 {published data only}
- Pavel ME, Baudin E, Öberg KE, Hainsworth JD, Voi M, Rouyrre N, et al. Efficacy of everolimus plus octreotide LAR in patients with advanced neuroendocrine tumor and carcinoid syndrome: final overall survival from the randomized, placebo-controlled phase 3 RADIANT-2 study. Annals of Oncology 2017;28(7):1569-75. [DOI] [PMC free article] [PubMed] [Google Scholar]
- Pavel ME, Hainsworth JD, Baudin E, Peeters M, Hörsch D, Winkler RE, et al, Radiant-Study Group. Everolimus plus octreotide long-acting repeatable for the treatment of advanced neuroendocrine tumours associated with carcinoid syndrome (RADIANT-2): a randomised, placebo-controlled, phase 3 study. Lancet 2011;378(9808):2005-12. [DOI] [PubMed] [Google Scholar]
- Wolin E, Castellano D, Kaltsas G, Gross D, Panneerselvam A, Klimovsky J, et al. Correlation of progression-free survival (PFS) with early response of biomarkers chromogranin a (CGA) and 5-hhydroxyindoleacetic acid (5-HIAA) levels in patients with advanced neuroendocrine tumors: phase III radiant-2 study results. Pancreas 2012;41:350-51. [EMBASE: 70703127] [Google Scholar]
- Yao JC, Hainsworth JD, Baudin E, Peeters M, Hörsch D, Anthony L, et al. Radiant-2: A phase III trial of everolimus + octreotide lar in patients with advanced neuroendocrine tumors (NET). Pancreas 2011;40:335. [DOI: 10.1097/MPA.0b013e31820e7892] [DOI] [Google Scholar]
Pavel 2018 (1) {published data only}
- Pavel M, Gross DJ, Benavent M, Perros P, Srirajaskanthan R, Warner RRP, et al. Telotristat ethyl in carcinoid syndrome: safety and efficacy in the TELECAST phase 3 trial. Endocrine-related Cancer 2018;25(3):309-22. [DOI] [PMC free article] [PubMed] [Google Scholar]
Pavlakis 2020 {published data only}
- Pavlakis N, Ransom DT, Wyld D, Sjoquist KM, Asher R, Gebski V, et al. Australasian Gastrointestinal Trials Group (AGITG) CONTROL NET Study: Phase II study evaluating the activity of Lu-Octreotate peptide receptor radionuclide therapy (LuTate PRRT) and capecitabine, temozolomide CAPTEM)-First results for pancreas and updated midgut neuroendocrine tumors (pNETS, mNETS). Journal of Clinical Oncology 2020;38(15_suppl):4608. [DOI: 10.1200/JCO.2020.38.15_suppl.4608] [DOI] [Google Scholar]
Phan 2015 (1) {published data only}
- Caplin ME, Pavel M, Cwikla JB, Phan AT, Raderer M, Sedlackova E, et al, Clarinet Investigators. Lanreotide in metastatic enteropancreatic neuroendocrine tumors. New England Journal of Medicine 2014;371(3):224-33. [DOI] [PubMed] [Google Scholar]
- Dasari A, Phan AT, Caplin ME, Pavel ME, Cwikla JB, Raderer M, et al. Lanreotide depot/autogel (LAN) in patients with neuroendocrine tumors (NETs) aged <65 vs. >65 years: subgroup analyses from the CLARINET study. Journal of Clinical Oncology 2015;33(15_suppl):e15177. [EMBASE: 72012341] [Google Scholar]
- Phan AT, Caplin ME, Pavel ME, Cwikla JB, Raderer M, Sedláčková E, et al. Effects of lanreotide autogel/depot (LAN) in patients with neuroendocrine tumors (NETs) age 65 or younger versus older than age 65: subgroup analyses from the CLARINET study. Journal of Clinical Oncology 2015;33:36. [Google Scholar]
Phan 2015 (2) {published data only}
- Caplin ME, Pavel M, Cwikla JB, Phan AT, Raderer M, Sedlackova E, et al. Lanreotide in metastatic enteropancreatic neuroendocrine tumors. New England Journal of Medicine 2014;371(3):224-33. [DOI] [PubMed] [Google Scholar]
- Phan AT, Caplin ME, Pavel ME, Cwikla JB, Raderer M, Sedláčková E, et al. Effects of lanreotide autogel/depot (LAN) in pancreatic neuroendocrine tumors (pNETs): a subgroup analysis from the CLARINET study. Journal of Clinical Oncology 2015;33:233. [Google Scholar]
Pusceddu 2018 {published data only}
- Caplin ME, Pavel M, Cwikla JB, Phan AT, Raderer M, Sedlackova E, et al. Lanreotide in metastatic enteropancreatic neuroendocrine tumors. New England Journal of Medicine 2014;371(3):224-33. [DOI] [PubMed] [Google Scholar]
- Pusceddu S, Vernieri C, Di Maio M, Prinzi N, Torchio M, Buzzoni R, et al. Post-hoc analysis of CLARINET phase III study to investigate the influence of diabetic status on progression-free survival (PFS) of patients with neuroendocrine tumours (NETs) treated with lanreotide(LAN) or placebo (PBO). Annals of Oncology 2018;29:viii472. [DOI: ] [Google Scholar]
Raymond 2011 (1) {published data only}
- Faivre S, Niccoli P, Castellano D, Valle JW, Hammel P, Raoul JL, et al. Sunitinib in pancreatic neuroendocrine tumors: updated progression-free survival and final overall survival from a phase III randomized study. Annals of Oncology 2017;28(2):339-43. [DOI] [PubMed] [Google Scholar]
- Raoul JL, Niccoli P, Bang YJ, Borbath I, Lombard-Bohas C, Metrakos P, et al. Sunitinib (SU) vs placebo for treatment of progressive, well-differentiated pancreatic islet cell tumours: results of a phase III, randomised, double-blind trial. European Journal of Cancer, supplement 2009;7:361. [EMBASE: 70210640] [Google Scholar]
- Raymond E, Dahan L, Raoul JL, Bang YJ, Borbath I, Lombard-Bohas C, et al. Sunitinib malate for the treatment of pancreatic neuroendocrine tumors. New England Journal of Medicine 2011;364(6):501-13. [DOI] [PubMed] [Google Scholar]
- Raymond E, Niccoli P, Castellano D, Valle J, Hammel P, Raoul JL, et al. Sunitinib (SU) in patients with advanced, progressive pancreatic neuroendocrine tumors (PNET): final overall survival (OS) results from a phase III randomized study including adjustment for crossover. Neuroendocrinology 2016;103:84. [EMBASE: 613188549] [Google Scholar]
- Raymond E, Niccoli P, Raoul J, Bang Y, Borbath I, Lombard-Bohas C, et al. Updated overall survival (OS) and progression-free survival (PFS) by blinded independent central review (BICR) of sunitinib (SU) versus placebo (PBO) for patients (Pts) with advance unresectable pancreatic neuroendocrine tumors (NET). Journal of Clinical Oncology 2011;29(15 SUPPL. 1):4008. [EMBASE: 70709834] [Google Scholar]
- Valle J, Niccoli P, Raoul JL, Bang YJ, Borbath I, Van Cutsem E, et al. Updated overall survival data from a phase III study of sunitinib vs. placebo in patients with advanced, unresectable pancreatic neuroendocrine tumour (NET). European Journal of Cancer 2011;47:S462. [EMBASE: 70549479] [Google Scholar]
- Vinik A, Bottomley A, Korytowsky B, Bang YJ, Raoul J, Valle JW, et al. Patient-reported outcomes and quality of life with sunitinib versus placebo for pancreatic neuroendocrine tumors: results from an international phase III trial. Targeted Oncology 2016;11(6):815-24. [DOI] [PubMed] [Google Scholar]
- Vinik A, Cutsem EV, Niccoli P, Raoul JL, Bang YJ, Borbath I, et al. Progression-free survival (PFS) by blinded independent central review (BICR) and updated overall survival (OS) of sunitinib versus placebo for patients with progressive, unresectable, well differentiated pancreatic neuroendocrine tumor (NET). Pancreas 2012;41:350. [EMBASE: 70703125] [Google Scholar]
Raymond 2011 (2) {published data only}
- Raymond E, Dahan L, Raoul JL, Bang YJ, Borbath I, Lombard-Bohas C, et al. Sunitinib malate for the treatment of pancreatic neuroendocrine tumors. New England Journal of Medicine 2011;364(6):501-13. [DOI] [PubMed] [Google Scholar]
- Raymond E, Harmon C, Niccoli P, Metrakos P, Borbath I, Bang YJ, et al. Impact of baseline Ki-67 index and other baseline characteristics on outcome in a study of sunitinib (SU) for the treatment of advanced, progressive pancreatic neuroendocrine tumor (NET). Neuroendocrinology 2011;94:41. [EMBASE: 70610285] [Google Scholar]
Rinke 2009 {published data only}
- Rinke A, Muller HH, Schade-Brittinger C, Klose KJ, Barth P, Wied M, et al. Placebo-controlled, double-blind, prospective, randomized study on the effect of octreotide LAR in the control of tumor growth in patients with metastatic neuroendocrine midgut tumors: a report from the PROMID Study Group. Journal of Clinical Oncology 2009;27(28):4656-63. [DOI] [PubMed] [Google Scholar]
- Rinke A, Neary MP, Eriksson J, Hunger M, Doan T, Karli D, et al. Health-related quality of life for long-acting octreotide versus placebo in patients with metastatic midgut neuroendocrine tumors in the phase 3 PROMID Trial. Neuroendocrinology 2019;109(2):141-51. [DOI] [PubMed] [Google Scholar]
- Rinke A, Wittenberg M, Schade-Brittinger C, Aminossadati B, Ronicke E, Gress TM, et al. Placebo-controlled, double-blind, prospective, randomized study on the effect of octreotide LAR in the control of tumor growth in patients with metastatic neuroendocrine midgut tumors (PROMID): Results of long-term survival. Neuroendocrinology 2017;104(1):26-32. [DOI] [PubMed] [Google Scholar]
Sakata 2006 {published data only}
- Sakata H, Iwakiri R, Ootani A, Tsunada S, Ogata S, Ootani H, et al. A pilot randomized control study to evaluate endoscopic resection using a ligation device for rectal carcinoid tumors. World Journal of Gastroenterology 2006;12(25):4026-8. [DOI] [PMC free article] [PubMed] [Google Scholar]
Salazar 2018 {published data only}
- Salazar R, Garcia‐Carbonero R, Libutti SK, Hendifar AE, Custodio A, Guimbaud R, et al. Phase II study of BEZ235 versus everolimus in patients with mammalian target of rapamycin inhibitor‐naïve advanced pancreatic neuroendocrine tumors. Oncologist 2018;23(7):766‐71. [DOI] [PMC free article] [PubMed] [Google Scholar]
Saslow 1998 {published data only}
- Saslow SB, Scolapio JS, Camilleri M, Forstrom LA, Thomforde GM, Burton DD, et al. Medium-term effects of a new 5HT3 antagonist, alosetron, in patients with carcinoid diarrhoea. Gut 1998;42(5):628-34. [DOI] [PMC free article] [PubMed] [Google Scholar]
Singh 2018 (1) {published data only}
- Singh S, Carnaghi C, Buzzoni R, Pommier RF, Raderer M, Tomasek J, et al. Everolimus in neuroendocrine tumors of the gastrointestinal tract and unknown primary. Neuroendocrinology 2018;106(3):211-20. [DOI] [PubMed] [Google Scholar]
- Yao JC, Fazio N, Singh S, Buzzoni R, Carnaghi C, Wolin E, et al, Rad001 in Advanced Neuroendocrine Tumours, Fourth Trial Study Group. Everolimus for the treatment of advanced, non-functional neuroendocrine tumours of the lung or gastrointestinal tract (RADIANT-4): a randomised, placebo-controlled, phase 3 study. Lancet 2016;387(10022):968-77. [DOI] [PMC free article] [PubMed] [Google Scholar]
Soulen 2020 {published data only}
- Soulen M, Avritscher R, El-Haddad G, Fidelman N, Garcia-Monaco R, White S, et al. Randomized embolization trial for neuroendocrine tumors (RETNET): first safety report. Pancreas 2020;49:488. [EMBASE: 631301779] [Google Scholar]
Strosberg 2011 {published data only}
- Strosberg J, Anthony L, Sideris L, Lebrec J, Tsuchihashi Z, Winkler R, et al. Prognostic value of chromogranin a and neuron-specific enolase in patients with advanced pancreatic neuroendocrine tumors (pNET): phase III RADIANT-3 study results 2011 ACG presidential poster. American Journal of Gastroenterology 2011;106:S58. [Google Scholar]
- Yao JC, Shah MH, Ito T, Lombard-Bohas C, Wolin EM, Van Cutsem E, et al, Rad001 in Advanced Neuroendocrine Tumors, Third Trial Study Group. Everolimus for advanced pancreatic neuroendocrine tumors. New England Journal of Medicine 2011;364(6):514-23. [DOI] [PMC free article] [PubMed] [Google Scholar]
Strosberg 2017 {published data only}
- Strosberg J, El-Haddad G, Wolin E, Hendifar A, Yao J, Chasen B, et al. Phase 3 trial of (177)Lu-Dotatate for midgut neuroendocrine tumors. New England Journal of Medicine 2017;376(2):125-35. [DOI] [PMC free article] [PubMed] [Google Scholar]
- Strosberg J, Wolin E, Chasen B, Kulke M, Bushnell D, Caplin M, et al. QOL improvements in netter-1 phase III trial in patients with progressive midgut neuroendocrine tumors. Pancreas 2018;47:355. [DOI: 10.1097/MPA.0000000000000997] [DOI] [PMC free article] [PubMed] [Google Scholar]
- Strosberg J, Wolin E, Chasen B, Kulke MH, Bushnell D, Caplin M, et al. NETTER-1 phase III trial: Recent findings on quality of life in patients with midgut neuroendocrine tumors. Neuroendocrinology 2017;105:257. [DOI: 10.1159/000484263] [DOI] [Google Scholar]
Strosberg 2020 {published data only}
- Strosberg J, El-Haddad G, Wolin E, Hendifar A, Yao J, Chasen B, et al. Phase 3 trial of (177)Lu-Dotatate for midgut neuroendocrine tumors. New England Journal of Medicine 2017;376(2):125-35. [DOI] [PMC free article] [PubMed] [Google Scholar]
- Strosberg J, Kunz P, Hendifar A, Yao J, Bushnell D, Kulke M, et al. Impact of baseline liver tumor burden, alkaline phosphatase (ALP) elevation, and target size lesion on therapeutic effect of 177LU-DOTATATE treatment: Analysis of progression free survival, and safety in NETTER-1 study. Pancreas 2020;49:489. [DOI: 10.1097/MPA.0000000000001516] [DOI] [Google Scholar]
Van Der Zwan 2018 {published data only}
- Van Der Zwan W, Wyld D, Brabander T, Teunissen J, Kam B, MacFarlane D, et al. A randomized controlled study comparing treatment of gastro-entero-pancreatic neuroendocrine tumors (GEPNET) with 177Lu-Dotatate alone and in combination with capecitabine. Neuroendocrinology 2018;106:261. [DOI: 10.1159/000487699] [DOI] [Google Scholar]
Vinik 2016 {published data only}
- Duchateau L, Lescrauwaet B, Blot K, Liyanage N, Ray D, Lowenthal SP, et al. An exploratory patientcentricanalysis of the elect trial: A phase 3 study of efficacy and safety of lanreotide autogel/depot (LAN) treatment for patients with carcinoid syndrome (CS). Pancreas 2018;Conference: 10th Annual Meeting of the North American Neuroendocrine Tumor Society. United States. 47:338. [EMBASE: 621394428] [Google Scholar]
- Vinik AI, Wolin EM, Liyanage N, Gomez-Panzani E, Fisher GA, Elect Study Group. Evaluation of lanreotide depot/autogel efficacy and safety as a carcinoid syndrome treatment (elect): A randomized, double-blind, placebo-controlled trial. Endocrine Practice 2016;22(9):1068-80. [DOI] [PubMed] [Google Scholar]
- Wolin EM, Lowenthal SP, Fisher GA, Liyanage N, Mirakhur B, Pommier RF, et al. Change in patient-reported symptom control in patients with neuroendocrine tumors treated with lanreotide depot. Pancreas 2018;47:358. [DOI: 10.1097/MPA.0000000000000997] [DOI] [PMC free article] [PubMed] [Google Scholar]
Wolin 2015 {published data only}
- Wolin EM, Jarzab B, Eriksson B, Walter T, Toumpanakis C, Morse MA, et al. Phase III study of pasireotide long-acting release in patients with metastatic neuroendocrine tumors and carcinoid symptoms refractory to available somatostatin analogues. Drug Design, Development and Therapy 2015;9:5075-86. [DOI] [PMC free article] [PubMed] [Google Scholar]
Wolin 2016 {published data only}
- Caplin ME, Pavel M, Cwikla JB, Phan AT, Raderer M, Sedlackova E, et al. Lanreotide in metastatic enteropancreatic neuroendocrine tumors. New England Journal of Medicine 2014;371(3):224-33. [DOI] [PubMed] [Google Scholar]
- Wolin EM, Caplin ME, Pavel ME, Cwikla JB, Phan AT, Raderer M, et al. Lanreotide depot/autogel (LAN) in intestinal and pancreatic neuroendocrine tumors (NETs) according to body mass index (BMI): Subgroup analyses from the CLARINET study. Journal of Clinical Oncology 2015;33(15_suppl):e15182. [EMBASE: 72012396] [Google Scholar]
- Wolin EM, Caplin ME, Pavel ME, Cwikla JB, Phan AT, Raderer M, et al. Lanreotide depot/autogel (LAN) in intestinal and pancreatic neuroendocrine tumors (NETs) according to body mass index (BMI): Subgroup analyses from the CLARINET study. Pancreas 2016;33(15_suppl):e15182. [Google Scholar]
Xu 2020 (ep) {published data only}
- Xu J, Shen L, Bai C, Wang W, Li J, Yu X, et al. Surufatinib in advanced extrapancreatic neuroendocrine tumours (SANET-ep): a randomised, double-blind, placebo-controlled, phase 3 study. Lancet Oncology 2020;21(11):1500-12. [DOI] [PubMed] [Google Scholar]
- Xu J, Shen L, Zhou Z, Li J, Bai C, Chi Y, et al. Efficacy and safety of surufatinib in patients with well-differentiated advanced extrapancreatic neuroendocrine tumors (NETs): results from the randomized phase III study (SANET-ep). Annals of Oncology 2019;30:v911. [EMBASE: 630606088] [Google Scholar]
Xu 2020 (p) {published data only}
- Xu J, Shen L, Bai C, Li J, Zhou Z, Yu X, et al. Surufatinib (S) for patients (Pts) with advanced pancreatic neuroendocrine tumours (SANET-p): a randomized, double-blind, placebo (P)-controlled phase III trial (NCT02589821). Annals of Oncology 2020;31:S770. [EMBASE: 2007890722] [Google Scholar]
- Xu J, Shen L, Bai C, Wang W, Li J, Yu X, et al. Surufatinib in advanced pancreatic neuroendocrine tumours (SANET-p): a randomised, double-blind, placebo-controlled, phase 3 study. Lancet Oncology 2020;21(11):1489-99. [DOI] [PubMed] [Google Scholar]
Yao 2008 (1) {published data only}
- Yao JC, Phan A, Hoff PM, Chen HX, Charnsangavej C, Yeung SC, et al. Targeting vascular endothelial growth factor in advanced carcinoid tumor: a random assignment phase II study of depot octreotide with bevacizumab and pegylated interferon alpha-2b. Journal of Clinical Oncology 2008;26(8):1316-23. [DOI] [PubMed] [Google Scholar]
Yao 2011 {published data only}
- De Vries E, Anthony LB, Sideris L, Chen L, Lebrec J, Tsuchihashi Z, et al. Effect of everolimus treatment on chromogranin A, neuron-specific enolase, gastrin, and glucagon levels in patients with advanced pancreatic neuroendocrine tumors (pNET): phase III RADIANT-3 study results. Journal of Clinical Oncology 2011;29(15_suppl):10624. [EMBASE: 70712574] [Google Scholar]
- Yao JC, Pavel M, Lombard-Bohas C, Van Cutsem E, Voi M, Brandt U, et al. Everolimus for the treatment of advanced pancreatic neuroendocrine tumors: Overall survival and circulating biomarkers from the randomized, phase III RADIANT-3 study. Journal of Clinical Oncology 2016;34(32):3906-13. [DOI] [PMC free article] [PubMed] [Google Scholar]
- Yao JC, Shah MH, Ito T, Lombard-Bohas C, Wolin EM, Van Cutsem E, et al. Everolimus for advanced pancreatic neuroendocrine tumors. New England Journal of Medicine 2011;364(6):514-23. [DOI] [PMC free article] [PubMed] [Google Scholar]
Yao 2016 {published data only}
- Pavel ME, Singh S, Strosberg JR, Bubuteishvili-Pacaud L, Degtyarev E, Neary MP, et al. Health-related quality of life for everolimus versus placebo in patients with advanced, non-functional, well-differentiated gastrointestinal or lung neuroendocrine tumours (RADIANT-4): a multicentre, randomised, double-blind, placebo-controlled, phase 3 trial. Lancet Oncology 2017;18(10):1411-22. [DOI] [PubMed] [Google Scholar]
- Yao JC, Fazio N, Singh S, Buzzoni R, Carnaghi C, Wolin E, et al. Everolimus for the treatment of advanced, non-functional neuroendocrine tumours of the lung or gastrointestinal tract (RADIANT-4): a randomised, placebo-controlled, phase 3 study. Lancet 2016;387(10022):968-77. [DOI] [PMC free article] [PubMed] [Google Scholar]
Yao 2017 {published data only}
- Yao JC, Guthrie KA, Moran C, Strosberg JR, Kulke MH, Chan JA, et al. Phase III prospective randomized comparison trial of depot octreotide plus interferon alfa-2b versus depot octreotide plus bevacizumab in patients with advanced carcinoid tumors: SWOG S0518. Journal of Clinical Oncology 2017;35(15):1695-703. [DOI] [PMC free article] [PubMed] [Google Scholar]
Yao 2019 {published data only}
- Yao JC, Fazio N, Singh S, Buzzoni R, Carnaghi C, Wolin E, et al. Everolimus for the treatment of advanced, non-functional neuroendocrine tumours of the lung or gastrointestinal tract (RADIANT-4): a randomised, placebo-controlled, phase 3 study. Lancet 2016;387(10022):968-77. [DOI] [PMC free article] [PubMed] [Google Scholar]
- Yao JC, Oh DY, Qian J, Park YS, Herbst F, Ridolfi A, et al. Everolimus for the treatment of advanced gastrointestinal or lung nonfunctional neuroendocrine tumors in east asian patients: A subgroup analysis of the RADIANT-4 study. OncoTargets and Therapy 2019;12:1717-28. [DOI] [PMC free article] [PubMed] [Google Scholar]
Zhang 2020 {published data only}
- Zhang P, Li J, Li J, Zhang X, Zhou J, Wang X, et al. Etoposide and cisplatin versus irinotecan and cisplatin as the first-line therapy for patients with advanced, poorly differentiated gastroenteropancreatic neuroendocrine carcinoma: A randomized phase 2 study. Cancer 2020;126 Suppl 9(Suppl 9):2086-92. [DOI] [PMC free article] [PubMed] [Google Scholar]
References to studies excluded from this review
Caplin 2014 {published data only}
- Caplin ME, Ruszniewski PB, Pavel ME, Cwikla JB, Phan AT, Raderer M, et al. Progression-free survival (PFS) with lanreotide autogel/depot (LAN) in enteropancreatic NETs patients: The CLARINET extension study. Journal of Clinical Oncology 2014;32:4107. [Google Scholar]
Chan 2018 {published data only}
- Chan DL, Yao JC, Carnaghi C, Buzzoni R, Herbst F, Ridolfi A, et al. Systemic markers of inflammation in neuroendocrine tumors (NETs) and outcomes with everolimus: A pooled analysis from the randomized, phase 3 RADIANT-3 and RADIANT-4 trials. Neuroendocrinology 2018;Conference: 15th Annual ENETS Conference for the Diagnosis and Treatment of Neuroendocrine Tumor Disease. Spain. 106:151. [Google Scholar]
Cwikla 2017 {published data only}
- Cwikla JB, Wolin EM, Pavel M, Phan AT, Raderer M, Sedláčková E, et al. Final analysis of time to subsequent disease progression/death in patients with metastatic enteropancreatic neuroendocrine tumours progressing under placebo and switched to lanreotide autogel/depot 120mg in the CLARINET open-label extension. Annals of Oncology 2017;28:v150. [Google Scholar]
Fazio 2018 {published data only}
- Fazio N, Carnaghi C, Buzzoni R, Valle J, Herbst F, Ridolfi A, et al. Relationship between metabolic toxicity and efficacy of everolimus in patients with neuroendocrine tumors (NETs): A pooled analysis from the randomized, phase 3 RADIANT-3 and RADIANT-4 trials. Neuroendocrinology 2018;Conference: 15th Annual ENETS Conference for the Diagnosis and Treatment of Neuroendocrine Tumor Disease. Spain. 106:211. [Google Scholar]
Herrera Cabezón 2019 {published data only}
- Herrera Cabezón J, Sánchez Acedo P, Tarifa Castilla A, Zazpe Ripa C. Delayed gastric emptying following pancreatoduodenectomy: a Roux-en-Y gastrojejunostomy vs Billroth II gastrojejunostomy randomized study. Revista espanola de enfermedades digestivas 2019;111(1):34-9. [DOI] [PubMed] [Google Scholar]
Hörsch 2018 {published data only}
- Hörsch D, Kulke MH, Caplin ME, Anthony LB, Bergsland E, Oberg K, et al. Efficacy and safety of telotristat ethyl in patients with carcinoid syndrome inadequately controlled by somatostatin analogs: Analysis of the completed telestar extension period. Pancreas 2018;47:341-2. [Google Scholar]
Ito 2011 {published data only}
- Ito T, Okusaka T, Ikeda M, Tajima T, Kasuga A, Fujita Y, et al. Everolimus versus placebo in Japanese patients with advanced pancreatic neuroendocrine tumors (pNET): japanese subgroup analysis of RADIANT-3. Journal of Clinical Oncology 2011;29:289. [DOI] [PMC free article] [PubMed] [Google Scholar]
Kulke 2019 {published data only}
- Kulke MH, Ruszniewski P, Van Cutsem E, Lombard-Bohas C, Valle JW, De Herder WW, et al. Erratum: a randomized, open-label, phase 2 study of everolimus in combination with pasireotide LAR or everolimus alone in advanced, well-differentiated, progressive pancreatic neuroendocrine tumors: COOPERATE-2 trial. Annals of Oncology 2019;30(11):1846. [DOI] [PMC free article] [PubMed] [Google Scholar]
Lapuerta 2018 {published data only}
- Lapuerta P, Kulke MH, Pavel M, Biran T, Fleming R, Zacks JS, et al. Integrated safety analysis of telotristat ethyl in patients with carcinoid heart disease. Pancreas 2018;47:345. [Google Scholar]
Meyer 2016 {published data only}
- Meyer T, Qian W, Valle JW, Talbot D, Cunningham D, Reed N, et al. Capecitabine and streptozocin ± cisplatin for gastroenteropancreatic neuroendocrine tumours: predictors of long-term survival in the NET01 trial. Annals of Oncology 2016;27:vi136–48. [Google Scholar]
Miller 2020 {published data only}
- Miller C, Virgolini I, Kjaer A, Gronbaek H, Terve P, Shamsi K, et al. A novel read methodology to evaluate the optimal dose of 68Ga-satoreotide trizoxetan as a PET imaging agent in patients with GEP-NETs in a phase II clinical trial. Journal of Nuclear Medicine 2020;61(supplement 1):60. [Google Scholar]
Okusaka 2012 {published data only}
- Okusaka T, Ito T, Ikeda M, Igarashi H, Morizane C, Nakachi K, et al. Phase III trial of everolimus in advanced pancreatic neuroendocrine tumors (RADIANT-3): overall population and Japanese subgroup analysis. Annals of Oncology 2012;23:xi15. [DOI] [PMC free article] [PubMed] [Google Scholar]
Pavel 2015 {published data only}
- Pavel ME, Lombard‐Bohas C, Van Cutsem E, Lam DH, Kunz T, Brandt U, et al. Everolimus in patients with advanced, progressive pancreatic neuroendocrine tumors: overall survival results from the phase III RADIANT-3 study after adjusting for crossover bias. Journal of Clinical Oncology 2015;33(15 SUPPL. 1):4091. [Google Scholar]
Pavel 2018 (2) {published data only}
- Pavel M, Denecke T, Lahner H, Hörsch D, Rinke A, Koch A, et al. Disease control in progressive pancreatic and intestinal neuroendocrine tumours with combined treatment with lanreotide Autogel and temozolomide: The SONNET study. Oncology Research and Treatment 2018;41:263. [Google Scholar]
Pavel 2018 (3) {published data only}
- Pavel M, Denecke T, Lahner H, Hörsch D, Rinke A, Koch A, et al. Disease control in progressive pancreatic and intestinal neuroendocrine tumors by combined treatment with lanreotide autogel and temozolomide: The sonnet study. Neuroendocrinology 2018;106:202. [DOI] [PMC free article] [PubMed] [Google Scholar]
Phan 2017 {published data only}
- Phan AT, Pavel M, Caplin M, Wolin EM, Mirakhur B, Massien C, et al. Long-term efficacy and safety with lanreotide autogel/depot (LAN) from CLARINET and Open-Label Extension (OLE) studies. Neuroendocrinology 2017;105:207. [Google Scholar]
Raderer 2015 {published data only}
- Raderer M, Caplin M, Pavel M, C'wikla JB, Phan A, Sedlackova E, et al. Update on antitumor acitivity of lanreotide autogel (LAN) treatment for enteropancreatic neuroendocrine tumours (NET): the CLARINET open-label extension (OLE) study. Austrian journal of clinical endocrinology and metabolism 2015;8(SONDERHEFT 1):9. [Google Scholar]
Salazar 2015 {published data only}
- Salazar R, Verslype C, Baudin E, Libutti SK, Yao JC, Buzzoni R, et al. Phase II studies of BEZ235 in patients with advanced pancreatic neuroendocrine tumors (pNET). Journal of Clinical Oncology 2015;33(15 SUPPL. 1):4102. [Google Scholar]
Singh 2018 (2) {published data only}
- Singh AN, Pal S, Mangla V, Kilambi R, George J, Dash NR, et al. Pancreaticojejunostomy: Does the technique matter? A randomized trial. Journal of Surgical Oncology 2018;117(3):389-96. [DOI] [PubMed] [Google Scholar]
Wolin 2013 {published data only}
- Wolin EM, Hainsworth JD, Hörsch D, Luppi G, Jehl V, Peeters M. Effect of open-label everolimus in patients with advanced neuroendocrine tumors after disease progression on somatostatin analog: A RADIANT-2 analysis. Pancreas 2013;42(2):385. [Google Scholar]
Wolin 2018 {published data only}
- Wolin EM, Pavel ME, Cwikla JB, Phan AT, Raderer M, Sedlackova E, et al. Final progression-free survival analyses for lanreotide autogel/depot 120 mg in metastatic enteropancreatic neuroendocrine tumors: the CLARINET extension study. Pancreas 2018;47(3):358‐9. [Google Scholar]
Yao 2015 {published data only}
- Yao JC, Oh DY, Qian J, Park YS, Herbst F, Ridolfi A, et al. Everolimus for the treatment of advanced gastrointestinal or lung nonfunctional neuroendocrine tumors in east asian patients: A subgroup analysis of the RADIANT-4 study. OncoTargets and Therapy 2015;12:1717-28. [DOI] [PMC free article] [PubMed] [Google Scholar]
References to ongoing studies
NCT01744249 {published data only}
- NCT01744249. Sandostatin LAR and axitinib versus placebo in patients with advanced well-differentiated non-pancreatic neuroendocrine carcinomas [A phase II/III randomized double-blind study of sandostatin LAR in combination with axitinib versus sandostatin LAR with placebo in patients with advanced G1-G2 neuroendocrine tumours (WHO 2010) of non-pancreatic origin]. clinicaltrials.gov/show/NCT01744249 (first posted 6 December 2012).
NCT02246127 {published data only}
- NCT02246127. Efficacy and safety of everolimus and (streptozotocin- fluorouracil) given one upfront the other upon progression in advanced pancreatic neuroendocrine tumour [Randomized open label study to compare the efficacy and safety of everolimus followed by chemotherapy with streptozotocin- fluorouracil upon progression or the reverse sequence, in advanced progressive pancreatic neuroendocrine tumours]. clinicaltrials.gov/show/NCT02246127 (first posted 22 September 2014).
NCT03049189 {published data only}
- NCT03049189. Efficacy and safety of 177Lu-edotreotide PRRT in GEP-NET patients [A prospective, randomised, controlled, open-label, multicentre phase III study to evaluate efficacy and safety of peptide receptor radionuclide therapy (PRRT) with 177Lu-edotreotide compared to targeted molecular therapy with everolimus in patients with inoperable, progressive, somatostatin receptor-positive (SSTR+), neuroendocrine tumours of gastroenteric or pancreatic origin (GEP-NET)]. clinicaltrials.gov/show/NCT03049189 (first posted 9 February 2017).
Additional references
Aaronson 1993
- Aaronson NK, Ahmedzai S, Bergman B, Bullinger M, Cull A, Duez NJ, et al. The European Organization for Research and Treatment of Cancer QLQ-C30: a quality-of-life instrument for use in international clinical trials in oncology. Journal of the National Cancer Institute 1993;85(5):365-76. [DOI] [PubMed] [Google Scholar]
Béliveau 2019
- Béliveau A, Boyne DJ, Slater J, Brenner D, Arora P. BUGSnet: an R package to facilitate the conduct and reporting of Bayesian network meta-analyses. BMC Medical Research Methodology 2019;19(1):196. [DOI] [PMC free article] [PubMed] [Google Scholar]
Brignardello‐Petersen 2018
- Brignardello-Petersen R, Bonner A, Alexander PE, Siemieniuk RA, Furukawa TA, Rochwerg B, et al, GRADE Working Group. Advances in the GRADE approach to rate the certainty in estimates from a network meta-analysis. Journal of Clinical Epidemiology 2018;93:36-44. [DOI] [PubMed] [Google Scholar]
Cives 2014
- Cives M, Strosberg J. An update on gastroenteropancreatic neuroendocrine tumors. Oncology (Williston Park) 2014;28(9):749-56, 758. [PubMed] [Google Scholar]
Clift 2020
- Clift AK, Kidd M, Bodei L, Toumpanakis C, Baum RP, Oberg K, et al. Neuroendocrine neoplasms of the small bowel and pancreas. Neuroendocrinology 2020;110(6):444-76. [DOI] [PMC free article] [PubMed] [Google Scholar]
Dasari 2017
- Dasari A, Shen C, Halperin D, Zhao B, Zhou S, Xu Y, et al. Trends in the incidence, prevalence, and survival outcomes in patients with neuroendocrine tumors in the United States. JAMA Oncology 2017;3(10):1335-42. [DOI] [PMC free article] [PubMed] [Google Scholar]
DePalo 2019
- DePalo DK, Lee RM, Lopez-Aguiar AG, Gamboa AC, Rocha F, Poultsides G, et al, United States Neuroendocrine Tumor Study Group. Interaction of race and pathology for neuroendocrine tumors: epidemiology, natural history, or racial disparity? Journal of Surgical Oncology 2019;120(6):919-25. [DOI] [PMC free article] [PubMed] [Google Scholar]
Fraenkel 2012
- Fraenkel M, Kim MK, Faggiano A, Valk GD. Epidemiology of gastroenteropancreatic neuroendocrine tumours. Best Practice & Research Clinical Gastroenterology 2012;26(6):691-703. [DOI] [PubMed] [Google Scholar]
Fraenkel 2014
- Fraenkel M, Kim M, Faggiano A, De Herder WW, Valk GD, Knowledge NETwork. Incidence of gastroenteropancreatic neuroendocrine tumours: a systematic review of the literature. Endocrine-related Cancer 2014;21(3):R153-63. [DOI] [PubMed] [Google Scholar]
Hallet 2015
- Hallet J, Law CH, Cukier M, Saskin R, Liu N, Singh S. Exploring the rising incidence of neuroendocrine tumors: a population-based analysis of epidemiology, metastatic presentation, and outcomes. Cancer 2015;121(4):589-97. [DOI] [PubMed] [Google Scholar]
Higgins 2011
- Higgins JPT, Green S (editors). Cochrane Handbook for Systematic Reviews of Interventions. 5.1.0 [updated March 2011] edition. Chichester (UK): John Wiley & Sons, 2011. [Google Scholar]
Imaoka 2017
- Imaoka H, Sasaki M, Takahashi H, Hashimoto Y, Ohno I, Mitsunaga S, et al. Progression-free survival as a surrogate endpoint in advanced neuroendocrine neoplasms. Endocrine-related Cancer 2017;24(9):475-83. [DOI] [PubMed] [Google Scholar]
Klimstra 2019
- Klimstra DS, Kloppell G, La Rosa S, Rindi G. Classification of neuroendocrine neoplasms of the digestive system. In: WHO Classification of Tumours Editorial Board, editors(s). WHO Classification of Tumours: Digestive System Tumours. 5th edition. Lyon: International Agency for Research on Cancer, 2019:16. [Google Scholar]
Kunz 2013
- Kunz PL, Reidy-Lagunes D, Anthony LB, Bertino EM, Brendtro K, Chan JA, el al, North American Neuroendocrine Tumor Society. Consensus guidelines for the management and treatment of neuroendocrine tumors. Pancreas 2013;42(4):557-77. [DOI] [PMC free article] [PubMed] [Google Scholar]
Lawrence 2011
- Lawrence B, Gustafsson BI, Chan A, Svejda B, Kidd M, Modlin IM. The epidemiology of gastroenteropancreatic neuroendocrine tumors. Endocrinology and Metabolism Clinics of North America 2011;40(1):1-18. [DOI] [PubMed] [Google Scholar]
Modlin 2008
- Modlin IM, Oberg K, Chung DC, Jensen RT, De Herder WW, Thakker RV, et al. Gastroenteropancreatic neuroendocrine tumours. Lancet Oncology 2008;9(1):61-72. [DOI] [PubMed] [Google Scholar]
NCI 2010
- National Cancer Institute. Common terminology criteria for adverse events (CTCAE), version 4.03. evs.nci.nih.gov/ftp1/CTCAE/CTCAE_4.03/CTCAE_4.03_2010-06-14_QuickReference_5x7.pdf (accessed prior to 10 November 2021).
Pavel 2016
- Pavel M, O'Toole D, Costa F, Capdevila J, Gross D, Kianmanesh R, et al, Vienna Consensus Conference participants. ENETS Consensus Guidelines Update for the management of distant metastatic disease of intestinal, pancreatic, bronchial Neuroendocrine Neoplasms (NEN) and NEN of unknown primary site. Neuroendocrinology 2016;103(2):172-85. [DOI] [PubMed] [Google Scholar]
Pildal 2008
- Pildal J, Hróbjartsson A, Jørgensen KJ, Hilden J, Altman DG, Gøtzsche PC. Impact of allocation concealment on conclusions drawn from meta-analyses of randomized trials. International Journal of Epidemiology 2008;36(4):847-57. [DOI] [PubMed] [Google Scholar]
Puhan 2014
- Puhan MA, Schünemann HJ, Murad MH, Li T, Brignardello-Petersen R, Singh JA, et al, GRADE Working Group. A GRADE Working Group approach for rating the quality of treatment effect estimates from network meta-analysis. BMJ 2014;349:g5630. [DOI] [PubMed] [Google Scholar]
Ramage 2012
- Ramage JK, Ahmed A, Ardill J, Bax N, Breen DJ, Caplin ME, et al, UK and Ireland Neuroendocrine Tumour Society. Guidelines for the management of gastroenteropancreatic neuroendocrine (including carcinoid) tumours (NETs). Gut 2012;61(1):6-32. [DOI] [PMC free article] [PubMed] [Google Scholar]
Raymond 2011
- Raymond E, Dahan L, Raoul JL, Bang YJ, Borbath I, Lombard-Bohas C, et al. Sunitinib malate for the treatment of pancreatic neuroendocrine tumors. New England Journal of Medicine 2011;364(11):1082. [DOI] [PubMed] [Google Scholar]
R Core 2019 [Computer program]
- R Foundation for Statistical Computing R: A Language and Environment for Statistical Computing. R Core Team, Version accessed prior to 10 November 2021. Vienna, Austria: R Foundation for Statistical Computing, 2019. www.R-project.org/.
RevMan 2014 [Computer program]
- Nordic Cochrane Centre, The Cochrane Collaboration Review Manager (RevMan). Version 5.3. Copenhagen: Nordic Cochrane Centre, The Cochrane Collaboration, 2014.
Rücker 2012
- Rücker G. Network meta‐analysis, electrical networks and graph theory. Research Synthesis Methods 2012;3(4):312-24. [DOI] [PubMed] [Google Scholar]
Rücker 2014
- Rücker G, Schwarzer G. Reduce dimension or reduce weights? Comparing two approaches to multi‐arm studies in network meta‐analysis. Statistics in Medicine 2014;33(25):4353-69. [DOI] [PubMed] [Google Scholar]
Rücker 2015
- Rücker G, Schwarzer G. Ranking treatments in frequentist network meta-analysis works without resampling methods. BMC Medical Research Methodology 2015;15:58. [DOI] [PMC free article] [PubMed] [Google Scholar]
Rücker 2021
- Rücker G, Krahn U, König J, Efthimiou O, Davies A, Papakonstantinou T, Schwarzer G. Netmeta: network meta-analysis using frequentist methods. cran.r-project.org/web/packages/netmeta/netmeta.pdf (accessed 17 November 2021).
Saad 2016
- Saad ED, Buyse M. Statistical controversies in clinical research: end points other than overall survival are vital for regulatory approval of anticancer agents. Annals of Oncology 2016;27(3):373-8. [DOI] [PubMed] [Google Scholar]
Salanti 2014
- Salanti G, Del Giovane C, Chaimani A, Caldwell DM, Higgins JP. Evaluating the quality of evidence from a network meta-analysis. PLOS One 2014;9(7):e99682. [DOI] [PMC free article] [PubMed] [Google Scholar]
Yao 2008 (2)
- Yao JC, Hassan M, Phan A, Dagohoy C, Leary C, Mares JE, et al. One hundred years after "carcinoid": epidemiology of and prognostic factors for neuroendocrine tumors in 35,825 cases in the United States. Journal of Clinical Oncology 2008;26(18):3063-72. [DOI] [PubMed] [Google Scholar]
References to other published versions of this review
Kaderli 2019
- Kaderli RM, Spanjol M, Kollár A, Bütikofer L, Gloy V, Dumont RA, et al. Therapeutic options for neuroendocrine tumors: a systematic review and network meta-analysis. JAMA Oncology 2019;5(4):480-9. [DOI] [PMC free article] [PubMed] [Google Scholar]