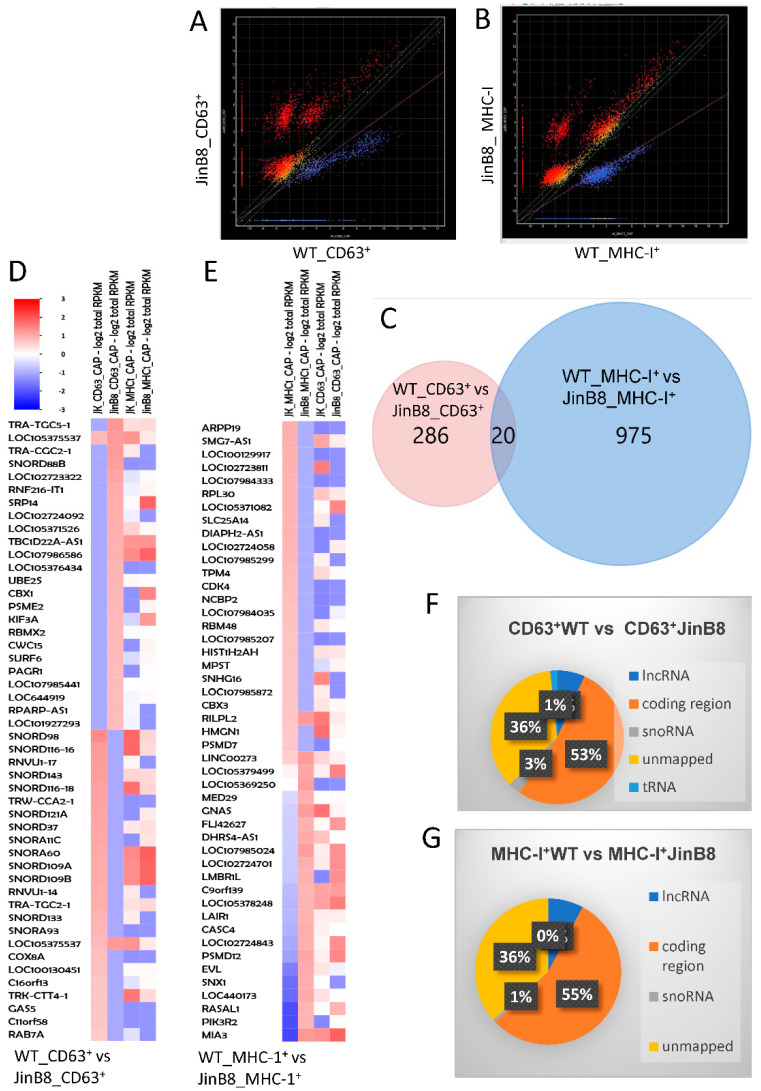
Figure 2.
(A) Scatter graph showing abundance of RNAs in CD63+ EVs from WT Jurkat vs. JinB8 cells (red or blue = p < 0.05, n = 2, biological replicates). (B) Scatter graph showing abundance of RNAs in MHC-I+ EVs from WT Jurkat vs. JinB8 cells (p < 0.05, n = 2, biological replicates). (C). Venn diagram comparing 306 CD47-dependent annotated RNA transcripts in CD63+ EVs from WT Jurkat vs. JinB8 cells and 997 MHC-I+ EVs from WT Jurkat vs. JinB8 cells. (D,E) Heat maps with supervised clustering showing top CD47-dependent annotated RNA transcripts in CD63+ EVs from WT Jurkat vs. JinB8 cells ((D), p < 0.05) and in MHC-I+ EVs from WT Jurkat vs. JinB8 cells ((E), p < 0.05), respectively. (F,G) Pie charts showing classification of 306 CD47-dependent annotated RNA transcripts in CD63+ EVs from WT Jurkat vs. JinB8 cells ((F), p < 0.05) and 997 CD47-dependent transcripts in MHC-I+ EVs from WT Jurkat vs. JinB8 cells ((G), p < 0.05). Data files related with Figure 1; scatter graph cd63 pval05_Data_s1 and scatter graph cd63 pval05_Data_s2.

