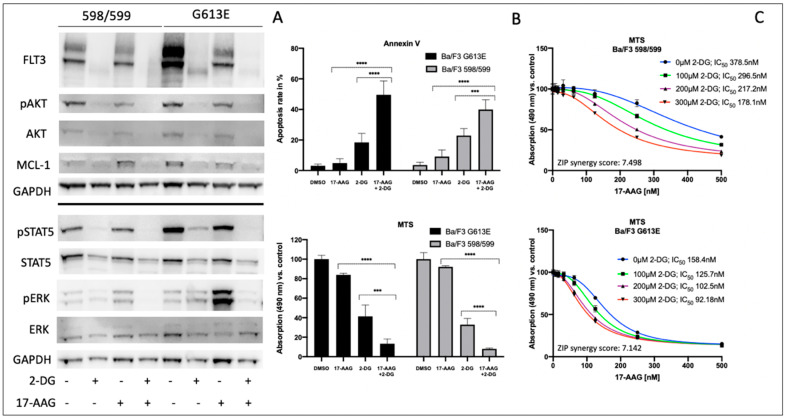
Figure 2.
Impact of 2-deoxy-D-glucose on signal transduction, metabolic activity, and apoptosis of FLT3-ITD-expressing Ba/F3 cells (variant 598/599 and G613E). Ba/F3 cells stably expressing distinct FLT3-ITD were treated with 400 μM 2-deoxy-D-glucose or 150 nM 17-AAG or sequentially as indicated. The incubation time for single compounds was 32 h for 2-deoxy-D-glucose and 24 h for 17-AAG. In the combination experiments, the cells were pre-treated with 2-deoxy-D-glucose for 8 h prior to incubation with 17-AAG for further 24 h. (A) cell lysates were subjected to SDS-PAGE to analyze the expression and phosphorylation status of signaling proteins. For loading control, levels of GAPDH were detected. Representative blots of three independent experiments are shown. Section (B) provides the corresponding data for detection of apoptosis by Annexin V staining (upper part) and metabolic activity by the MTS assay (lower part), respectively. Apoptosis is indicated by Annexin V-positive cells. The data of the MTS assay are demonstrated as relative absorption compared to untreated control. (C) 17-AAG concentration-dependent metabolic activity of both Ba/F3-ITD variants after 8 h pre-incubation with indicated concentrations are demonstrated. 17-AAG was added for further 24 h. IC50 values are indicated for 17-AAG depending on different concentrations of pre-treatment with 2-deoxy-D-glucose. The calculation of potential synergy of distinct drug combinations as well as biological replicates are described in the Section 3 and illustrated in the Supplement (Figure S1). A Student’s t-test was used for calculating the statistical significance (**** p < 0.0001, *** p < 0.001, ns not significant).

