Figure 5.
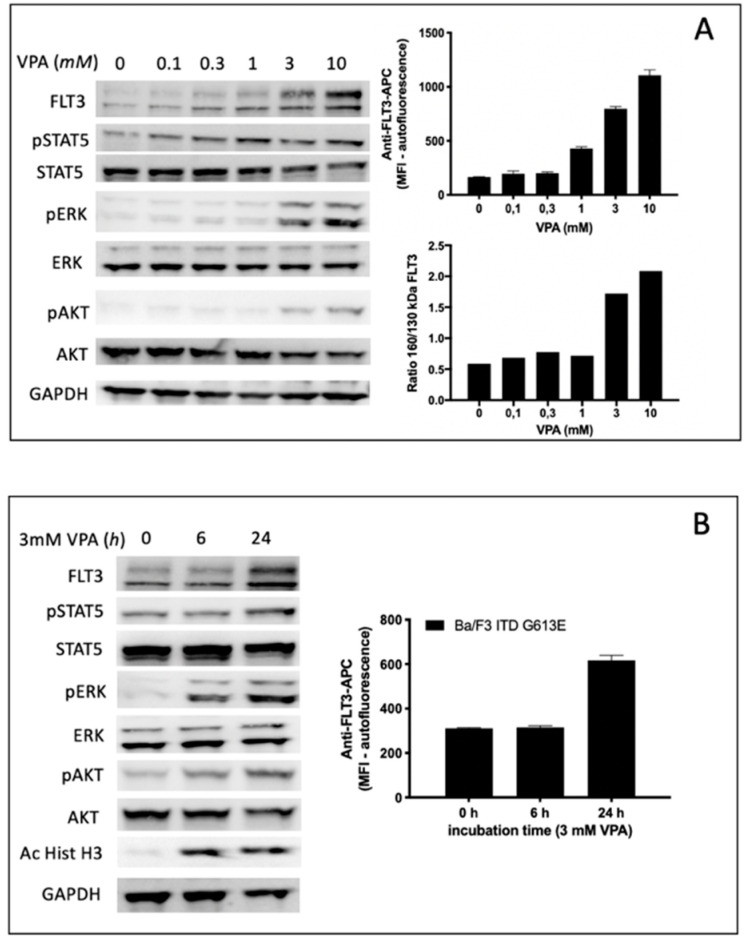
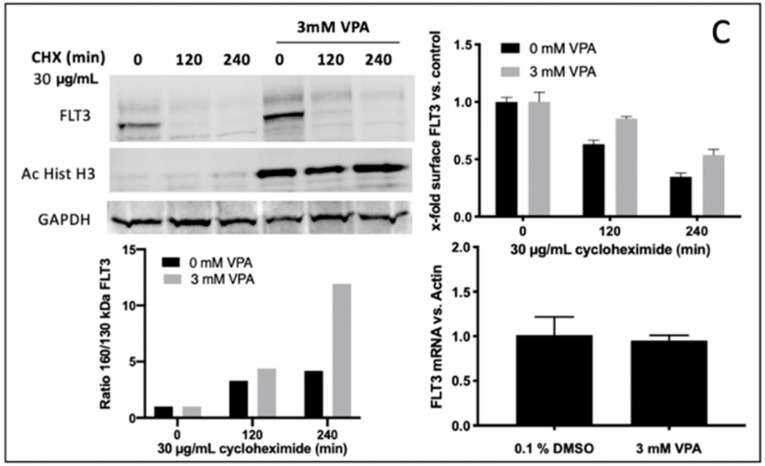
Impact of VPA on FLT3-ITD expression and downstream signaling in Ba/F3-ITD G613E cells. (A,B) concentration-dependent (A) and time-dependent (B) expression of surface FLT3-ITD and semi-quantitative analysis of 150 kDa versus 130 kDa isoform of FLT3-ITD. (A) Cells were treated for 24 h at the indicated VPA concentrations with subsequent analysis of FLT3-ITD expression by immunoblotting (A, left) and flow cytometry (A, upper right), respectively. (B), cells were treated with 3 mM VPA for 6 h and 24 h, respectively, prior to analysis of FLT3-ITD surface expression by flow cytometry (B, right). Immunoblotting was performed for analysis of the downstream signaling pathways. Acetylhistone H3 expression served as a positive control for the VPA effect. For the loading control, the levels of GAPDH were detected. (A, left and B, left). Densitometric analyses were performed by ImageJ Software. C, Ba/F3 FLT3-ITD G613E cells were pre-incubated with or without 3 mM VPA for 24 h, afterwards 30 μg/mL cycloheximide (CHX) was added for the indicated time intervals. The protein lysates were subjected to immunoblotting (C, upper left) and the ratio of 150 kDa versus 130 kDa isoform of FLT3-ITD that was dependent on VPA and CHX treatment was calculated by ImageJ Software (C, lower left). FLT3-ITD surface expression was measured by flow cytometry (C, upper right). The expression of FLT3-ITD mRNA levels after 24 h incubation of Ba/F3 FLT3-ITD G613E cells with 0.1% (v/v) DMSO or 3 mM VPA FLT3-ITD were quantified by qPCR (C, lower right). The graphs are shown as the mean ± SD from three independent experiments.


