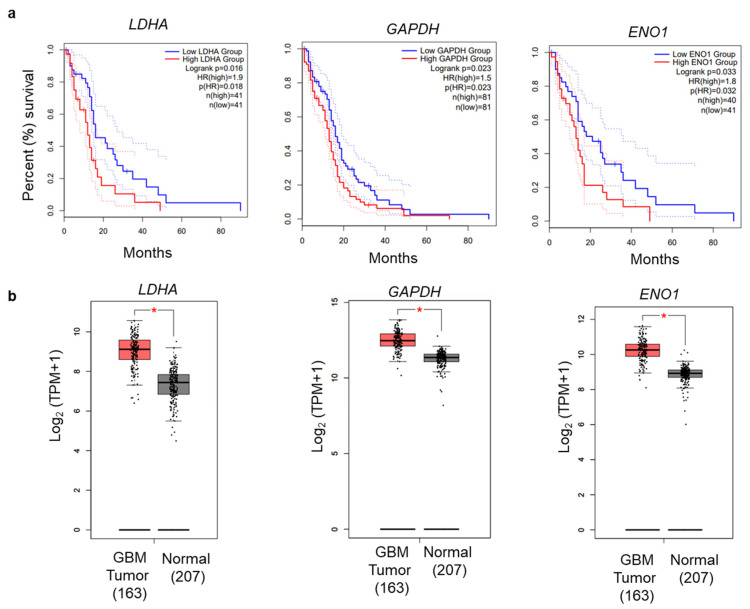
Figure 9.
Overall survival analysis of glycolysis-related genes. (a) OS Kaplan–Meier analysis was performed using the GEPIA2 online application. The solid and dotted lines represent the survival curve and 95% confidence interval, respectively. (b) Differential expression boxplot of genes (LDHA, GAPDH, and ENO1) in GBM in The Cancer Genome Atlas (TCGA) database obtained from GEPIA2 [35].

