. 2021 Nov 12;10:e68544. doi: 10.7554/eLife.68544

Figure 4. Effects of ADP-ribosylation factor-like protein 15 (ARL15) and CNNM3 on Mg2+ currents of the transient receptor potential melastatin-subfamily member 7 (TRPM7) channel expressed in Xenopus oocytes.

TEVC measurements were performed using the external ND96 solution containing 3 mM Mg2+and no other divalent cations. (A, B) Assessment of oocytes expressing TRPM7 or co-expressing TRPM7 with ARL15 (cRNA ratio 10:1). (A) Representative I-V relationships ofTRPM7 currents. The dashed box in Left panelindicates the area of inward currents enlarged in the Right panel. (B) Current amplitudes (mean ± SEM) at+80 mV (Outward currents) and at -80 mV (Inward currents) in measurements from (A). Two independent batches of injected oocytes (n=6-11) were examined. ns, not 36significant; ** P < 0.01, **** P < 0.0001 significant to the Uninjected group (ANOVA). # # P < 0.01, # # # P < 0.001 significant to the TRPM7 group (ANOVA). (C, D) Examination of oocytes expressing TRPM7 or co-expressing TRPM7 with CNNM3 (cRNA ratio 2:1). Data were produced and analyzed as explained in (A, B). Two independent batches of injected oocytes (n=4-7) were examined. ns, not significant (two-tailed t-test).
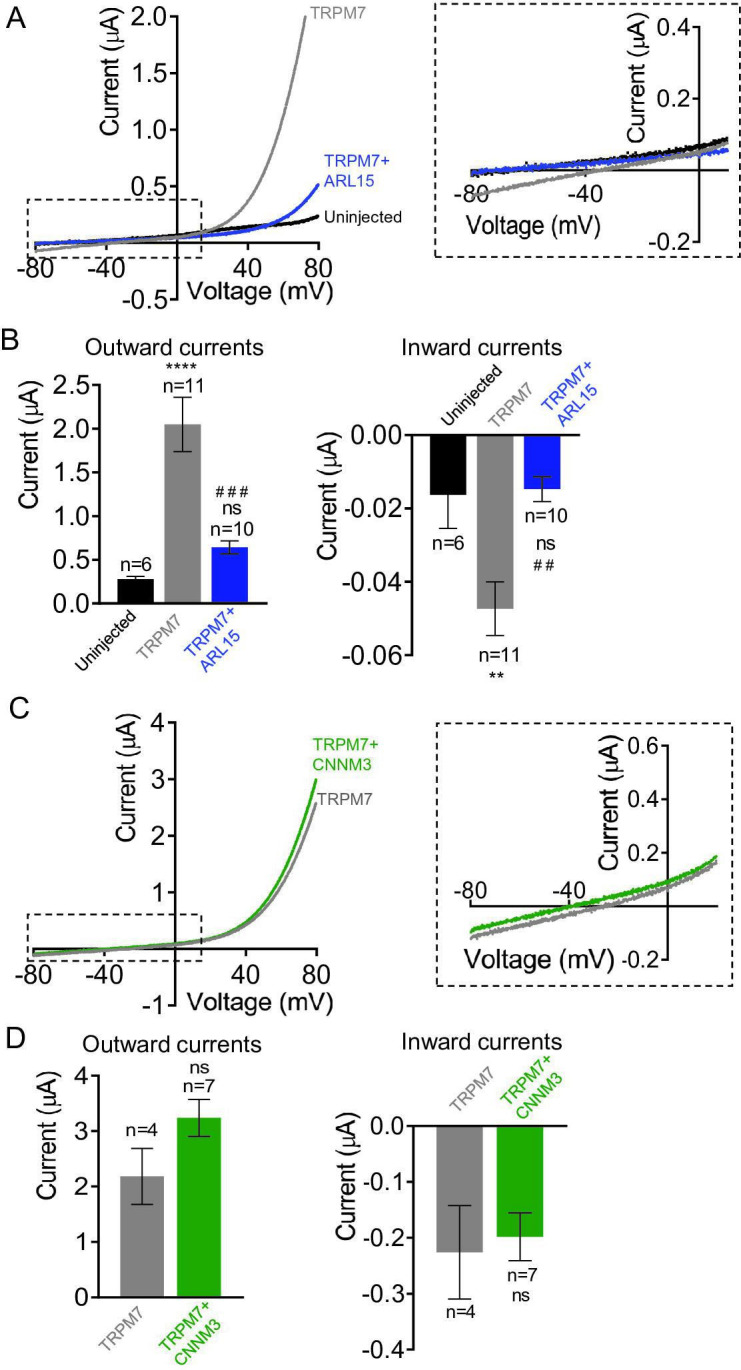
Figure 4.

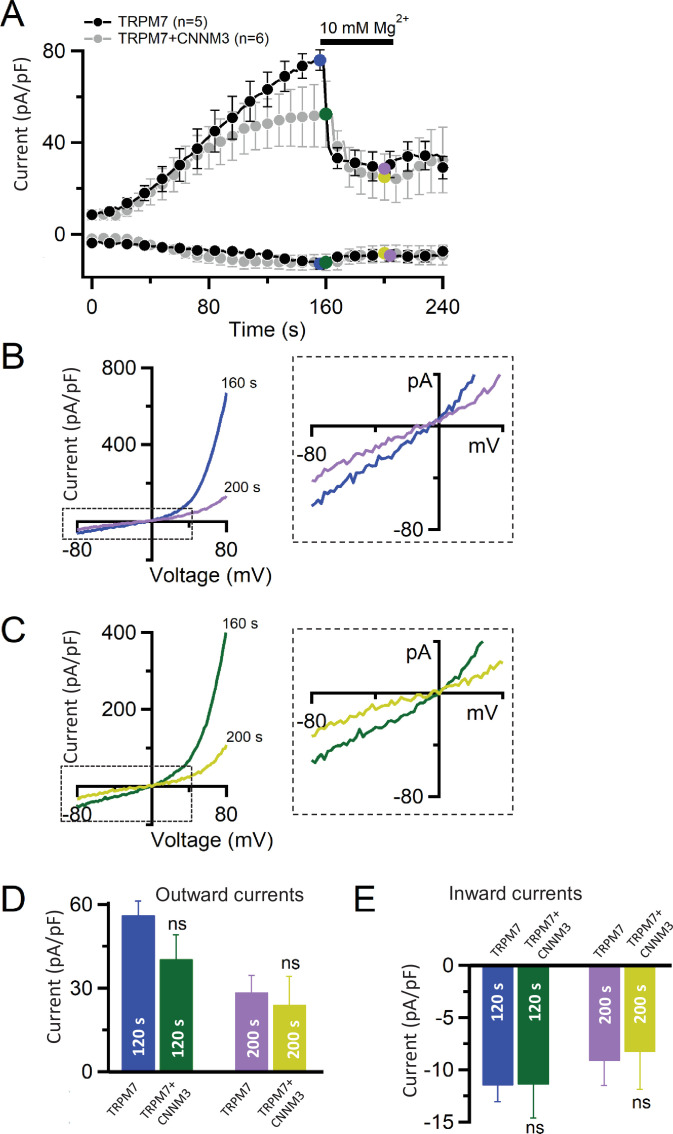
Figure 4—figure supplement 1. Heterologous expression of transient receptor potential melastatin-subfamily member 7 (TRPM7) and CNNM3 in HEK293T cells.

Figure 4—figure supplement 1.

(A) Whole-cell currents in cells transfected with Trpm7 or Trpm7 and Cnnm3 were recorded using the standard Mg2+-free internal solution and standard external solution. When currents were developed, the cells were exposed to the external solution containing 10 mM Mg2+ as indicated by the black bar. Current amplitudes (mean ± standard error of the mean [SEM]) were acquired at –80 and +80 mV and plotted over time. (B, C) Representative current-voltage (I-V) relationships of currents in (A) at 160 and 200 s in cells transfected with Trpm7 (B) or Trpm7 and Cnnm3 (C). The dashed boxes in the left panels indicate areas of inward currents enlarged in the right panels. (D) Bar graphs of outward (+80 mV, mean ± SEM) and inward (–80 mV, mean ± SEM) currents were obtained before and during application of 10 mM Mg2+ as indicated in (A). n, number of cells measured. ns, not significant (two-tailed t-test).
Figure 4—figure supplement 2. Assessment of total magnesium levels in TRPM7-/- HEK293T cells transiently transfected with Trpm7 and Cnnm3 plasmid cDNAs.
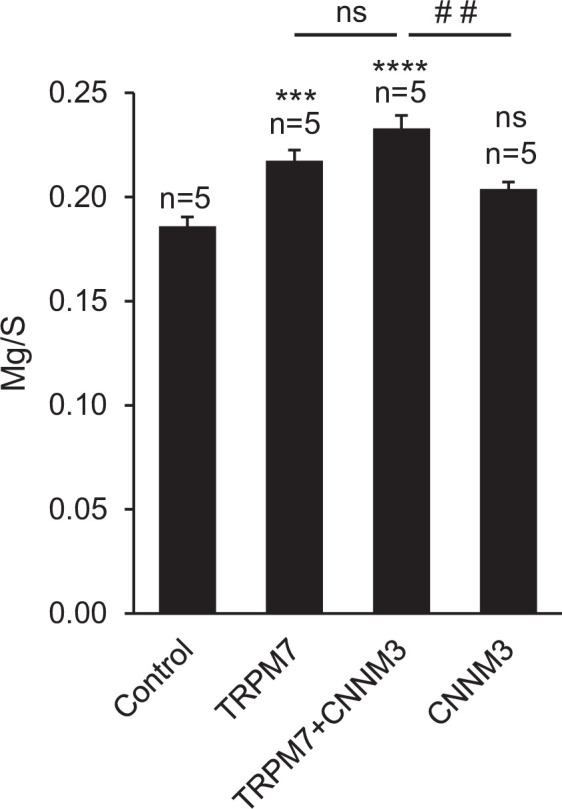
Figure 4—figure supplement 2.

Frozen cell pellets were obtained from untransfected TRPM7-/- HEK293 cells (control) or cells transfected with Trpm7 and/or Cnnm3 cDNA plasmids and analysed by inductively coupled plasma mass spectrometry (ICP-MS). Total elementary Mg contents were normalised to elementary contents of sulphur (S) and represented as mean ± standard error of the mean [SEM] (n = number of independent cell pellets analysed). ns, not significant; ***p ≤ 0.001; ****p ≤ 0.0001 significant to the control group (ANOVA). ##p ≤ 0.01 significant to the TRPM7+ CNNM3 group (ANOVA).