. 2021 Oct 25;10:e70129. doi: 10.7554/eLife.70129

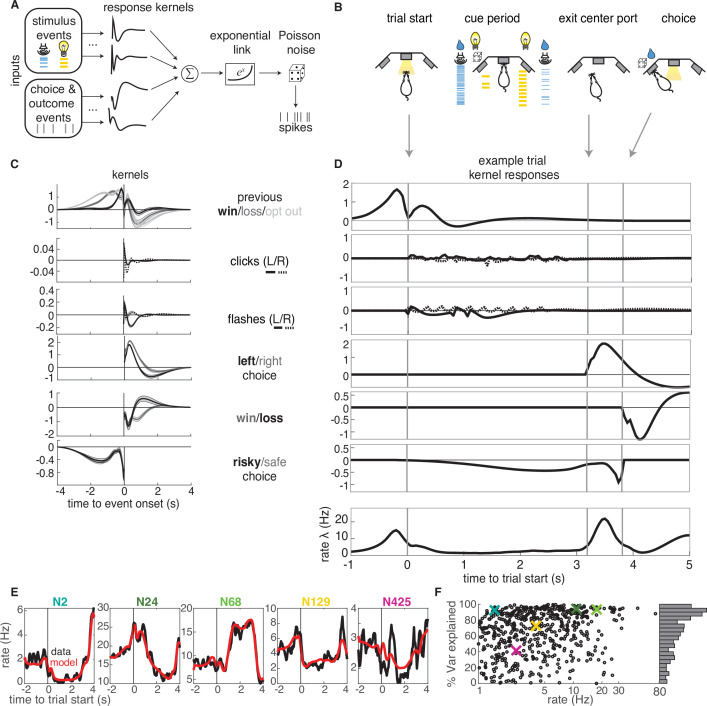
Figure 3. GLM analysis.

(A) Model schematic: the timing of external stimuli conveying reward attributes, as well as timing of choices and outcomes on each trial are model inputs. Nonlinear response kernels convolved with each input generate time dependent responses that are summed and exponentiated to give a mean firing rate, λt, in each time bin. Spikes are generated from a Poisson process with mean firing rate λt. (B) Task schematic illustrating the key choice and outcome inputs to the model. (C) Kernel fits for a sample neuron. Kernels are grouped by the aspects of the task that they model. Error bars denote estimated kernel standard deviation (Materials and methods). (D) Timing of each kernel’s contribution in an example trial. The kernels in bold from panel C are the kernels that are active in this trial. The resulting model-predicted firing rate is shown in the bottom row. (E) Representative PSTHs to held-out testing data from five different neurons (black) and model prediction (red). (F). Variance explained for each neuron, with sample neurons from E denoted by correspondingly colored crosses. The distribution of R2 values is presented along edge of the panel.

Figure 3.

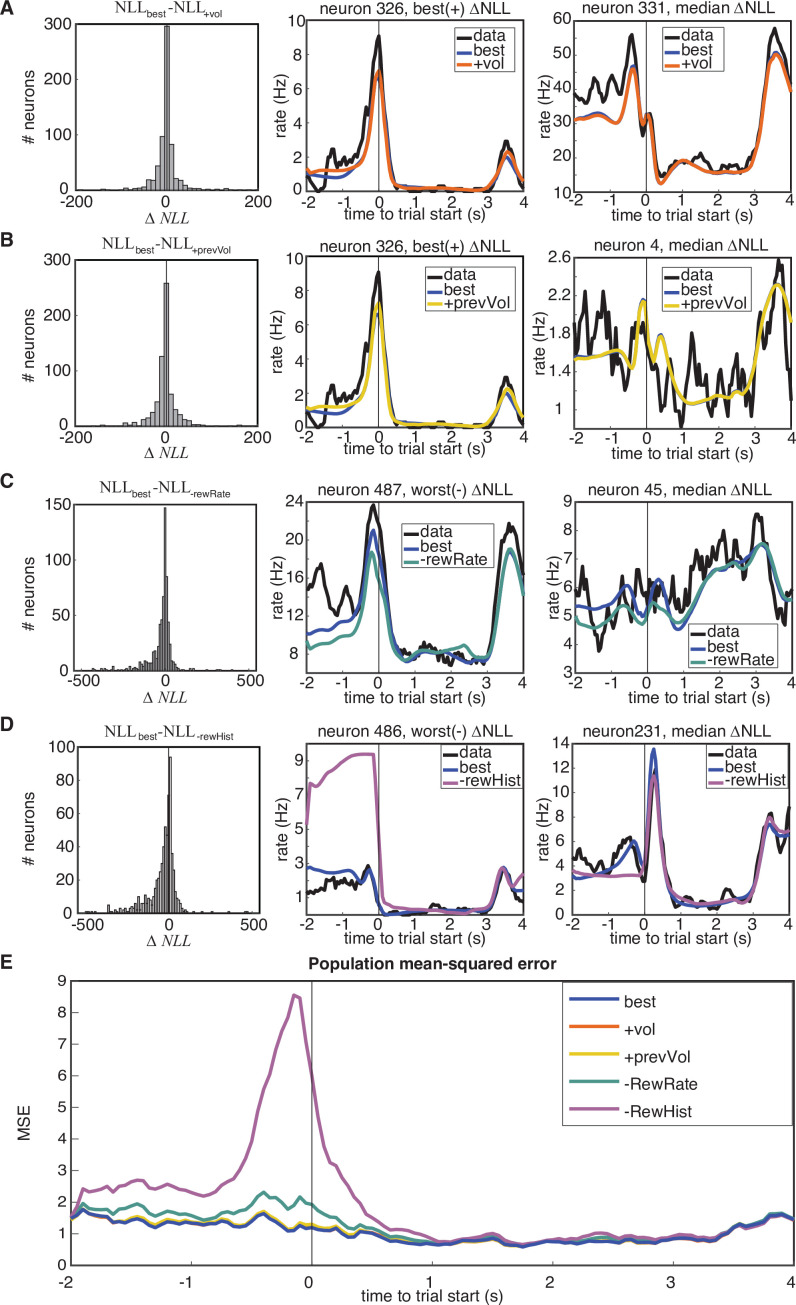
Figure 3—figure supplement 1. Model comparison.

Figure 3—figure supplement 1.

Model ‘best’ was the model utilized in this work, and detailed in Figure 3. Two more complex models (+ vol,+ prevVol), as well as two simpler models (-RewRate,-RewHist) were compared through model comparison on held-out data log-likelihood.+ prevVol substituted previous wins with rewarded volume on the previous trial, and+ vol additionally substituted trial wins with rewarded volume. -RewRate omitted the sessionProgress, prevRewardRate, and previousOptOut kernels, and -RewHist further omitted the remaining reward history kernels. (A-D) Individual model comparisons. (Left) Histograms of the population-level changes in held-out negative log-likelihood demonstrate when a model performs significantly better if the median ΔNLL is different than 0. Significance is assessed through Wilcoxon signed rank test. p§lt;0.001 in all comparisons. Median ΔNLL values were ΔNLLbest,+vol=-0.62, ΔNLLbest,+prevVol=-1.77, ΔNLLbest,-RewRate=-4.14, ΔNLLbest,-RewHist=-15.13. Sample neuron fits demonstrating the most extreme change in ΔNLL are shown in the middle columns, and neurons demonstrating the median change in ΔNLL are shown in right columns. (E) Performance of models assessed through the mean-squared error on PSTHs from held-out test data as compared to model predictions.
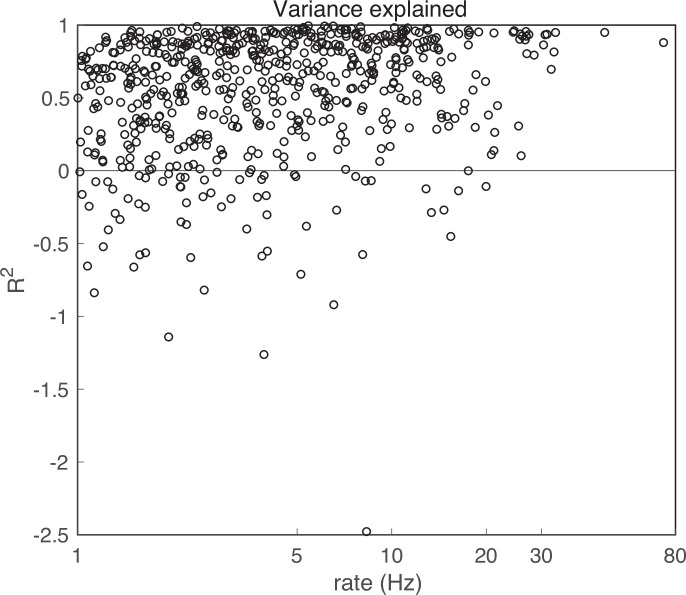
Figure 3—figure supplement 2. Variance explained.

Figure 3—figure supplement 2.

Variance explained, R2 , for all model fits. For 69 units (10.5%), the model had R2 < 0. These units were excluded from further analysis.