. 2021 Nov 25;10:e69418. doi: 10.7554/eLife.69418

Figure 2. Overall architecture of the hybrid supercomplex.

(A) Front view and (B) top view of the cryo-electron microscopy (cryo-EM) map of hybrid supercomplex at 2.68 Å resolution. QcrA, QcrB, and QcrC of the M. tuberculosis cytochrome bcc are colored teal, purple, and salmon, respectively. Other subunits of the hybrid supercomplex are in gray. (C) Cartoon representation of cytochrome bcc, using the same color scheme as above. The twofold symmetry of the dimer is depicted by the gray axis. The heme groups (bH, bL, cD1, and cD2) and menaquinone/menaquinol (MKP/MKN) are shown as stick models. The [2Fe-2S] clusters are shown as spheres. (D) A cross-sectional view (top) of the helices in the cytochrome bcc dimer.

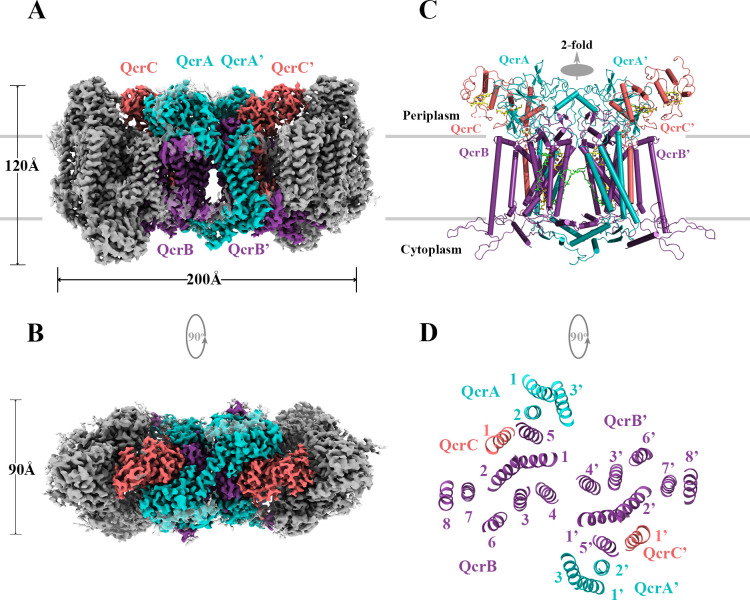
Figure 2—source data 1. Oxygen consumption of the hybrid supercomplex measures using Clark-type oxygen electrode.
elife-69418-fig2-data1.xlsx (113.6KB, xlsx)

Figure 2.

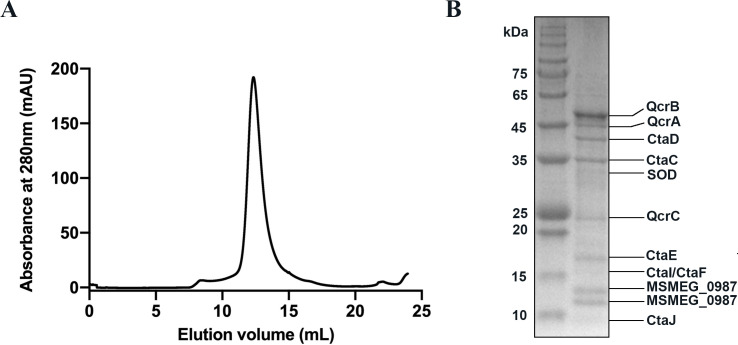
Figure 2—figure supplement 1. Purification and identification of the hybrid supercomplex consisting of M. tuberculosis CIII and M. smegmatis CIV.

Figure 2—figure supplement 1.

(A) The elution profile of the hybrid supercomplex from size-exclusion chromatography (SEC). (B) SDS-PAGE of the pooled fraction from the SEC in (A).
Figure 2—figure supplement 1—source data 1. The elution profile of the hybrid supercomplex from size-exclusion chromatography.
Figure 2—figure supplement 1—source data 2. SDS-PAGE of the pooled fraction from the size-exclusion chromatography.
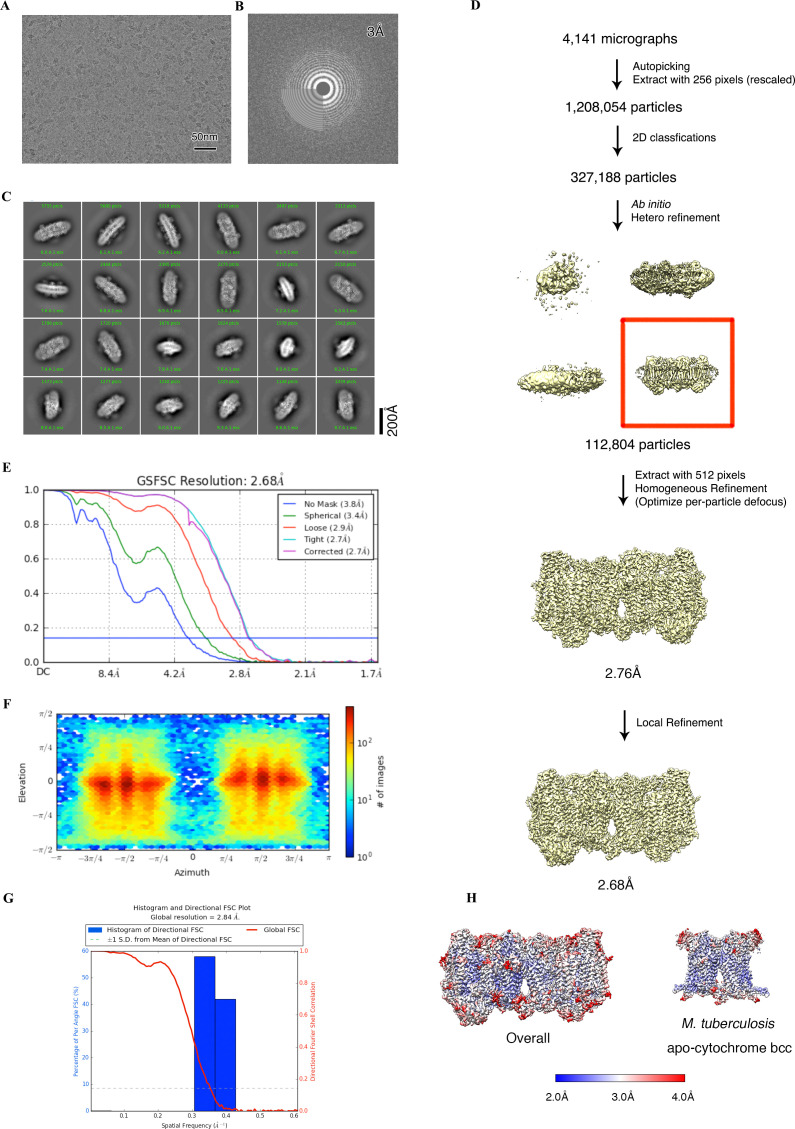
Figure 2—figure supplement 2. Cryo-electron microscopy (cryo-EM) data processing of the apo hybrid supercomplex consisting of M. tuberculosis CIII and M. smegmatis CIV.

Figure 2—figure supplement 2.

(A) Representative electron micrograph of the cryo-EM sample. (B) CTF fit of the motion-corrected micrographs. (C) Representative 2D classification averages calculated from selected particles. (D) Workflow of data processing for the apo hybrid supercomplex. (E) Fourier shell correlation (FSC) curves of 3D reconstructions. (F) View direction of all particles used in the final 3D reconstruction. (G) 3D FSC histogram of the final map. (H) The overall and Mtb cytochrome bcc maps, colored according to the local resolution.
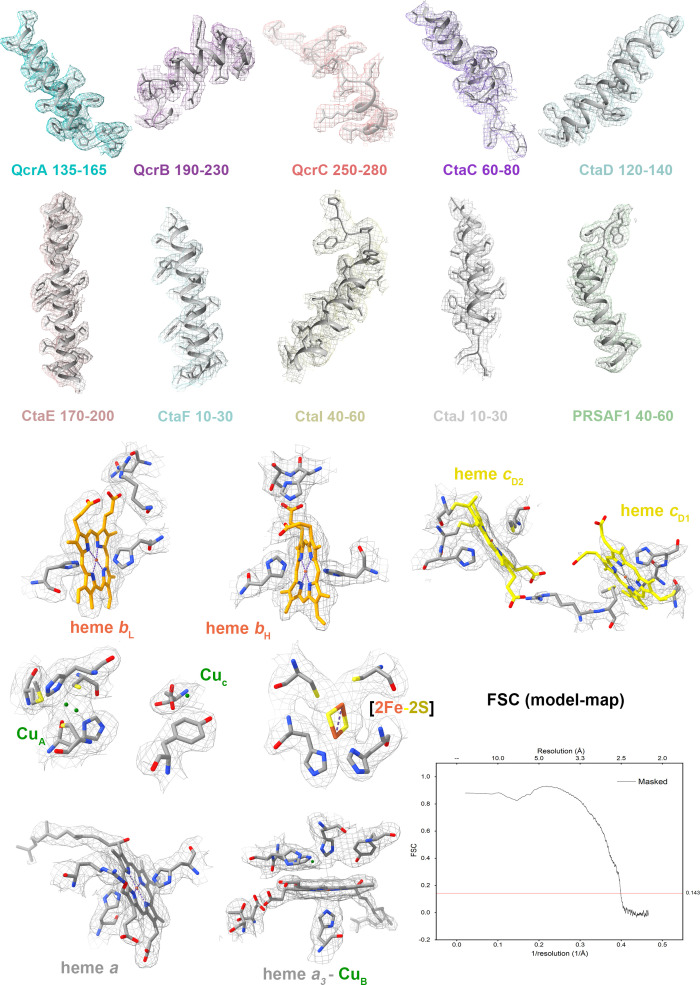
Figure 2—figure supplement 3. Cryo-electron microscopy (cryo-EM) map quality assessment of the hybrid supercomplex.

Figure 2—figure supplement 3.

Representative cryo-EM densities of regions within individual subunits and prosthetic groups. Corresponding subunits with residues and prosthetic groups shown in cartoon representation or as stick models. Map-model Fourier shell correlation (FSC).
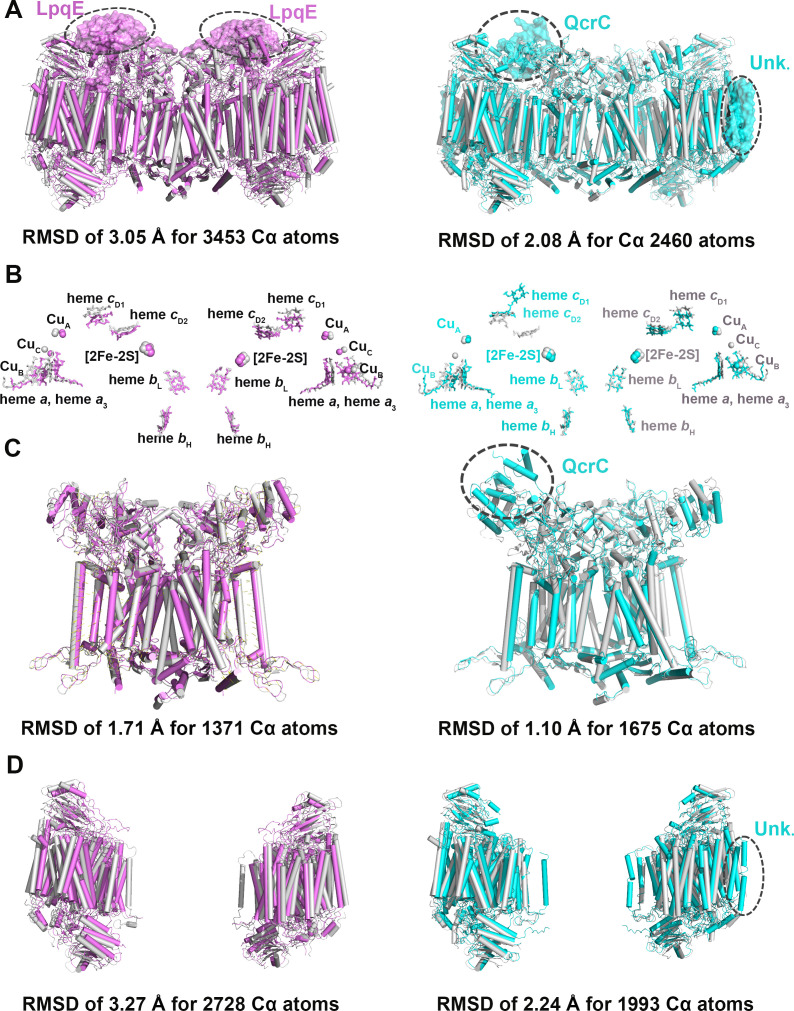
Figure 2—figure supplement 4. Structural comparison of the hybrid supercomplex III2IV2 and native CIII2CIV2 supercomplexes from M. smegmatis.

Figure 2—figure supplement 4.

(A) Superimposition of the hybrid supercomplex III2IV2 (gray) and M. smegmatis CIII2CIV2 supercomplex shown in magenta (PDB 6ADQ) and cyan (PDB 6HWH), respectively. (B) Comparison of prosthetic groups after superimposition. (C) Comparison of CIII2, using the same color scheme as above. (D) Comparison of CIV, using the same color scheme as above.
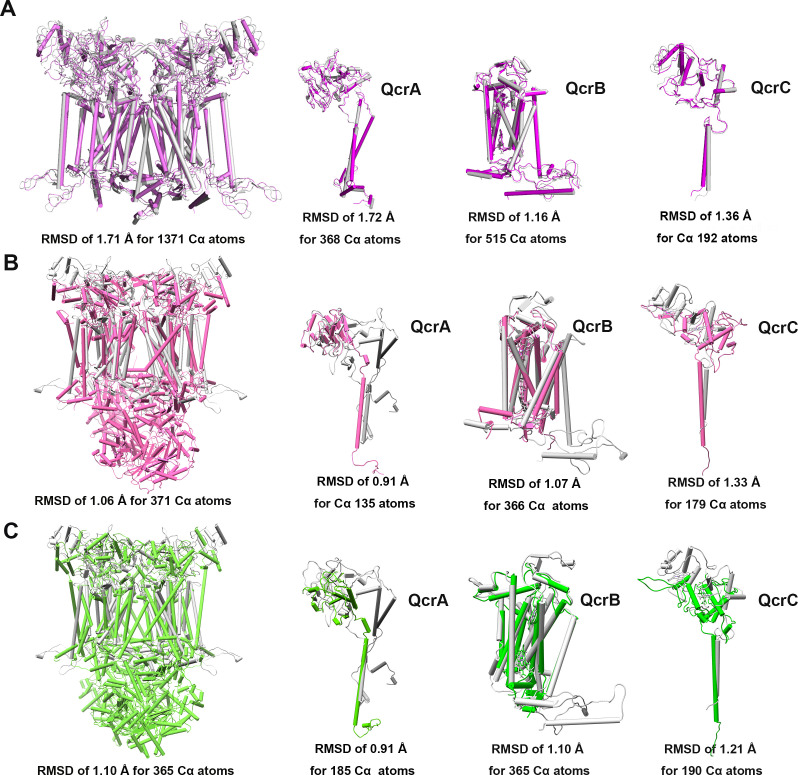
Figure 2—figure supplement 5. Structural alignment between M. tuberculosis CIII and equivalent CIIIs from other species.

Figure 2—figure supplement 5.

These complexes are from M. tuberculosis (gray), M. smegmatis (violet, PDB: 6ADQ) (A), S. cerevisiae (pink, PDB: 1KYO) (B), and Homo sapiens (green; PDB: 5XTE) (C).