

Keywords: pancreas, pancreatitis, RNA-Seq, single cell
Abstract
Chronic pancreatitis (CP) is a complex inflammatory disorder with numerous associated genetic and environmental risk factors. The most distressing characteristic of CP is recalcitrant pain, often requiring surgical resection including total pancreatectomy with islet autotransplantation (TPIAT). We studied five consented subjects undergoing pancreatic resection and processed isolated cells for single-cell RNA sequencing (scRNA-Seq). Using high-dimensional transcriptomic cluster analysis, we identified 11 unique cell clusters in the pancreas tissue. These cell clusters include a cluster of undifferentiated/dedifferentiated cells and two unique clusters of acinar cells, one of which appears to be in a transitional stage. To determine the cellular response to protease inhibitor and stimulation, we treated aliquots of cells from one subject with a protease inhibitor cocktail with and without bethanechol (a muscarinic receptor agonist) at 100 and 400 µM and compared gene expression profiles. The protease inhibitors appeared to reduce cell stress. Pancreatic digestive enzymes and islet hormones were upregulated in both doses of bethanechol-treated cells compared with naïve cells. High-dose bethanechol appeared to be toxic and consistent with hyperstimulation. These studies demonstrate the feasibility of investigating human acinar cell physiology at the single-cell level and initial evidence that these cells retain responsiveness to agonist stimulation with predicted second messenger and transcriptomic responses.
NEW & NOTEWORTHY We conducted single cell RNA sequencing on pancreas tissue from five individuals. We identified eleven unique cell clusters including a large population of dedifferentiated cells as well as two unique clusters of acinar cells, one of which appears to exist in a transitional state. We also examined the cellular response of pancreas tissue to stimulation and identified affected genes and pathways, including pancreatic digestive enzymes.
INTRODUCTION
Chronic pancreatitis (CP) is complex inflammatory disorder with numerous associated genetic and environmental risk factors (1). Advanced CP is characterized by irreversible fibrosis, calcifications, pancreatic atrophy, duct distortion and strictures, pancreatic endocrine dysfunction and dysplasia, pancreatic exocrine dysfunction, and pain syndromes (1). Intractable pain is a serious feature of CP, which results in decreasing quality of life and disability that rivals that observed in cancer and other chronic diseases (2–5). Inflammation from CP can also destroy the islets of Langerhans, resulting in brittle diabetes mellitus (6–8).
Decreasing quality of life, chronic pain, and the risk of brittle diabetes mellitus lead some individuals suffering from chronic pancreatitis to undergo total pancreatectomy with islet autotransplantation (TPIAT) (9–11), wherein, briefly, the pancreas is surgically removed to relieve the pain, then the isolated organ is perfused with collagenase to dissociate the cells and isolate the islets of Langerhans, and the isolated islets are reinfused into the liver to minimize the risk of brittle diabetes mellitus (9). We previously demonstrated that pancreatic tissue samples from patients undergoing TPIAT are useful to study the transcriptome based on CP etiology (12).
Single-cell RNA sequencing (scRNA-Seq) allows for the quantification of RNA expression in individual cells (13, 14). Here, we performed scRNA-Seq analysis on single cells collected from pancreas tissue samples from five individuals undergoing TPIAT or pancreatic resection. Our aim was to determine the relative characteristics of the cell types in patients with various forms of pancreatitis and to determine whether the individual acinar cells were responsive to lower or higher dose muscarinic receptor agonist (bethanechol) with or without protease inhibitors. These results provide new insights into the biology of chronic pancreatitis and indicate that specific types of isolated human acinar cells respond to secretagogue stimulation.
MATERIALS AND METHODS
Human Subjects
All subjects were consented for the collection of biopsies and/or the use of tissue waste before surgery through the Genomic Resource to Enhance Available Therapies (GREAT) study (ClinicalTrials.org NCT04306939), the Prospective Observational Study of TPIAT (POST) study (NCT03260387), or both at the University of Pittsburgh. Surgeries included TPIAT for intractable pain or pancreatoduodenectomy (Whipple procedure) for small neoplasms when normal appearing tissue could be collected several centimeters away from the lesion avoiding upstream obstructive changes or tumor field effects (normal control tissue). For TPIAT, the locations of the tissue (e.g., head, body, mixed) were recorded. The demographic information, comorbidities, and clinical information from each patient were recorded according to study protocols (15).
Single-Cell Preparation
Biopsy or waste tissue samples were collected in ice-cold Advanced DMEM/F12 media and minced with scissors. The tissue was then incubated at 37°C for 30 min in media containing 1 mg/mL collagenase + protease inhibitor (Sigma, Cat. No. C6079) with intermittent agitation. Tissue was then mechanically triturated by wide-bore pipette. In cases where partially separated cells were collected at the end of the islet preparation for TPIAT from the collagenase-degraded pancreas slurry, the slurry was pelleted and then resuspended using a wide-bore pipette. Cells were treated with Accumax cell dissociation solution (Invitrogen, Carlsbad, CA) and incubated at 37°C for 20–30 min with cells being resuspended at 5-min intervals. The resulting cell suspensions from both TPIAT and resection procedures were filtered using the MACS SmartStrainer 30 μM (Miltenyi Biotec, Auburn, CA).
Where indicated, cells were pelleted and resuspended in complete media (Advance DMEM/F12 with 0.1% fetal bovine serum) containing bethanechol and/or protease inhibitor and then incubated for 20 min at 37°C. Bethanechol (Calbiotech, Cat. No. 505773) was diluted from a 40 mM stock solution dissolved in H2O. Protease inhibitor cocktail (Roche, Cat. No. 04693116001) was diluted from a ×25 stock solution dissolved in H2O. All cells were washed, pelleted, and resuspended in PBS with 0.04% BSA. Cells were then kept on ice until library preparation. The Cellometer Auto 2000 Cell Viability Counter (Nexcelom Bioscience, Lawrence, MA) was used to assess cell viability.
Single-Cell Library Preparation
Single-cell cDNA libraries were prepared by the Lafyatis laboratory using droplet-based technology from 10× Genomics. Gel bead-in-emulsions were prepared using the 10× Genomics Chromium Controller, and single-cell libraries were generated according to the 10× Genomics Chromium Single-Cell 3' v2 protocol (https://support.10xgenomics.com/single-cell-gene-expression/library-prep/doc/user-guide-chromium-single-cell-3-reagent-kits-user-guide-v2-chemistry).
Single-Cell RNA Sequencing
Single-cell libraries were sequenced at the UPMC Genome Center (Pittsburgh, PA). Quality of the samples was assessed using the High Sensitivity NGS Fragment Analyzer Kit (AATI, Ankeny, IA). The libraries were quantified using the KAPA Library Quantification Kit (Roche, Basel, Switzerland), and sequencing was performed using NovaSeq S1, S2, or S4 flow cells (Illumina, San Diego, CA).
Single-Cell RNA-Sequencing Analysis
scRNA-Seq reads were mapped to reference genome hg37 using TOPHAT (16). Mapped scRNA-Seq reads were analyzed using Seurat (17) in R (18), which is detailed in the Whitcomb Lab GitHub repository (https://github.com/Whitcomb-Lab/scRNA-Seq_analysis). Briefly, cells expressing fewer than 200 and greater than 3,000 genes as well as cells expressing greater than 10% mitochondrial RNA were filtered from the data set and excluded from subsequent analyses. Data from remaining cells underwent the jackstraw test to identify the significant principal components, followed by identifying neighboring cells and cell clusters and Uniform Manifold Approximation and Projection (UMAP) dimensional reduction. Cell types were identified from cell clusters using PanglaoDB (19) or by RNA expression of cell type markers.
Pathway Enrichment Analysis
Pathway enrichment analysis of differentially expressed genes was performed using FUMA v1.3.6 (20, 21).
Immunofluorescence Staining
Paraffin sections (5 μm) were deparaffinized and rehydrated. Sections were blocked with 2% normal donkey serum for 45 min and stained overnight for primaries mouse anti-hCHRM3 (Cat. No. MAB6378, R&D) and rabbit anti-α-amylase (Cat. No. A8273, Invitrogen). Secondary antibodies anti-mouse Cy3 (Cat. No. 715-165-150, Jackson Immuno) and anti-rabbit Alexa 488 (Cat. No. A21206, Invitrogen) were added for 1 h. Nuclei were stained with Hoechst (Cat. No. B2883, Sigma) 1 mg/100 mL dH2O for 1 min, washed in PBS, and mounted in gelvatol. Large area scan images at ×20 magnification were obtained on Nikon A1 confocal microscope with NIS Elements v5.2.
RESULTS
Single-Cell RNA-Sequencing of Diseased Pancreatic Tissue Reveals 11 Distinct Cell Clusters
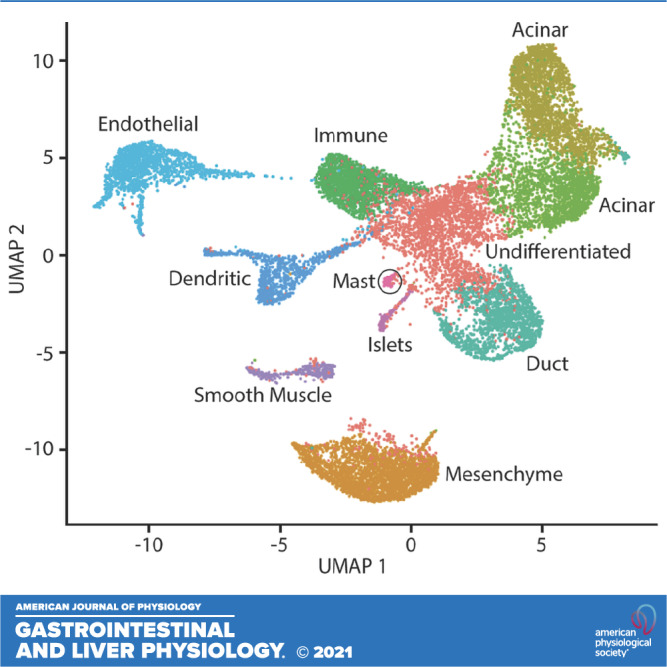
The initial analysis was on unstimulated, no-protease inhibitor samples (i.e., naïve samples, standard prep). We used Seurat to generate anchor markers for the five naïve samples, which were then used to combine the samples. The combined data set underwent jackstraw test and normalization, and cell neighbors were identified. We then identified 11 separate cell clusters in the data set (Fig. 1). We calculated the differentially expressed genes in each cluster by comparing the RNA expression of all cells in a cluster to RNA expression of all cells of all other clusters (Supplemental Tables S1–S11, all supplemental material is available at https://github.com/Whitcomb-Lab/scRNA-Seq_analysis). The 10 differentially expressed markers with the highest log-fold change of each of the 11 clusters were entered into PanglaoDB (19), and expression of known cell type markers was used to estimate the most likely cell types that are represented in each cluster.
Figure 1.
Uniform Manifold Approximation and Projection (UMAP) plot of combined pancreas cell samples. A UMAP plot was generated using cell clusters identified in Seurat. Unique cell clusters vary in color. The cell type of each cluster was determined from differentially expressed genes in the cell cluster using PanglaoDB or from expression of cell type markers (e.g., PRSS1, CFTR, INS).
Cluster 0.
These cells (see Fig. 1, red cells) are of an unknown cell type, which we hypothesize to be a cluster of dedifferentiated cells based on wide and varied expression of cell markers from numerous cell types including acinar, duct, islet, and endothelial cells. Few cells in this data set express PDX1; however, cluster 0 is among the greatest PDX1 expression of all clusters (Fig. 2).
Figure 2.

PDX1 expression. A: cellular expression of PDX1. The expression of PDX1 in each cell overlaid onto the combined UMAP plot. Cells with the greatest relative expression are red and cells with the lowest relative expression are gray. B: violin plot of PDX1 expression. Expression level of PDX1 in each cell (y-axis), stratified by cell cluster (x-axis). UMAP, Uniform Manifold Approximation and Projection.
Cluster 1.
These cells (see Fig. 1, orange cells) share markers of fibroblasts and also unknown cells, which may be mesenchymal cells based on the differential expression of COL1A1 and THY1 (adjusted P = 9.6e−204 and 1.5e−181, respectively), which are markers of mesenchyme cells (22).
Acinar cells.
The cells of cluster 2 and cluster 3 (see Fig. 1, green-yellow cells and green cells, respectively) are both identified as acinar cells, as expected since both clusters express acinar cell markers PRSS1, PNLIP, and AMY2B (22) (cluster 2 adjusted P = 0, 0, and 0, respectively; cluster 3 adjusted P = 0, 0, and 0, respectively; Fig. 3).
Figure 3.

Expression of acinar cell markers PRSS1, PNLIP, and AMY2B. A: cellular expression of PRSS1. The expression of PRSS1 in each cell overlaid onto the combined Uniform Manifold Approximation and Projection (UMAP) plot. Cells with the greatest relative expression are red and cells with the lowest relative expression are gray. B: violin plot of PRSS1 expression. Expression level of PRSS1 in each cell (y-axis), stratified by cell cluster (x-axis). C: cellular expression of PNLIP. The expression of PNLIP in each cell overlaid onto the combined UMAP plot. Cells with the greatest relative expression are red and cells with the lowest relative expression are gray. D: violin plot of PNLIP expression. Expression level of PNLIP in each cell (y-axis), stratified by cell cluster (x-axis). E: cellular expression of AMY2B. The expression of AMY2B in each cell overlaid onto the combined UMAP plot. Cells with the greatest relative expression are red and cells with the lowest relative expression are gray. F: violin plot of AMY2B expression. Expression level of AMY2B in each cell (y-axis), stratified by cell cluster (x-axis).
Immunocytes.
Cluster 4 cells (see Fig. 1, Kelly green cells) differentially express immune cell markers CXCR4 (T cells) (23, 24) (adjusted P = 0) and KLRB1 (natural killer cells) (25) (adjusted P = 0).
Duct cells.
The 10 differentially expressed genes with the greatest average log-fold change in cluster 5 cells (see Fig. 1, teal cells) are not representative of a known cell type; however, we hypothesize cluster 5 to be duct cells as cluster 5 cells differentially express duct cell markers CFTR, KRT19, and SPP1 (22) (adjusted P = 0, 0, and 0, respectively; Fig. 4).
Figure 4.

Expression of duct cell markers CFTR, KRT19, and SPP1. A: cellular expression of CFTR. The expression of CFTR in each cell overlaid onto the combined Uniform Manifold Approximation and Projection (UMAP) plot. Cells with the greatest relative expression are red and cells with the lowest relative expression are gray. B: violin plot of CFTR expression. Expression level of CFTR in each cell (y-axis), stratified by cell cluster (x-axis). C: cellular expression of KRT19. The expression of KRT19 in each cell overlaid onto the combined UMAP plot. Cells with the greatest relative expression are red and cells with the lowest relative expression are gray. D: violin plot of KRT19 expression. Expression level of KRT19 in each cell (y-axis), stratified by cell cluster (x-axis). E: cellular expression of SPP1. The expression of SPP1 in each cell overlaid onto the combined UMAP plot. Cells with the greatest relative expression are red and cells with the lowest relative expression are gray. F: violin plot of SPP1 expression. Expression level of SPP1 in each cell (y-axis), stratified by cell cluster (x-axis).
Endothelial cells.
Cluster 6 cells (see Fig. 1, light blue cells) were identified as endothelial cells and differentially express ESAM (adjusted P = 0), an endothelial cell marker (22).
Dendritic cells.
Cluster 7 cells (blue cells, Fig. 1) are likely dendritic cells as indicated by PanglaoDB based on the expression of C1QA, CCL3, and CD74 (adjusted P = 0, 0, and 0, respectively).
Vascular smooth muscle cells.
Cluster 8 cells (see Fig. 1, purple cells) differentially express vascular smooth muscle markers MYL9 and CALD1 (adjusted P = 1.9e−207 and 2.0e−176, respectively) (26).
Islet cells.
Cluster 9 cells (see Fig. 1, violet cells) are islet cells as they differentially express INS and GCG (adjusted P = 8.4e−44 and 4.0e−68, respectively; Fig. 5) (22).
Figure 5.

Expression of acinar cell markers INS, GCG, PPY, and SST. A: cellular expression of INS. The expression of INS in each cell overlaid onto the combined Uniform Manifold Approximation and Projection (UMAP) plot. Cells with the greatest relative expression are red and cells with the lowest relative expression are gray. B: violin plot of INS expression. Expression level of INS in each cell (y-axis), stratified by cell cluster (x-axis). C: cellular expression of GCG. The expression of GCG in each cell overlaid onto the combined UMAP plot. Cells with the greatest relative expression are red and cells with the lowest relative expression are gray. D: violin plot of GCG expression. Expression level of GCG in each cell (y-axis), stratified by cell cluster (x-axis). E: cellular expression of PPY. The expression of PPY in each cell overlaid onto the combined UMAP plot. Cells with the greatest relative expression are red and cells with the lowest relative expression are gray. F: violin plot of PPY expression. Expression level of PPY in each cell (y-axis), stratified by cell cluster (x-axis). G: cellular expression of SST. The expression of SST in each cell overlaid onto the combined UMAP plot. Cells with the greatest relative expression are red and cells with the lowest relative expression are gray. H: violin plot of SST expression. Expression level of SST in each cell (y-axis), stratified by cell cluster (x-axis).
Mast cells.
Cluster 10 cells [see Fig. 1, pink cells (circled)] differentially express TPSAB1 and TPSB2 (adjusted P = 9.1e−66 and 3.5e−65, respectively), which are mast cell markers (26).
The cell clusters are not present equally across all samples (Fig. 6). As stated above, the largest cell cluster, cluster 0, is composed of cells undergoing dedifferentiation, and these dedifferentiated cells range in abundance across all samples from as few as 1.7% of all cells in sample WHI101A1 to 32% of all cells in G2420 (the single control sample; see Fig. 6). This suggests that these dedifferentiated cells are abundant in normal, healthy pancreas, and these cell populations are depleted in pancreatitis. There is, however, a wide range in the proportion of dedifferentiated cells among the pancreatitis samples (1.7–27.5%), and we hypothesized that age or duration of disease may be associated with the proportion of dedifferentiated cells in the pancreatitis samples (n = 4). We found no association between age at the time of TPIAT and the proportion of dedifferentiated cells in samples originating from pancreatitis samples (P = 0.38, Cochran–Armitage test for trend). We also found no association between the proportion of dedifferentiated cells and the number of years from pancreatitis diagnosis to TPIAT (P = 0.065, Cochran–Armitage test for trend).
Figure 6.

Proportion of cell clusters by sample and individual sample Uniform Manifold Approximation and Projection (UMAP) plots. Top: the proportion of each cell cluster (by number) from the total cells of each sample. Bottom: individual UMAP plots for each sample.
Single-Cell RNA-Sequencing of Diseased Pancreatic Tissue Reveals Two Distinct Population of Acinar Cells
Of the 11 cell clusters identified in our analyses, two cell clusters, clusters 2 and 3, express molecular markers of acinar cells PRSS1, PNLIP, and AMY2B (see Fig. 3). We compared RNA expression in cluster 2 to RNA expression in cluster 3 to determine how these two clusters of acinar cells differed. We found that 100% of the cells in cluster 2 express PRSS1, PNLIP, and AMY2B, and nearly all cells in cluster 3 express the PRSS1, PNLIP, and AMY2B (100%, 99.9%, and 98.9%, respectively); however, the expression of all three markers is greater in cluster 2 compared with cluster 3 with mean log-fold changes of 1.00, 0.977, and 1.21, respectively (P < 0.0001, P < 0.0001, and P < 0.0001, respectively). We explored the remaining differentially expressed genes between cluster 2 and cluster 3 (Supplemental Table S12; differentially expressed transcripts) and found genes associated with cell proliferation (FOS, FOSB, IFRD1, BTG2) (27, 28), motility (MALAT1) (29), and stress response (HSPA1A, HSPA1B) (30) to be upregulated in cluster 3.
RNA Expression in Isolated Pancreas Cells Treated with Protease Inhibitor and/or Bethanechol
The tissue used in our analyses was collected from individuals who had been fasting before surgery, and, therefore, the gene expression in this tissue may vary from the normal (nonfasting) gene expression. Similarly, we hypothesized that the use of protease inhibitor on pancreas tissue during the cell isolation process may alter measured gene expression in the samples. To better understand how gene expression may differ between fasting and nonfasting states, as well as with protease inhibitor treatment, we conducted a pilot study on aliquots of cells from one individual, WHI101A, and stimulated the cells with bethanechol, with or without the diluted protease inhibitor cocktail. Five treatments were performed: 1× protease inhibitor, 100 μM bethanechol, 400 μM bethanechol (based on published in vitro studies (31–35)], 1× protease inhibitor and 100 μM bethanechol, and 1× protease inhibitor and 400 μM bethanechol. After treatment, single-cell libraries were prepared, sequenced, analyzed, and compared with naïve tissue from the same individual.
RNA of the muscarinic receptor CHRM3 was detected in multiple cell type in our single-cell data set and CHRM3 protein expression in acinar cells was confirmed with immunofluorescence (Fig. 7). Differential expression analysis of the scRNA-Seq data of treated samples and the naïve sample are as follows. Eighty-four genes were differentially expressed between the 1× protease inhibitor-treated sample and the naïve sample (Supplemental Table S13). Sixty-five genes were differentially expressed between the 100 μM bethanechol-treated sample and the naïve sample (Supplemental Table S14). Fifty-five genes were differentially expressed between the 400 μM bethanechol-treated sample and the naïve sample (Supplemental Table S15). One hundred forty-six genes were differentially expressed between the 1× protease inhibitor and 100 μM bethanechol-treated sample and the naïve sample (Supplemental Table S16). Ninety genes were differentially expressed between the 1× protease inhibitor and 400 μM bethanechol-treated sample and the naïve sample (Supplemental Table S17). One hundred twenty-one genes were differentially expressed between the sample treated with 100 μM bethanechol and protease inhibitor and the sample treated with 100 μM bethanechol without protease inhibitor (Supplemental Table S18).
Figure 7.
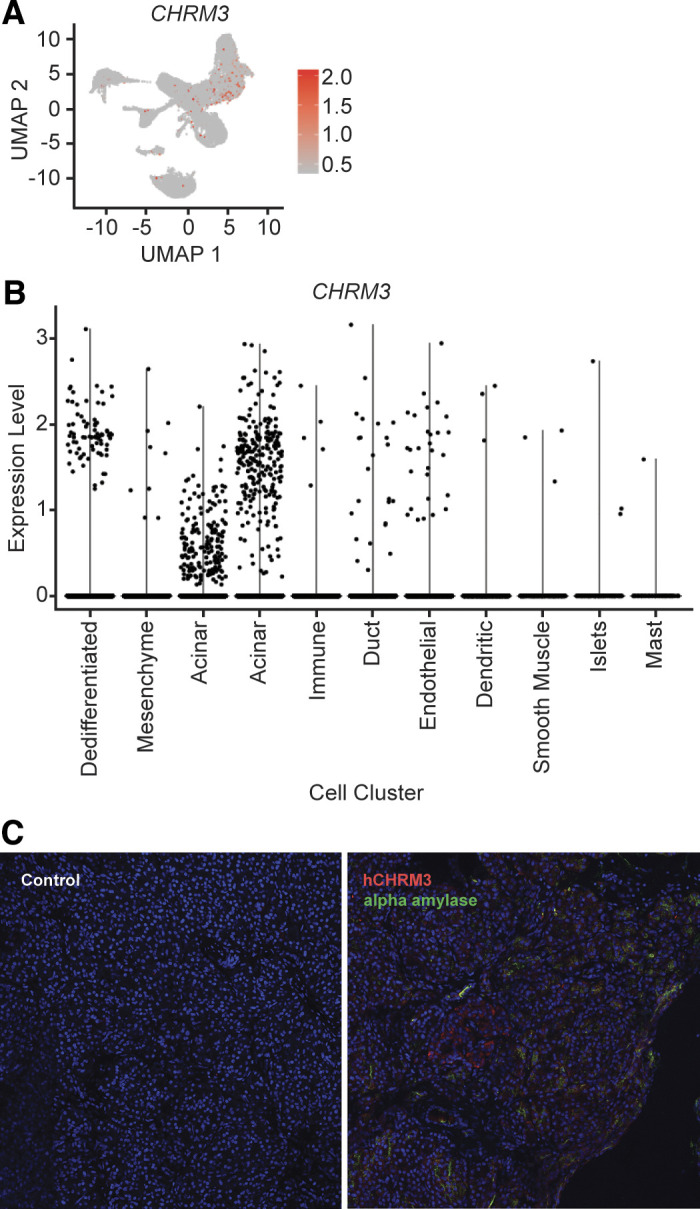
CHRM3 expression. A: cellular expression of CHRM3. The expression of CHRM3 in each cell overlaid onto the combined Uniform Manifold Approximation and Projection (UMAP) plot. Cells with the greatest relative expression are red and cells with the lowest relative expression are gray. B: violin plot of CHRM3 expression. Expression level of CHRM3 in each cell (y-axis), stratified by cell cluster (x-axis). C: immunofluorescence of hCHRM3 expression in human acinar cells. Immunofluorescence imaging control without primary antibodies (left) and immunofluorescence with primary antibodies (right) for hCHRM3 (red) and α-amylase (green).
After differential expression analysis, pathway enrichment analysis was performed using the gene symbols of the differentially expressed genes. Four hundred thirty-six gene expression pathways were enriched between the 1× protease inhibitor-treated sample and the naïve sample (Supplemental Table S19). Two hundred and two gene expression pathways were enriched between the 100 μM bethanechol-treated sample and the naïve sample (Supplemental Table S20). Two hundred thirty-six gene expression pathways were enriched between the 400 μM bethanechol-treated sample and the naïve sample (Supplemental Table S21). Five hundred thirty-one gene expression pathways were enriched between the 1× protease inhibitor and 100 μM bethanechol-treated sample and the naïve sample (Supplemental Table S22). Three hundred sixty-four gene expression pathways were enriched between the 1× protease inhibitor and 400 μM bethanechol-treated sample and the naïve sample (Supplemental Table S23). Three thousand two hundred twenty-nine genes were differentially expressed between the sample treated with 100 μM bethanechol and protease inhibitor and the sample treated with 100 μM bethanechol without protease inhibitor (Supplemental Table S24).
Significant increase in expression of multiple pancreatic digestive enzymes (adjusted P < 1e−6) were observed with 100 µM bethanechol treatment with protease inhibitor (in descending order of significance): CTRB2, AMY2A, CPB1, CTRC, PRSS2, CPA1 CTRB1, PRSS1 CELA3A, PLA2G1B, PNLIP, CEL, CPA2, AMY2B, PRSS3, and CELA2B and with 400 µM bethanechol treatment with protease inhibitor PRSS1, PRSS2, PNLIP, CELA3A, CTRB1, PLA2G1B, CTRC, AMY2A, CPA2, CELA2B, CB1, and CTRB2 (see Supplemental Tables S16 and S17). The relative increase pancreatic digestive enzyme expression is given in Table 1.
Table 1.
Differential expression of pancreatic digestive enzymes postbethanechol treatment
| 100 µM Bethanechol + 1× Protease Inhibitor |
400 µM Bethanechol + 1× Protease Inhibitor |
|||
|---|---|---|---|---|
| Gene symbol | Mean log-fold change | Adjusted P value | Mean log-fold change | Adjusted P value |
| AMY2A | 0.6 | 2.62e − 84 | 0.4 | 7.62e − 11 |
| AMY2B | 0.49 | 2.13e − 24 | NS | NS |
| CEL | 0.36 | 1.75e − 44 | NS | NS |
| CELA2B | 0.47 | 2.62e − 16 | 0.25 | 6.84e−06 |
| CELA3A | 0.67 | 6.50e − 58 | 0.35 | 3.29e − 46 |
| CPA1 | 0.57 | 2.63e − 68 | NS | NS |
| CPA2 | 0.53 | 4.84e − 35 | 0.26 | 1.24e − 07 |
| CPB1 | 0.61 | 3.57e − 82 | 0.4 | 0.00045928 |
| CTRB1 | 0.59 | 5.68e − 68 | 0.3 | 3.13e − 37 |
| CTRB2 | 0.66 | 4.29e − 92 | 0.36 | 0.0111704 |
| CTRC | 0.66 | 1.35e − 77 | 0.35 | 3.75e − 18 |
| GCG | NS | NS | 0.25 | 2.24e − 15 |
| INS | 0.53 | 0 | NS | NS |
| PLA2G1B | 0.7 | 2.78e − 49 | 0.35 | 3.13e − 23 |
| PNLIP | 0.57 | 2.04e − 46 | 0.29 | 7.39e − 52 |
| PPY | 1.24 | 2.23e − 40 | −0.33 | 1.05e − 139 |
| PRSS1 | 0.7 | 5.51e − 65 | 0.35 | 1.73e − 81 |
| PRSS2 | 0.72 | 3.48e − 76 | 0.35 | 3.43e − 72 |
| PRSS3 | 0.59 | 5.65e − 22 | 0.31 | 5.59e−05 |
| SPINK1 | 0.76 | 1.07e − 60 | NS | NS |
Differential expression of pancreatic digestive enzymes in bethanechol-treated cells compared with naïve cells. Cells treated with either 100 μM bethanechol + 1× protease inhibitor or 400 μM bethanechol + 1× protease inhibitor were compared with naïve cells. The differentially expressed pancreatic enzymes are shown. Bold values indicates highly significant (adjusted P < 1e−6) differential expression. NS, not significant.
We also noted striking differences in islet cell hormone expression with the two doses of bethanechol. With 100 µM bethanechol treatment, there was significant increase in INS (insulin, adjusted P = 0) and PIK3R1 (necessary for the insulin-stimulated increase in glucose uptake and glycogen synthesis in insulin-sensitive tissues; adjusted P = 8.95e−122) followed, by PPY (adjusted P = 2.23e−40). In contrast, 400 µM bethanechol markedly altered the expression of insulin with the only islet hormones reaching significance at the adjusted cutoff of P value <1e−6 being PPY (pancreatic polypeptide, P = 1.05e−139) and GCG (glucagon, P = 2.24e−15; see Supplemental Tables S16 and S17).
Of the aforementioned pancreatic digestive enzymes and islet cell hormones, PIK3R1 (adjusted P = 1.19e−108) and PPY (adjusted P = 3.88e−24) were differentially expressed in the protease inhibitor treatment alone.
DISCUSSION
Here, we identified 11 unique pancreas cell clusters, and our results are largely consistent with previous findings (22, 36–38). We tested hypotheses that the undifferentiated/dedifferentiated cells are associated with tissue regeneration with capacity to differentiating into other cell types as the pancreas recovers from injury, and that the proportion of dedifferentiated cells in individuals with pancreatitis decreasing with increasing age or an increasing duration of disease. However, the proportion of dedifferentiated cells was not associated with these conditions. Of note, two of the four individuals with pancreatitis have a history of alcohol abuse and, anecdotally, their proportion of dedifferentiated cells was less than that of the two pancreatitis cases without histories of alcohol abuse. Although the observation is striking, the study is underpowered to make conclusions.
Of the 11 distinct cell clusters, we identified two clusters of acinar cells, cluster 2 and cluster 3. This finding is similar to the recent observations reported by Qadir et al. (37). Differential expression analysis of the cells in cluster 2 and cluster 3 identified differential expression in genes associated with cell proliferation, migration, and survival. This suggests that cells in cluster 3 are in a state of dedifferentiation/redifferentiation as cells are transitioning between clusters 0 and 2.
Proteases are required to disperse cells and islets form pancreatic tissue. These proteases may also degrade proteins on the cell surface and affect intracellular cell biology. Differentially expressed genes between the 1× protease inhibitor treated and naïve cells were enriched in pathways including those associated with apoptosis and the extracellular matrix (ECM), suggesting that the protease inhibitor is protecting the cells from damage caused by endogenous proteases, and components of the ECM are particularly vulnerable to endogenous proteases.
The isolated cells expressed functional muscarinic receptors with intact second messenger systems. This conclusion from the pilot study is based on the pattern of differentially expressed genes between the cells from both treatments including 100 μM bethanechol and naïve cells. Bethanechol-treated cells were enriched in pathways associated with pancreatic digestive enzymes associated with nutrient digestion and absorption, digestion of lipids, and vitamin transport and metabolism. Pathways associated with digestion were not enriched in the comparison of 400 μM bethanechol alone and naïve cells, but pathways associated with vitamin transport and metabolism were enriched in the comparison of 400 μM bethanechol with 1× protease inhibitor and naïve cells. Of note, the proportional expression of the pancreatic digestive enzymes changed with the degree of stimulation. The pathway analysis suggests that 400 μM of bethanechol hyperstimulates the pancreas cells, leading to hypercalcemia and triggering apoptosis.
Islet cell hormone response was markedly different between doses of bethanechol, with 100 μM bethanechol markedly increasing insulin (INS) and PIK3R1 as needed for insulin response. In contrast, 400 μM bethanechol suppressed INS but increased PPY and GLG, which are inhibitory hormones. These results are preliminary as they are from a single subject who, by chance had the lowest levels of the cluster 0 cell. Further research to understand the responses of isolated pancreatic cells to disease etiology and provocation by neurotransmitters, hormones, or other agents is needed.
In summary, using scRNA-Seq analysis, we identified 11 unique pancreas cell clusters, including two distinct clusters of acinar cells. The genes that are differentially expressed between the two acinar cell clusters include genes associated with cell migration, survival, and proliferation, which suggests a cellular response to pancreatitis injury. We also have demonstrated that the use of protease inhibitor and bethanechol alter the expression patterns of mRNA in our samples. These preliminary results justify further studies on the physiology and pathophysiological response of individual human pancreatic cells.
SUPPLEMENTAL DATA
Supplemental Tables S1–S17 are available on the Whitcomb Laboratory GitHub repository (https://github.com/Whitcomb-Lab/scRNA-Seq_analysis).
GRANTS
This study was supported by National Institutes of Health Grants T32DK063922 (to B.M.B., C.A.S.O., and D.C.W.), UPMC Precision Medicine Grant (to D.C.W), U01 CA200466 (to R.B., A.D.S.), DK120737 (to J.L.S.), and University of Pittsburgh Clinical and Translational Science Institute Grant UL1TR000005 (to Principal Investigator, Steve Reis).
DISCLOSURES
No conflicts of interest, financial or otherwise, are declared by the authors with data use under National Insitutes of Health guidelines.
AUTHOR CONTRIBUTIONS
B.M.B., D.C.W., C.A.S.O., R.B., R.L., R.B., M.W., A.H.Z., and K.K.L. conceived and designed research; B.M.B., M.A.R., D.S., and J.L.S. performed experiments; B.M.B., A.D.S., D.S., and C.A.S.O. analyzed data; B.M.B. and D.S. interpreted results of experiments; B.M.B. and D.S. prepared figures; B.M.B., D.C.W., and J.L.S. drafted manuscript; B.M.B., A.D.S., D.C.W., J.L.S., C.A.S.O., R.B., R.L., R.B., M.W., A.H.Z., and K.K.L. edited and revised manuscript; B.M.B., J.L.S., C.A.O., R.B., R.L., R.B., M.W., A.H.Z., K.K.L., A.D.S., M.A.R., D.S., and D.C.W. approved final version of manuscript.
ACKNOWLEDGMENTS
S. Ohlsen is now employed by Ariel Precision Medicine, Pittsburgh, PA. R. Bottino is now employed by Imagine Pharma, Pittsburgh, PA.
REFERENCES
- 1.Whitcomb DC, Frulloni L, Garg P, Greer JB, Schneider A, Yadav D, Shimosegawa T. Chronic pancreatitis: an international draft consensus proposal for a new mechanistic definition. Pancreatology 16: 218–224, 2016. doi: 10.1016/j.pan.2016.02.001. [DOI] [PMC free article] [PubMed] [Google Scholar]
- 2.Amann ST, Yadav D, Barmada MM, O’Connell M, Kennard ED, Anderson M, Baillie J, Sherman S, Romagnuolo J, Hawes RH, AlKaade S, Brand RE, Lewis MD, Gardner TB, Gelrud A, Money ME, Banks PA, Slivka A, Whitcomb DC. Physical and mental quality of life in chronic pancreatitis: a case-control study from the North American Pancreatitis Study 2 cohort. Pancreas 42: 293–300, 2013. doi: 10.1097/MPA.0b013e31826532e7. [DOI] [PMC free article] [PubMed] [Google Scholar]
- 3.Anderson MA, Akshintala V, Albers KM, Amann ST, Belfer I, Brand R, Chari S, Cote G, Davis BM, Frulloni L, Gelrud A, Guda N, Humar A, Liddle RA, Slivka A, Gupta RS, Szigethy E, Talluri J, Wassef W, Wilcox CM, Windsor J, Yadav D, Whitcomb DC. Mechanism, assessment and management of pain in chronic pancreatitis: recommendations of a multidisciplinary study group. Pancreatology 16: 83–94, 2016. doi: 10.1016/j.pan.2015.10.015. [DOI] [PMC free article] [PubMed] [Google Scholar]
- 4.Machicado JD, Amann ST, Anderson MA, Abberbock J, Sherman S, Conwell DL, Cote GA, Singh VK, Lewis MD, Alkaade S, Sandhu BS, Guda NM, Muniraj T, Tang G, Baillie J, Brand RE, Gardner TB, Gelrud A, Forsmark CE, Banks PA, Slivka A, Wilcox CM, Whitcomb DC, Yadav D. Quality of life in chronic pancreatitis is determined by constant pain, disability/unemployment, current smoking, and associated co-morbidities. Am J Gastroenterol 112: 633–642, 2017. doi: 10.1038/ajg.2017.42. [DOI] [PMC free article] [PubMed] [Google Scholar]
- 5.Mullady DK, Yadav D, Amann ST, O'Connell MR, Barmada MM, Elta GH, Scheiman JM, Wamsteker EJ, Chey WD, Korneffel ML, Weinman BM, Slivka A, Sherman S, Hawes RH, Brand RE, Burton FR, Lewis MD, Gardner TB, Gelrud A, DiSario J, Baillie J, Banks PA, Whitcomb DC, Anderson MA; NAPS2 Consortium. Type of pain, pain-associated complications, quality of life, disability and resource utilisation in chronic pancreatitis: a prospective cohort study. Gut 60: 77–84, 2011. doi: 10.1136/gut.2010.213835. [DOI] [PMC free article] [PubMed] [Google Scholar]
- 6.Bellin MD, Whitcomb DC, Abberbock J, Sherman S, Sandhu BS, Gardner TB, Anderson MA, Lewis MD, Alkaade S, Singh VK, Baillie J, Banks PA, Conwell D, Cote GA, Guda NM, Muniraj T, Tang G, Brand RE, Gelrud A, Amann ST, Forsmark CE, Wilcox CM, Slivka A, Yadav D. Patient and disease characteristics associated with the presence of diabetes mellitus in adults with chronic pancreatitis in the United States. Am J Gastroenterol 112: 1457–1465, 2017. doi: 10.1038/ajg.2017.181. [DOI] [PMC free article] [PubMed] [Google Scholar]
- 7.Kleeff J, Whitcomb DC, Shimosegawa T, Esposito I, Lerch MM, Gress T, Mayerle J, Drewes AM, Rebours V, Akisik F, Muñoz JED, Neoptolemos JP. Chronic pancreatitis. Nat Rev Dis Primers 3: 17060, 2017. doi: 10.1038/nrdp.2017.60. [DOI] [PubMed] [Google Scholar]
- 8.Rickels MR, Bellin M, Toledo FG, Robertson RP, Andersen DK, Chari ST, Brand R, Frulloni L, Anderson MA, Whitcomb DC; PancreasFest Recommendation Conference Participants. Detection, evaluation and treatment of diabetes mellitus in chronic pancreatitis: recommendations from PancreasFest 2012. Pancreatology 13: 336–342, 2013. doi: 10.1016/j.pan.2013.05.002. [DOI] [PMC free article] [PubMed] [Google Scholar]
- 9.Bellin MD. A role for total pancreatectomy and islet autotransplant in the treatment of chronic pancreatitis. Am J Gastroenterol 113: 324–326, 2018. doi: 10.1038/ajg.2017.425. [DOI] [PubMed] [Google Scholar]
- 10.Bellin MD, Freeman ML, Gelrud A, Slivka A, Clavel A, Humar A, et al. Total pancreatectomy and islet autotransplantation in chronic pancreatitis: recommendations from PancreasFest. Pancreatology 14: 27–35, 2014. doi: 10.1016/j.pan.2013.10.009. [DOI] [PMC free article] [PubMed] [Google Scholar]
- 11.Bellin MD, Gelrud A, Arreaza-Rubin G, Dunn TB, Humar A, Morgan KA, Naziruddin B, Rastellini C, Rickels MR, Schwarzenberg SJ, Andersen DK. Total pancreatectomy with islet autotransplantation: summary of a National Institute of Diabetes and Digestive and Kidney diseases workshop. Pancreas 43: 1163–1171, 2014. doi: 10.1097/MPA.0000000000000236. [DOI] [PMC free article] [PubMed] [Google Scholar]
- 12.Blobner BM, Bellin MD, Beilman GJ, Shelton CA, Park HJ, Whitcomb DC. Gene expression profiling of the pancreas in patients undergoing total pancreatectomy with islet autotransplant suggests unique features of alcoholic, idiopathic, and hereditary pancreatitis. Pancreas 49: 1037–1043, 2020. doi: 10.1097/MPA.0000000000001607. [DOI] [PubMed] [Google Scholar]
- 13.Sandberg R. Entering the era of single-cell transcriptomics in biology and medicine. Nat Methods 11: 22–24, 2014. doi: 10.1038/nmeth.2764. [DOI] [PubMed] [Google Scholar]
- 14.Stegle O, Teichmann SA, Marioni JC. Computational and analytical challenges in single-cell transcriptomics. Nat Rev Genet 16: 133–145, 2015. doi: 10.1038/nrg3833. [DOI] [PubMed] [Google Scholar]
- 15.Bellin MD, Abu-El-Haija M, Morgan K, Adams D, Beilman GJ, Chinnakotla S, Conwell DL, Dunn TB, Freeman ML, Gardner T, Kirchner VA, Lara LF, Long-Simpson L, Nathan JD, Naziruddin B, Nyman JA, Pruett TL, Schwarzenberg SJ, Singh VK, Smith K, Steel JL, Wijkstrom M, Witkowski P, Hodges JS; POST study consortium. A multicenter study of total pancreatectomy with islet autotransplantation (TPIAT): POST (Prospective Observational Study of TPIAT). Pancreatology 18: 286–290, 2018. doi: 10.1016/j.pan.2018.02.001. [DOI] [PMC free article] [PubMed] [Google Scholar]
- 16.Langmead B, Trapnell C, Pop M, Salzberg SL. Ultrafast and memory-efficient alignment of short DNA sequences to the human genome. Genome Biol 10: R25, 2009. doi: 10.1186/gb-2009-10-3-r25. [DOI] [PMC free article] [PubMed] [Google Scholar]
- 17.Stuart T, Butler A, Hoffman P, Hafemeister C, Papalexi E, Mauck WM 3rd, Hao Y, Stoeckius M, Smibert P, Satija R. Comprehensive integration of single-cell data. Cell 177: 1888–1902.e21, 2019. doi: 10.1016/j.cell.2019.05.031. [DOI] [PMC free article] [PubMed] [Google Scholar]
- 18.R Core Team. R: A language and environment for statistical computing. Vienna, Austria: R Foundation for Statistical Computing, 2019. https://www.r-project.org. [Google Scholar]
- 19.Franzen O, Gan LM, Björkegren JLM. PanglaoDB: a web server for exploration of mouse and human single-cell RNA sequencing data. Database (Oxford) 2019: baz046, 2019. doi: 10.1093/database/baz046. [DOI] [PMC free article] [PubMed] [Google Scholar]
- 20.Watanabe K, Taskesen E, van Bochoven A, Posthuma D. Functional mapping and annotation of genetic associations with FUMA. Nat Commun 8: 1826, 2017. doi: 10.1038/s41467-017-01261-5. [DOI] [PMC free article] [PubMed] [Google Scholar]
- 21.Watanabe K, Umićević Mirkov M, de Leeuw CA, van den Heuvel MP, Posthuma D. Genetic mapping of cell type specificity for complex traits. Nat Commun 10: 3222, 2019. [Erratum in Nat Commun 11: 1718, 2020] doi: 10.1038/s41467-019-11181-1. [DOI] [PMC free article] [PubMed] [Google Scholar]
- 22.Muraro MJ, Dharmadhikari G, Grün D, Groen N, Dielen T, Jansen E, van Gurp L, Engelse MA, Carlotti F, de Koning EJ, van Oudenaarden A. A single-cell transcriptome atlas of the human pancreas. Cell Syst 3: 385–394.e3, 2016. doi: 10.1016/j.cels.2016.09.002. [DOI] [PMC free article] [PubMed] [Google Scholar]
- 23.Suzuki Y, Rahman M, Mitsuya H. Diverse transcriptional response of CD4+ T cells to stromal cell-derived factor SDF-1: cell survival promotion and priming effects of SDF-1 on CD4+ T cells. J Immunol 167: 3064–3073, 2001. doi: 10.4049/jimmunol.167.6.3064. [DOI] [PubMed] [Google Scholar]
- 24.Thelen M. Dancing to the tune of chemokines. Nat Immunol 2: 129–134, 2001. doi: 10.1038/84224. [DOI] [PubMed] [Google Scholar]
- 25.Lanier LL, Chang C, Phillips JH. Human NKR-P1A. A disulfide-linked homodimer of the C-type lectin superfamily expressed by a subset of NK and T lymphocytes. J Immunol 153: 2417–2428, 1994. [PubMed] [Google Scholar]
- 26.UniProt Consortium. UniProt: a worldwide hub of protein knowledge. Nucleic Acids Res 47: D506–D515, 2019. doi: 10.1093/nar/gky1049. [DOI] [PMC free article] [PubMed] [Google Scholar]
- 27.Portal MM, Ferrero GO, Caputto BL. N-Terminal c-Fos tyrosine phosphorylation regulates c-Fos/ER association and c-Fos-dependent phospholipid synthesis activation. Oncogene 26: 3551–3558, 2007. doi: 10.1038/sj.onc.1210137. [DOI] [PubMed] [Google Scholar]
- 28.Tirone F. The gene PC3(TIS21/BTG2), prototype member of the PC3/BTG/TOB family: regulator in control of cell growth, differentiation, and DNA repair? J Cell Physiol 187: 155–165, 2001. doi: 10.1002/jcp.1062. [DOI] [PubMed] [Google Scholar]
- 29.Tano K, Mizuno R, Okada T, Rakwal R, Shibato J, Masuo Y, Ijiri K, Akimitsu N. MALAT-1 enhances cell motility of lung adenocarcinoma cells by influencing the expression of motility-related genes. FEBS Lett 584: 4575–4580, 2010. doi: 10.1016/j.febslet.2010.10.008. [DOI] [PubMed] [Google Scholar]
- 30.Radons J. The human HSP70 family of chaperones: where do we stand? Cell Stress Chaperones 21: 379–404, 2016. doi: 10.1007/s12192-016-0676-6. [DOI] [PMC free article] [PubMed] [Google Scholar]
- 31.An YP, Xiao R, Cui H, Cui ZJ. Selective activation by photodynamic action of cholecystokinin receptor in the freshly isolated rat pancreatic acini. Br J Pharmacol 139: 872–880, 2003. doi: 10.1038/sj.bjp.0705295. [DOI] [PMC free article] [PubMed] [Google Scholar]
- 32.Chandler DE, Williams JA. Intracellular divalent cation release in pancreatic acinar cells during stimulus-secretion coupling. II. Subcellular localization of the fluorescent probe chlorotetracycline. J Cell Biol 76: 386–399, 1978. doi: 10.1083/jcb.76.2.386. [DOI] [PMC free article] [PubMed] [Google Scholar]
- 33.Love JA, Szebeni K, Smith TG. Veratridine-stimulated amylase secretion from rabbit pancreatic lobules: role of cholinergic and noncholinergic receptors. Pancreas 19: 231–238, 1999. doi: 10.1097/00006676-199910000-00003. [DOI] [PubMed] [Google Scholar]
- 34.Singh M. Effect of chronic ethanol feeding on pancreatic enzyme secretion in rats in vitro. Dig Dis Sci 28: 117–123, 1983. doi: 10.1007/BF01315140. [DOI] [PubMed] [Google Scholar]
- 35.Waschulewski IH, Hall DV, Kern HF, Edwardson JM. Effects of the immunosuppressants cyclosporin A and FK 506 on exocytosis in the rat exocrine pancreas in vitro. Br J Pharmacol 108: 892–900, 1993. doi: 10.1111/j.1476-5381.1993.tb13483.x. [DOI] [PMC free article] [PubMed] [Google Scholar]
- 36.Enge M, Arda HE, Mignardi M, Beausang J, Bottino R, Kim SK, Quake SR. Single-cell analysis of human pancreas reveals transcriptional signatures of aging and somatic mutation patterns. Cell 171: 321–330.e14, 2017. doi: 10.1016/j.cell.2017.09.004. [DOI] [PMC free article] [PubMed] [Google Scholar]
- 37.Qadir MMF, Álvarez-Cubela S, Klein D, van Dijk J, Muñiz-Anquela R, Moreno-Hernandez YB, Lanzoni G, Sadiq S, Navarro-Rubio B, García MT, Díaz Á, Johnson K, Sant D, Ricordi C, Griswold A, Pastori RL, Domínguez-Bendala J. Single-cell resolution analysis of the human pancreatic ductal progenitor cell niche. Proc Natl Acad Sci USA 117: 10876–10887, 2020. [Erratum in Proc Natl Acad Sci USA 118: e2025819118, 2021] doi: 10.1073/pnas.1918314117. [DOI] [PMC free article] [PubMed] [Google Scholar]
- 38.Segerstolpe A, Palasantza A, Eliasson P, Andersson EM, Andréasson AC, Sun X, Picelli S, Sabirsh A, Clausen M, Bjursell MK, Smith DM, Kasper M, Ämmälä C, Sandberg R. Single-cell transcriptome profiling of human pancreatic islets in health and type 2 diabetes. Cell Metab 24: 593–607, 2016. doi: 10.1016/j.cmet.2016.08.020. [DOI] [PMC free article] [PubMed] [Google Scholar]