

Abstract
Objective
Irisin, a novel myokine, has recently been considered to produce a cardioprotective effect. Potential biomarkers for myocardial injuries in patients with severe hypothyroidism have yet to be identified. We aimed to investigate whether serum irisin may serve as a promising biomarker for early detecting the myocardial injuries in patients with severe hypothyroidism.
Methods
This cross-sectional study comprised 25 newly diagnosed drug-naive patients with severe primary hypothyroidism and 17 age- and sex-matched healthy controls. Circulating irisin levels and cardiac magnetic resonance (CMR) were evaluated in each participant. Left ventricular (LV) myocardial injuries were detected by CMR-based T1 mapping technique using a modified look-locker inversion recovery (MOLLI) sequence, which is quantified as native T1 values.
Results
Compared with healthy controls, the severe hypothyroidism group had significantly lower levels of serum irisin, especially those with pericardial effusion (P < 0.05). The severe hypothyroidism subjects exhibited lower peak filling rates (PFRs) and higher native myocardial T1 values than controls (P < 0.05). Additionally, the ROC analysis displayed that the sensitivity and specificity of serum irisin for diagnosing pericardial effusion in patients with severe hypothyroidism were 73.3% and 100.0%, respectively. The AUC was 0.920 (0.861–1.000) (P < 0.001). The cutoff value was 36.94 ng/mL. Moreover, the results in subgroup analysis revealed that the native T1 values of the low-irisin group were significantly higher than that of the high-irisin group (P < 0.05). According to multivariate linear regression analysis, serum irisin concentrations were negatively and independently correlated with native myocardial T1 values after adjustment for age, sex, and other conventional confounding factors (β = −1.473, P < 0.05).
Conclusions
Irisin may be a potential biomarker for predicting myocardial injuries in patients with severe hypothyroidism.
1. Introduction
Irisin, a novel myokine, is cleaved from the transmembrane protein fibronectin type III domain-containing protein 5 (FNDC5), the secretion of which is increased in response to exercise [1]. It has gained greater notoriety and visibility for its roles in regulating body metabolism and energy homeostasis by promoting the browning of white adipose tissue [2–6]. Additionally, this myokine has a high expression in the muscle, as well as heart and adipose tissues [4, 7], and circulating irisin mainly comes from heart and skeletal muscles [1, 8–10]. Many preclinical and clinical studies have been conducted to measure irisin and relate it to physiological or diseases conditions, such as metabolic and cardiovascular diseases [4, 10–12].
Thyroid hormones have long been known as a crucial regulator of basal metabolic rate and energy thermogenesis [13]. Impaired thyroid function has a negative impact on muscles, oxidative stress, metabolic regulation, and cardiac function [14–16]. As a result of the deficiency of thyroid hormones, the deposition of myocardial interstitial collagen and mucopolysaccharides (glycosaminoglycans) was believed to play a key role in the pathophysiological progress of myocardial fibrosis and edema in hypothyroidism [17, 18]. Our previous studies showed that diffuse myocardial injuries, measured by cardiac magnetic resonance (CMR)-based T1 mapping technique, were present in patients with overt hypothyroidism [19, 20]. Additionally, our group has also shown that serum irisin levels were declined in hypothyroidism subjects, and its levels might be restored after levothyroxine treatment [21].
Thus, thyroid dysfunction could directly or indirectly be associated with irisin modulation, or vice versa. Specially, there may be some potential links between circulating irisin concentration and myocardial damage in hypothyroidism. So far, very few studies have focused on their relationship among patients with severe hypothyroidism. We aimed to determine whether the serum irisin can serve as a potential biomarker associated with myocardial injuries in patients with severe hypothyroidism.
2. Materials and Methods
2.1. Study Population
A total of 25 newly diagnosed and untreated patients with severe primary hypothyroidism attending our outpatient clinic were enrolled in this cross-sectional study between December 2014 and September 2015. Meanwhile, 17 age- and sex-matched participants with no documented medical history were formed the healthy control group. The inclusion criteria were age between 18 and 65 years and serum thyroid-stimulating hormone (TSH) level > 50 µIU/mL [22]. The exclusion criteria were the presence of known heart disease (coronary disease, myocarditis, valvular heart disease, heart failure, and so on), hypertension, diabetes, pregnancy, chronic obstructive pulmonary disease, liver or kidney failure, asthma, neoplastic disease, claustrophobia, or metal implants. This study protocol was conducted according to the Declaration of Helsinki ethical principles and approved by the Ethics Committee of our hospital. Each participant provided written informed consent.
2.2. Clinical and Biochemical Measurements
All subjects underwent anthropometric indicators, medical history, and biochemical tests. Data regarding height and body weight were recorded. After an overnight fast, blood samples were collected during 8:00–9:00 a.m. and instantly centrifuged at 3500 r/min for 10 min at 4°C, and then serum was separated and stored frozen at −80°C for biochemical and irisin assays. Total cholesterol (TC), high-density lipoprotein cholesterol (HDL-C), low-density lipoprotein cholesterol (LDL-C), triglyceride (TG), and creatine kinase (CK) were analyzed using a Dade Behring Dimension RXL autoanalyzer (Dade Behring Diagnostics, Marburg, Germany). Serum-free thyroxine and thyrotropin concentrations were measured by electrochemiluminescence immunoassay using Abbott Architect i2000 (Abbott Diagnostics, Abbott Park, IL, USA). Serum irisin levels were determined with enzyme-linked immunosorbent assay (ELISA) kits (Phoenix Pharmaceuticals, Inc., Burlingame, CA, USA). Body mass index (BMI) was derived as BMI (kg/m2) = body weight (kg)/height (m)2. Body surface area (BSA) was calculated as BSA (m)2 = 0.007184 × height (cm)0.725 × weight (kg)0.425.
2.3. Cardiac Magnetic Resonance Imaging
CMR studies were performed using a clinical 3T Tim Trio System scanner (Siemens Healthcare, Erlangen, Germany) in each participant. Modified look-locker inversion recovery (MOLLI) T1 maps [23] were obtained for assessing diffuse myocardial injuries. The detailed CMR protocol and image analysis are available in our previous studies [19, 20].
Based on each MRI, BSA-normalized left ventricular (LV) functional parameters were assessed according to the Society for CMR guidelines [24], including LV end-diastolic volume (EDV), LV end-systolic volume (ESV), LV mass (LVM), peak ejection time (PET), peak ejection rate (PER), peak filling time (PFT), peak filling rate (PFR), and heart rate (HR). The cardiac index (CI), stroke volume (SV), LVM index (LVMI), and ejection fraction (EF) were calculated by validated CMR-derived measures. Manual endo- and epicardium contours were drawn to measure a mean native T1 value of the mid-short axial slices. Meanwhile, the accompanying signs (pericardial effusion) were performed in each patient.
2.4. Statistical Analysis
Statistical analysis was done with SPSS software version 25.0 (IBM, Chicago, IL, USA) and GraphPad Prism 8.0 (Inc, CA, USA). Categorical variables were performed as frequencies or percentage. Continuous data were tested for normality using the Kolmogorov–Smirnov test. Normally distributed data were presented as means ± standard error of the mean (SEM), while variables with a skewed-distribution were expressed as median (interquartile range, IQR). The proportions were analyzed using chi-squared tests. The differences between two groups (control and severe hypothyroidism, two subgroups in the severe hypothyroidism group) were analyzed through an independent t-test for normally distributed variables or a Mann–Whitney U test for skewed-distribution variables. Multiple comparisons were performed by the one-way ANOVA or Kruskal–Wallis test followed by a post hoc test. Receiver operating characteristic (ROC) curve analysis was performed to assess the predictive power of irisin for determining pericardial effusion in patients with severe hypothyroidism and to identify an optimal cutoff value based on the balance between sensitivity and specificity. Correlations between irisin levels and native T1 values were analyzed by Pearson correlation coefficients. Parameters that show a significant correlation with irisin were subsequently calculated using a multivariate linear regression model after adjusting for potential confounding factors. A two-tailed P-value of <0.05 was considered statistically significant.
3. Results
3.1. Clinical Characteristics of the Control and Severe Hypothyroidism Groups
A total of 42 drug-naïve participants were enrolled in our study, including 25 subjects with severe hypothyroidism and 17 healthy controls. Table 1 displays the clinical characteristics of all subjects. No difference was observed in HR and HDL-C levels between the two groups (Table 1). People with severe hypothyroidism had significantly higher BMI, TC, TG, LDL-C, CK, and TSH concentrations, while free T3 (FT3) and free T4 (FT4) levels were significantly reduced compared with controls (all P < 0.01). Of note, irisin concentrations were significantly lower in the severe hypothyroidism group than in controls (P=0.014).
Table 1.
Baseline characteristics of control and severe hypothyroidism groups.
| Control group (n = 17) | Severe hypothyroidism group (n = 25) | P value | |
|---|---|---|---|
| Age, year | 33.41 ± 1.96 | 37.40 ± 1.92 | 0.167 |
| Gender, M/F, n | 2/15 | 3/22 | 1.000 |
| BMI, kg/m2 | 22.25 ± 0.86 | 25.74 ± 0.70 | 0.003 ∗ |
| HR, beats/min | 70.53 ± 2.34 | 66.71 ± 1.90 | 0.210 |
| TG, mmol/L | 0.73 (0.50, 0.91) | 1.44 (1.05, 2.83) | ≤ 0.001 ∗ |
| TC, mmol/L | 4.37 ± 0.21 | 6.25 ± 0.31 | ≤ 0.001 ∗ |
| HDL-C, mmol/L | 1.64 ± 0.09 | 1.68 ± 0.10 | 0.813 |
| LDL-C, mmol/L | 2.47 ± 0.22 | 3.46 ± 0.11 | 0.004 ∗ |
| CK, U/L | 84.00 (59.00, 105.00) | 242.00 (144.50, 554.00) | ≤ 0.001 ∗ |
| FT3, pg/mL | 2.80 ± 0.11 | 1.59 ± 0.10 | ≤ 0.001 ∗ |
| FT4, ng/dL | 1.12 (1.03, 1.16) | 0.40 (0.40, 0.44) | ≤ 0.001 ∗ |
| TSH, mIU/mL | 1.90 (1.44, 2.81) | 100.00 (96.62, 100.00) | ≤ 0.001 ∗ |
| Irisin, ng/mL | 59.96 ± 7.14 | 36.38 ± 5.61 | 0.014 ∗ |
Data are expressed as mean ± SME or median (interquartile range) unless stated otherwise. ∗P < 0.05.
3.2. Cardiac Magnetic Resonance Findings
CMR measurements of the study population are shown in Table 2. It was observed that 10 of the participants with severe hypothyroidism exhibited pericardial effusions. No significant differences were found in the majority of the CMR parameters between the two groups, including BSA, EF, SV, CI, PET, PFT, and PER, or any parameters of volumetric indexes such as EDV, ESV, and LVMI. However, the reduced PFR (P < 0.05) suggested early impairment of diastolic function in the severe hypothyroidism group. Furthermore, compared with the control group, native MOLLI (Table 2) showed a significant increase in myocardial T1 values among patients with severe hypothyroidism (P < 0.01). These results indicated the presence of early diffuse myocardial lesions in patients with severe hypothyroidism.
Table 2.
Cardiovascular magnetic resonance parameters of control and severe hypothyroidism groups.
| Control group (n = 17) | Severe hypothyroidism group (n = 25) | P value | |
|---|---|---|---|
| BSA, m2 | 1.65 ± 0.04 | 1.73 ± 0.03 | 0.079 |
| EF, % | 60.46 ± 1.12 | 60.12 ± 1.71 | 0.882 |
| EDV, mL/m2 | 55.44 ± 2.70 | 53.65 ± 1.51 | 0.538 |
| ESV, mL/m2 | 21.85 ± 1.62 | 21.50 ± 1.28 | 0.865 |
| SV, mL/m2 | 33.68 ± 1.39 | 32.15 ± 0.95 | 0.354 |
| CI, L/min/m2 | 2.35 ± 0.09 | 2.16 ± 0.08 | 0.133 |
| LVMI, g/m2 | 47.80 (39.25, 54.30) | 51.65 (46.95, 60.30) | 0.146 |
| PET, ms | 135.00 (119.60, 149.00) | 156.35 (126.98, 176.35) | 0.254 |
| PFT, ms | 145.15 (110.23 158.13) | 158.60 (119.55, 180.20) | 0.190 |
| PER, EDV/s | 3.50 (3.20, 3.70) | 3.30 (3.00, 3.80) | 0.258 |
| PFR, EDV/s | 4.10 (3.45, 4.55) | 3.40 (2.90, 3.90) | 0.035 ∗ |
| Native T1 value, ms | 1063.09 ± 8.72 | 1192.95 ± 17.83 | ≤0.001 ∗ |
| Pericardial effusion, n | 0 | 10 | — |
Data are expressed as mean ± SME or median (interquartile range) unless stated otherwise. ∗P < 0.05.
3.3. The Predict Value of Irisin for Pericardial Effusion in Subjects with Severe Hypothyroidism
As mentioned above, subjects with severe hypothyroidism had significantly lower irisin concentrations than controls (Table 1). Moreover, circulating irisin levels were even lower in the severe hypothyroidism subgroup with pericardial effusion (13.16 ± 3.93 ng/mL) compared with those without pericardial effusion (51.85 ± 6.38 ng/mL) (P < 0.01). Nevertheless, there was no statistically significant difference in the levels of irisin between the severe hypothyroidism subgroup without pericardial effusion and the control group (Figure 1 and Supplementary Table 1). As expected, LV native T1 values were higher in the subgroup of severe hypothyroidism with pericardial effusion, indicating they had more severe diffuse myocardial injuries (P < 0.001, Supplementary Table 1). In order to identify the diagnostic value of serum irisin levels for pericardial effusion in severe hypothyroidism patients, we performed ROC analysis, as shown in Figure 2. The sensitivity and specificity of serum irisin in diagnosing pericardial effusion were 73.3% and 100.0%, respectively. The AUC was 0.920 (0.861–1.000) (P < 0.001). And the cutoff value of serum irisin for diagnosing pericardial effusion in patients with severe hypothyroidism was 36.94 ng/mL.
Figure 1.
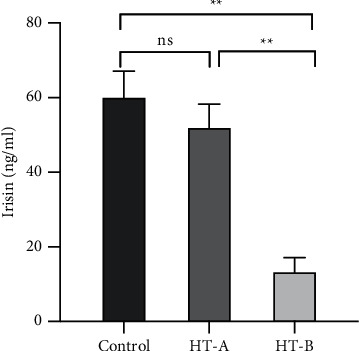
Mean serum irisin level in controls and severe hypothyroidism patients with (HT-B) or without (HT-A) pericardial effusion. ∗∗P < 0.01.
Figure 2.
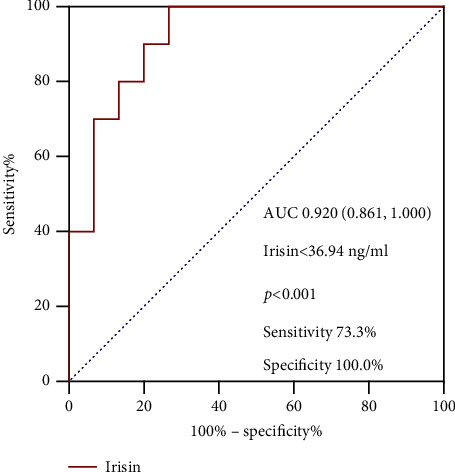
ROC curve analysis of irisin to predict pericardial effusion in severe hypothyroidism patients.
3.4. Relationship between Irisin Levels and Cardiac Magnetic Resonance Parameters
Next, we analyzed the relationships between CMR parameters and serum levels of irisin in subjects with severe hypothyroidism. According to the cutoff value of serum irisin, all severe hypothyroidism participants were divided into two groups: the high-irisin group and the low-irisin group (Table 3). Significantly, compared with the other group, the LV native T1 values were increased in the low-irisin subgroup (P < 0.05). However, no significant difference between the subgroups was observed in BSA, EDV, ESV, LVMI, EF, SV, CI, PET, PFT, PER, and PFR (Table 3).
Table 3.
Cardiovascular magnetic resonance parameters of two subgroups in patients with severe hypothyroidism according to the cutoff value of serum irisin levels.
| Irisin <36.94 ng/mL (n = 14) | Irisin ≥36.94 ng/mL (n = 11) | P value | |
|---|---|---|---|
| Irisin, ng/mL | 15.67 ± 3.24 | 62.73 ± 5.53 | ≤ 0.001 ∗ |
| BSA, m2 | 1.70 ± 0.03 | 1.76 ± 0.05 | 0.265 |
| EF, % | 59.34 ± 2.82 | 61.11 ± 1.62 | 0.618 |
| EDV, mL/m2 | 55.46 ± 2.22 | 51.11 ± 1.66 | 0.159 |
| ESV, mL/m2 | 22.89 ± 1.97 | 19.56 ± 1.19 | 0.204 |
| SV, mL/m2 | 32.57 ± 1.49 | 31.57 ± 0.98 | 0.614 |
| CI, l/min/m2 | 2.08 ± 0.10 | 2.27 ± 0.12 | 0.241 |
| LVMI, g/m2 | 49.60 (46.48, 61.05) | 54.55 (48.93, 60.75) | 0.380 |
| PET, ms | 153.19 ± 7.31 | 149.90 ± 10.87 | 0.799 |
| PFT, ms | 159.09 ± 13.07 | 157.21 ± 15.43 | 0.926 |
| Per, EDV/s | 3.25 (2.95, 4.15) | 3.30 (3.30, 3.60) | 0.848 |
| PFR, EDV/s | 3.35 (2.75, 3.85) | 3.50 (3.00, 4.10) | 0.478 |
| Native T1 value, ms | 1232.91 ± 21.06 | 1142.09 ± 23.22 | 0.008 ∗ |
Data are expressed as mean ± SME or median (interquartile range) unless stated otherwise. ∗P < 0.05.
Bivariate correlation analyses were conducted to further determine the relationship between serum levels of irisin and CMR parameters among patients with severe hypothyroidism. We found that the circulating irisin concentrations were negatively correlated with LV T1 value levels (r = −0.494, P < 0.05, Figure 3). No correlation was observed between serum irisin and other CMR parameters. Collectively, our findings revealed that irisin levels were related to diffuse myocardial injuries.
Figure 3.

Correlation between serum irisin levels and PER (a), PFR (b), and native T1 values (c) in patients with severe hypothyroidism.
3.5. Association between Irisin Levels and Myocardial Native T1 Values
To determine the role of irisin as an independent determinant of diffuse myocardial injuries in patients with severe hypothyroidism, we conducted multivariate linear regression to further examine the parameters that were considered clinically relevant or significant in univariate analyses (Table 4). Irisin levels were significantly associated with native T1 values (β = −1.568, P < 0.05) without adjustment of potential confounders. In model 1, with adjustment for age and sex, the relation between them was consistent (β = −1.617, P < 0.05). Interestingly, in model 2, with further adjustment with BMI, TG, TC, and FT4, we found that serum irisin levels remained inversely and independently associated with native T1 values in severe hypothyroidism patients (β = −1.473, P < 0.05). Taken together, irisin was an independent predictor for diffuse myocardial injuries in patients with severe hypothyroidism.
Table 4.
Multivariate linear regression for the association of serum irisin levels with native T1 values in severe hypothyroidism patients.
| Univariate linear regression | Multivariate linear regression♆ | Multivariate linear regression☧ | P value | ||||||
|---|---|---|---|---|---|---|---|---|---|
| Variables | β | 95% CI | P value | β | 95% CI | P value | β | 95% CI | |
| Age | −0.886 | −4.880 to 3.108 | 0.651 | 0.319 | −3.494 to 4.131 | 0.864 | −1.535 | −6.206 to 3.136 | 0.497 |
| Sex | 13.653 | −102.173 to 129.479 | 0.810 | −9.551 | −117.602 to 98.500 | 0.856 | −51.103 | −154.554 to 52.338 | 0.312 |
| BMI | −7.858 | −18.322 to 2.606 | 0.134 | −6.199 | −16.878 to 4.480 | 0.183 | |||
| TC | 2.602 | −22.586 to 27.789 | 0.833 | 5.381 | −22.632 to 33.394 | 0.690 | |||
| TG | −6.561 | −31.802 to 16.681 | 0.596 | 9.278 | −15.815 to 34.371 | 0.328 | |||
| FT3 | −43.653 | −115.857 to 28.554 | 0.224 | ||||||
| FT4 | −655.383 | −1139.062 to −171.704 | 0.010 ∗ | −595.752 | −1094.549 to −94.956 | 0.022 ∗ | |||
| Irisin | −1.568 | −2.760 to −0.377 | 0.012 ∗ | −1.617 | −2.929 to −0.305 | 0.018 ∗ | −1.473 | −2.898 to −0.047 | 0.044 ∗ |
♆Model 1 adjusted for age and sex; ☧Model 2 further adjustment for sex, age, BMI, TG, TC, and FT4. ∗P < 0.05.
4. Discussion
The current study, for the first time, determined whether circulating irisin may serve as a promising predictive biomarker for early detecting myocardial injuries of severe hypothyroidism. Here, we found reductions in serum irisin concentrations and PFRs, as well as elevations in native T1 values in subjects with severe hypothyroidism. Serum irisin levels could distinguish severe hypothyroidism patients with from without pericardial effusion. Moreover, further analysis showed the LV native T1 values were significantly elevated in the low-irisin subgroup, and serum irisin levels were independently related to diffuse myocardial injuries (fibrosis and edema) in subjects with severe hypothyroidism.
Irisin, an exercise-induced myokine, is cleaved from the transmembrane protein FNDC5 before being released into the circulation and regulated by peroxisome-proliferator-activated receptor gamma (PPARγ) coactivator 1-alpha (PG1-α) [1, 25]. As important components for regulating metabolism and thermogenesis, both irisin and thyroid hormones have profound functions [26]. To date, several studies have explored the connection between irisin and thyroid hormones, but the evidence is still contradictory. In people with clinical hypothyroidism, irisin concentrations have been depicted as either increased [27] or decreased [21, 28, 29]. We discovered that irisin levels were significantly reduced in the severe hypothyroidism group than in controls. Consistent with results shown in the current trial, a recent meta-analysis revealed that the levels of irisin are lower in hypothyroidism patients [30]. In contrast, a case-control research showed that circulating irisin concentrations were elevated in hypothyroidism [27]. There are several explanations for this contradiction. First, their study included participants with mild hypothyroidism (average TSH level, 13.1 mIU/mL). Second, irisin values measured with ELISA kits may vary widely among different assays [31, 32]. Animal studies also have confirmed the upregulation of serum irisin levels in hyperthyroid and hypothyroid rat models, which may be correlated with muscle damage observed in both conditions [26]. In this regard, previous data revealed that only prolonged hypothyroidism was interrelated with a significant decrease in irisin levels, which may be due to initial muscle destruction and leakage from damaged muscle cells and following a reduction in irisin production because of long-lasting myopathy [29].
In addition to regulating metabolism and thermogenesis, irisin is also considered to produce a cardioprotective effect in recent years [8, 33, 34]. Dun et al. first reported the high expression of irisin in cardiomyocytes [35]. Irisin can blunt collagen synthesis and myocardial fibrosis in angiotensin II-induced mice, and its mechanism may be to activate the Nrf2 pathway and inhibit the ROS/TGF-β/Smad signaling axis in cardiac fibroblasts [36]. Additionally, Liao et al. suggested that irisin treatment promoted angiogenesis via an ERK-dependent pathway and thus decreased cardiac fibrosis and ventricular dilation [37]. Furthermore, FNDC5 overexpression significantly improved obesity-induced myocardial inflammation, fibrosis, oxidative stress, and cardiac remodeling [38]. Not only animal experiments, but some clinical studies also revealed that serum levels of irisin were decreased in subjects with heart failure, especially in those with reduced ejection fraction [12, 39]. These findings show that irisin could be regarded as a promising biomarker and potential therapeutic target for cardiac injuries and remodeling.
In our present research, compared with health controls, patients with severe hypothyroidism had significantly reduced PFRs and elevated native T1 values, indicating early impaired diastolic function and diffuse myocardial lesions in the severe hypothyroidism subjects. Apart from other causes of interstitial involvement, including myocardial infarction, myocarditis, or amyloid, elevated T1 values are thought to associate closely with myocardial fibrosis, inflammation, and edema induced by hypothyroidism [40, 41]. Meanwhile, our previous studies demonstrated that myocardial involvement was common in subjects with overt hypothyroidism and elevated T1 values were relevant to cardiac function impairment, which could be significantly improved after short-term levothyroxine therapy [19, 20]. Interestingly, our ROC curve analysis showed the serum irisin exhibited significant discriminatory power for pericardial effusion in severe hypothyroidism patients, with high sensitivity and specificity. Moreover, the low-irisin group displayed distinctly higher native myocardial T1 values than the high-irisin group. However, no significant difference between the two subgroups (in the severe hypothyroidism participants) was observed in cardiac systolic and diastolic function parameters. These results might indicate that reductions in serum irisin concentrations were related to early myocardial injuries. It is noteworthy that serum irisin concentrations were independently correlated with myocardial injuries in severe hypothyroidism subjects after adjusting for age, gender, BMI, TG, TC, and FT4. Therefore, irisin may improve early diagnosis and effective treatment for myocardial injuries.
To date, it remains unknown whether the change in irisin levels is the “trigger” for myocardial damage or merely a “consequence” of myocardial damage. One possible explanation is that the lack of thyroid hormones produces overdeposition of myocardial interstitial collagens and mucopolysaccharides, leading to the development of diffuse myocardial fibrosis and edema, then following a reduction in irisin production due to long-lasting myopathy [17, 18, 42, 43].
This study has several limitations. First, our research was a cross-sectional design with a relatively small sample size, which cannot demonstrate causality. Second, exercise is considered a primary inducement of irisin secretion [44]; the influence of exercise cannot be eliminated. Nevertheless, it can certainly put forward reliable hypotheses to be confirmed and extended in future clinical and preclinical research.
In summary, low serum irisin levels may indicate diffuse myocardial injuries for patients with severe hypothyroidism. Large sample and multicenter studies are needed to further corroborate this predictive effect of irisin and provide a potential target for the prevention and treatment of myocardial involvement in hypothyroidism.
Acknowledgments
This work was supported by grants from the Beijing Hospitals Authority Clinical Medicine Development of Special Funding Support (ZYLX202106) to Guang Wang and the Beijing Talents foundation (2018–12) and Capital Funds for Health Improvement and Research (No. 2018-4-2034) to Jia Liu.
Contributor Information
Jia Liu, Email: liujia0116@126.com.
Guang Wang, Email: drwg6688@126.com.
Data Availability
The data generated during the current study are available from the corresponding author upon reasonable request.
Disclosure
Zhi Yao and Xiaoyu Ding are the co-first authors.
Conflicts of Interest
All the authors have no conflicts of interest to declare.
Authors' Contributions
All the authors contributed to the study conception and design. Material preparation, data collection, and analysis were performed by Zhi Yao, Xiaoyu Ding, Xia Gao, Ning Yang, and Yumei Jia. The first draft of the manuscript was written by Zhi Yao and Xiaoyu Ding. The paper was revised by Jia Liu and Guang Wang. All the authors read and approved the final manuscript.
Supplementary Materials
Supplementary Table 1. Comparison of serum irisin levels and cardiovascular magnetic resonance parameters in controls and severe hypothyroidism patients with and without pericardial effusion (PE).
References
- 1.Boström P., Wu J., Jedrychowski M. P., et al. A PGC1-α-dependent myokine that drives brown-fat-like development of white fat and thermogenesis. Nature . 2012;481(7382):463–468. doi: 10.1038/nature10777. [DOI] [PMC free article] [PubMed] [Google Scholar]
- 2.Moreno-Navarrete J. M., Ortega F., Serrano M., et al. Irisin is expressed and produced by human muscle and adipose tissue in association with obesity and insulin resistance. The Journal of Clinical Endocrinology & Metabolism . 2013;98(4):E769–E778. doi: 10.1210/jc.2012-2749. [DOI] [PubMed] [Google Scholar]
- 3.So W. Y., Leung P. S. Irisin ameliorates hepatic glucose/lipid metabolism and enhances cell survival in insulin-resistant human HepG2 cells through adenosine monophosphate-activated protein kinase signaling. The International Journal of Biochemistry & Cell Biology . 2016;78:237–247. doi: 10.1016/j.biocel.2016.07.022. [DOI] [PubMed] [Google Scholar]
- 4.Perakakis N., Triantafyllou G. A., Fernández-Real J. M., et al. Physiology and role of irisin in glucose homeostasis. Nature Reviews Endocrinology . 2017;13(6):324–337. doi: 10.1038/nrendo.2016.221. [DOI] [PMC free article] [PubMed] [Google Scholar]
- 5.Rodríguez A., Becerril S., Ezquerro S., Méndez-Giménez L., Frühbeck G. Crosstalk between adipokines and myokines in fat browning. Acta Physiologica (Oxford, England) . 2017;219:362–381. doi: 10.1111/apha.12686. [DOI] [PubMed] [Google Scholar]
- 6.Li H., Zhang Y., Wang F., et al. Effects of irisin on the differentiation and browning of human visceral white adipocytes. American Journal of Translational Research . 2019;11(12):7410–7421. [PMC free article] [PubMed] [Google Scholar]
- 7.Colaianni G., Cinti S., Colucci S., Grano M. Irisin and musculoskeletal health. Annals of the New York Academy of Sciences . 2017;1402(1):5–9. doi: 10.1111/nyas.13345. [DOI] [PubMed] [Google Scholar]
- 8.Wang H., Zhao Y. T., Zhang S., et al. Irisin plays a pivotal role to protect the heart against ischemia and reperfusion injury. Journal of Cellular Physiology . 2017;232(12):3775–3785. doi: 10.1002/jcp.25857. [DOI] [PMC free article] [PubMed] [Google Scholar]
- 9.Aydin S., Kuloglu T., Aydin S., et al. Cardiac, skeletal muscle and serum irisin responses to with or without water exercise in young and old male rats: cardiac muscle produces more irisin than skeletal muscle. Peptides . 2014;52:68–73. doi: 10.1016/j.peptides.2013.11.024. [DOI] [PubMed] [Google Scholar]
- 10.Zhang X., Hu C., Kong C.-Y., et al. FNDC5 alleviates oxidative stress and cardiomyocyte apoptosis in doxorubicin-induced cardiotoxicity via activating AKT. Cell Death & Differentiation . 2020;27(2):540–555. doi: 10.1038/s41418-019-0372-z. [DOI] [PMC free article] [PubMed] [Google Scholar]
- 11.Zhang X., Hu C., Wu H. M., Ma Z. G., Tang Q. Z. Fibronectin type III domain-containing 5 in cardiovascular and metabolic diseases: a promising biomarker and therapeutic target. Acta Pharmacologica Sinica . 2020;42 doi: 10.1038/s41401-020-00557-5. [DOI] [PMC free article] [PubMed] [Google Scholar]
- 12.Silvestrini A., Bruno C., Vergani E., et al. Circulating irisin levels in heart failure with preserved or reduced ejection fraction: a pilot study. PLoS one . 2019;14(1):p. e0210320. doi: 10.1371/journal.pone.0210320. [DOI] [PMC free article] [PubMed] [Google Scholar]
- 13.Silva J. E. Thyroid hormone control of thermogenesis and energy balance. Thyroid . 1995;5(6):481–492. doi: 10.1089/thy.1995.5.481. [DOI] [PubMed] [Google Scholar]
- 14.Rooyackers O. E., Nair K. S. Hormonal regulation of human muscle protein metabolism. Annual Review of Nutrition . 1997;17(1):457–485. doi: 10.1146/annurev.nutr.17.1.457. [DOI] [PubMed] [Google Scholar]
- 15.Simonides W. S., van Hardeveld C. Thyroid hormone as a determinant of metabolic and contractile phenotype of skeletal muscle. Thyroid . 2008;18(2):205–216. doi: 10.1089/thy.2007.0256. [DOI] [PubMed] [Google Scholar]
- 16.Tang Y.-D., Kuzman J. A., Said S., Anderson B. E., Wang X., Gerdes A. M. Low thyroid function leads to cardiac atrophy with chamber dilatation, impaired myocardial blood flow, loss of arterioles, and severe systolic dysfunction. Circulation . 2005;112(20):3122–3130. doi: 10.1161/circulationaha.105.572883. [DOI] [PubMed] [Google Scholar]
- 17.Wiig H., Reed R. K., Tenstad O. Interstitial fluid pressure, composition of interstitium, and interstitial exclusion of albumin in hypothyroid rats. American Journal of Physiology-Heart and Circulatory Physiology . 2000;278(5):H1627–H1639. doi: 10.1152/ajpheart.2000.278.5.h1627. [DOI] [PubMed] [Google Scholar]
- 18.Hajje G., Saliba Y., Itani T., Moubarak M., Aftimos G., Farès N. Hypothyroidism and its rapid correction alter cardiac remodeling. PLoS one . 2014;9(10):p. e109753. doi: 10.1371/journal.pone.0109753. [DOI] [PMC free article] [PubMed] [Google Scholar]
- 19.Gao X., Liu M., Qu A., et al. Native magnetic resonance T1-mapping identifies diffuse myocardial injury in hypothyroidism. PLoS one . 2016;11(3):p. e0151266. doi: 10.1371/journal.pone.0151266. [DOI] [PMC free article] [PubMed] [Google Scholar]
- 20.Gao X., Chen Z., Liu M., et al. Effects of short-term levothyroxine therapy on myocardial injuries in patients with severe overt hypothyroidism: evidence from a cardiac MRI Study. Journal of Magnetic Resonance Imaging . 2017;46(3):897–904. doi: 10.1002/jmri.25628. [DOI] [PubMed] [Google Scholar]
- 21.Yang N., Zhang H., Gao X., et al. Role of irisin in Chinese patients with hypothyroidism: an interventional study. Journal of International Medical Research . 2019;47(4):1592–1601. doi: 10.1177/0300060518824445. [DOI] [PMC free article] [PubMed] [Google Scholar]
- 22.Gondil V. S., Chandrasekaran A., Rastogi A., et al. Proteinuria in severe hypothyroidism: a prospective study. The Journal of Clinical Endocrinology & Metabolism . 2021;106(2):e749–e756. doi: 10.1210/clinem/dgaa871. [DOI] [PubMed] [Google Scholar]
- 23.Messroghli D. R., Radjenovic A., Kozerke S., Higgins D. M., Sivananthan M. U., Ridgway J. P. Modified Look-Locker inversion recovery (MOLLI) for high-resolutionT1 mapping of the heart. Magnetic Resonance in Medicine . 2004;52(1):141–146. doi: 10.1002/mrm.20110. [DOI] [PubMed] [Google Scholar]
- 24.Hundley W. G., Bluemke D., Bogaert J. G., et al. Society for Cardiovascular Magnetic Resonance guidelines for reporting cardiovascular magnetic resonance examinations. Journal of Cardiovascular Magnetic Resonance . 2009;11(1):p. 5. doi: 10.1186/1532-429x-11-5. [DOI] [PMC free article] [PubMed] [Google Scholar]
- 25.Roberts M. D., Bayless D. S., Company J. M., et al. Elevated skeletal muscle irisin precursor FNDC5 mRNA in obese OLETF rats. Metabolism . 2013;62(8):1052–1056. doi: 10.1016/j.metabol.2013.02.002. [DOI] [PMC free article] [PubMed] [Google Scholar]
- 26.Samy D. M., Ismail C. A., Nassra R. A. Circulating irisin concentrations in rat models of thyroid dysfunction-effect of exercise. Metabolism . 2015;64(7):804–813. doi: 10.1016/j.metabol.2015.01.001. [DOI] [PubMed] [Google Scholar]
- 27.Ateş İ, Altay M., Topçuoğlu C., Yılmaz F. M. Circulating levels of irisin is elevated in hypothyroidism, a case-control study. Archives of Endocrinology and Metabolism . 2016;60(2):95–100. doi: 10.1590/2359-3997000000077. [DOI] [PubMed] [Google Scholar]
- 28.Uc Z. A., Gorar S., Mizrak S., Gullu S. Irisin levels increase after treatment in patients with newly diagnosed Hashimoto thyroiditis. Journal of Endocrinological Investigation . 2019;42(2):175–181. doi: 10.1007/s40618-018-0899-8. [DOI] [PubMed] [Google Scholar]
- 29.Zybek-Kocik A., Sawicka-Gutaj N., Wrotkowska E., Sowiński J., Ruchała M. Zależne od czasu zmiany stężenia irisiny u pacjentów z jawną niedoczynnością tarczycy. Endokrynologia Polska . 2016;67(5):476–480. doi: 10.5603/ep.a2016.0030. [DOI] [PubMed] [Google Scholar]
- 30.Shan D., Zou L., Liu X., Cai Y., Dong R., Hu Y. Circulating irisin level and thyroid dysfunction: a systematic review and meta-analysis. BioMed Research International . 2020;2020:11. doi: 10.1155/2020/2182735.2182735 [DOI] [PMC free article] [PubMed] [Google Scholar]
- 31.Sanchis-Gomar F., Alis R., Lippi G. Circulating irisin detection: does it really work? Trends in Endocrinology & Metabolism . 2015;26(7):335–336. doi: 10.1016/j.tem.2015.05.004. [DOI] [PubMed] [Google Scholar]
- 32.Albrecht E., Schering L., Buck F., et al. Irisin: still chasing shadows. Molecular Metabolism . 2020;34:124–135. doi: 10.1016/j.molmet.2020.01.016. [DOI] [PMC free article] [PubMed] [Google Scholar]
- 33.Xin C., Zhang Z., Gao G., et al. Irisin attenuates myocardial ischemia/reperfusion injury and improves mitochondrial function through AMPK pathway in diabetic mice. Frontiers in Pharmacology . 2020;11:p. 565160. doi: 10.3389/fphar.2020.565160. [DOI] [PMC free article] [PubMed] [Google Scholar]
- 34.Zhao Y. T., Wang J., Yano N., et al. Irisin promotes cardiac progenitor cell‐induced myocardial repair and functional improvement in infarcted heart. Journal of Cellular Physiology . 2019;234(2):1671–1681. doi: 10.1002/jcp.27037. [DOI] [PMC free article] [PubMed] [Google Scholar]
- 35.Dun S. L., Lyu R.-M., Chen Y.-H., Chang J.-K., Luo J. J., Dun N. J. Irisin-immunoreactivity in neural and non-neural cells of the rodent. Neuroscience . 2013;240:155–162. doi: 10.1016/j.neuroscience.2013.02.050. [DOI] [PMC free article] [PubMed] [Google Scholar]
- 36.Chen R.-R., Fan X.-H., Chen G., et al. Irisin attenuates angiotensin II-induced cardiac fibrosis via Nrf2 mediated inhibition of ROS/TGFβ1/Smad2/3 signaling axis. Chemico-biological Interactions . 2019;302:11–21. doi: 10.1016/j.cbi.2019.01.031. [DOI] [PubMed] [Google Scholar]
- 37.Liao Q., Qu S., Tang L.-X., et al. Irisin exerts a therapeutic effect against myocardial infarction via promoting angiogenesis. Acta Pharmacologica Sinica . 2019;40(10):1314–1321. doi: 10.1038/s41401-019-0230-z. [DOI] [PMC free article] [PubMed] [Google Scholar]
- 38.Geng Z., Fan W.-Y., Zhou B., et al. FNDC5 attenuates obesity-induced cardiac hypertrophy by inactivating JAK2/STAT3-associated inflammation and oxidative stress. Journal of Translational Medicine . 2019;17(1):p. 107. doi: 10.1186/s12967-019-1857-8. [DOI] [PMC free article] [PubMed] [Google Scholar]
- 39.Abd El-Mottaleb N. A., Galal H. M., El Maghraby K. M., Gadallah A. I. Serum irisin level in myocardial infarction patients with or without heart failure. Canadian Journal of Physiology and Pharmacology . 2019;97(10):932–938. doi: 10.1139/cjpp-2018-0736. [DOI] [PubMed] [Google Scholar]
- 40.Lee S.-P., Lee W., Lee J. M., et al. Assessment of diffuse myocardial fibrosis by using MR imaging in asymptomatic patients with aortic stenosis. Radiology . 2015;274(2):359–369. doi: 10.1148/radiol.14141120. [DOI] [PubMed] [Google Scholar]
- 41.Perea R. J., Ortiz-Perez J. T., Sole M., et al. T1 mapping: characterisation of myocardial interstitial space. Insights Into Imaging . 2015;6(2):189–202. doi: 10.1007/s13244-014-0366-9. [DOI] [PMC free article] [PubMed] [Google Scholar]
- 42.Zybek-Kocik A., Sawicka-Gutaj N., Szczepanek-Parulska E., et al. The association between irisin and muscle metabolism in different thyroid disorders. Clinical Endocrinology . 2018;88(3):460–467. doi: 10.1111/cen.13527. [DOI] [PubMed] [Google Scholar]
- 43.Ruchala M., Zybek A., Szczepanek-Parulska E. Serum irisin levels and thyroid function-Newly discovered association. Peptides . 2014;60:51–55. doi: 10.1016/j.peptides.2014.07.021. [DOI] [PubMed] [Google Scholar]
- 44.Huh J. Y., Mougios V., Kabasakalis A., et al. Exercise-induced irisin secretion is independent of age or fitness level and increased irisin may directly modulate muscle metabolism through AMPK activation. The Journal of Clinical Endocrinology & Metabolism . 2014;99(11):E2154–E2161. doi: 10.1210/jc.2014-1437. [DOI] [PubMed] [Google Scholar]
Associated Data
This section collects any data citations, data availability statements, or supplementary materials included in this article.
Supplementary Materials
Supplementary Table 1. Comparison of serum irisin levels and cardiovascular magnetic resonance parameters in controls and severe hypothyroidism patients with and without pericardial effusion (PE).
Data Availability Statement
The data generated during the current study are available from the corresponding author upon reasonable request.