Abstract
We report here an assessment of the model refinement category of the 14th round of Critical Assessment of Structure Prediction (CASP14). As before, predictors submitted up to five ranked refinements, along with associated residue-level error estimates, for targets that had a wide range of starting quality. The ability of groups to accurately rank their submissions and to predict coordinate error varied widely. Overall only four groups out-performed a “naïve predictor” corresponding to resubmission of the starting model. Among the top groups there are interesting differences of approach and in the spread of improvements seen: some methods are more conservative, others more adventurous. Some targets were “double-barrelled” for which predictors were offered a high-quality AlphaFold 2 (AF2)-derived prediction alongside another of lower quality. The AF2-derived models were largely unimprovable, many of their apparent errors being found to reside at domain and, especially, crystal lattice contacts. Refinement is shown to have a mixed impact overall on structure-based function annotation methods to predict nucleic acid binding, spot catalytic sites and dock protein structures.
1. Introduction
The Critical Assessment of Structure Prediction (CASP) refinement category ran for the first time at CASP8 in 2008 1. The aim was to systematically test methods that could push initial structure predictions, initially deriving from template-based modelling alone, closer to the native structure. At the time it was particularly envisaged that Molecular Dynamics (MD)-based methods could have a significant role. At CASP9, refinement was found to have a distinct beneficial effect on model geometry 2, although coordinate refinement remained modest and sporadic. As recognised from the beginning 1, such geometric improvement and elimination of atomic clashes is easier than systematic improvement of coordinate accuracy: the former can be achieved by local conformational sampling, while larger-scale shifts require an algorithm that can avoid trapping in local energy minima and distinguish the correct direction of travel from the much larger number of ways in which a model structure can be degraded. Nevertheless, impressive results by the FEIG group at CASP10 demonstrated that most models could be systematically improved by restrained MD 3. In more recent CASPs, such MD_based approaches have been profitably adopted and adapted by other groups (eg 4), sometimes with a specific focus such as loops 5 and alternative approaches, most notably from the BAKER group 6, have emerged as rivals.
It is recognised that the refinement category is something of a special case in CASP by taking as targets selected products of another category, namely the primary structure prediction exercise. This means that as the original prediction algorithms improve, including by harnessing explicit refinement steps, refinement groups need to improve every time merely to stand still in terms of the headline statistics 7. Targets have also been observed to differ in their refinability 7 so the obviously different selections made for each exercise might influence difficulty in unappreciated ways. Here in CASP14, AlphaFold 2 (AF2)-derived refinement targets, selected alongside poorer quality models as “double-barrelled” targets, proved to be a special case. Even the best methods failed to drive them closer to the experimental structures, but detailed analysis suggests they were, to a large extent, not meaningfully improvable since their deviations lay mainly at crystal lattice contacts where the experimental structure is potentially unrepresentative of biologically relevant conformations. . As with other CASP categories, accurate model quality assessment is fundamental here since alternative strategies can be employed for higher- or lower-quality models (eg 6) and refinement effort can be productively focussed on areas that are predicted to be inaccurately modelled. Here we show, however, that groups still differ widely in their ability to rank submissions by overall quality and to predict local coordinate error at a residue level.
It is important to remember that the value of a model, refined or otherwise, lies not only in the overall fold and what that may reveal about evolution and function, but also in its use, for example, for more detailed structure-based function prediction 8, for structure-based in silico ligand screening and as a search model in Molecular Replacement (MR) eg 9, 10. Here we show that refinement affects - often positively but not exclusively so - the readout of catalytic site recognition and prediction of nucleic acid binding ability. A similarly mixed picture is obtained from comparing the protein-protein docking of unrefined and refined models with that of the experimental structures. Less ambivalently, we show elsewhere in this issue 11 that refinement often significantly improves performance in MR, frequently converting an unsuccessful starting model into a structure that succeeds.
2. Materials and Methods
2.1. Target selection and characteristics
Refinement targets were selected on a continuous basis during the CASP experiment. When a target closed for regular prediction, consideration was given to whether a submission (or occasionally two - see “double-barrelled” targets below) might be suitable. This decision factored in its size (a target should be tractable for even compute-intensive methods based on MD) and quality (it should be neither irredeemably poor or so good that significant improvement would be difficult). In addition to available quantitative measures of coordinate quality, potential targets were examined visually to be sure that their errors were plausibly refinable and, in particular, did not lie predominantly at interfaces between domains or chains. This latter selection was designed to address the previous observation (CASP13 paper) that missing structural context hampers refinement. Table 1 indicates characteristics of the final set of refinement targets.
Table 1.
Features of the selected refinement targets
| TARGET ID(S) AT REFINEMENT PHASE… | ID OF EXTENDED REFINEMENT TARGET, WHERE APPLICABLE | RESIDUES INCLUDED | RESIDUES IN REFINEMENT TARGET | CLASSIFICATION | STARTING MODEL | REFINEMENT TARGET STARTING GHT_HA | EXPERIMENTAL STRUCTURE IS NMR OR CRYO-EM? |
|---|---|---|---|---|---|---|---|
| R1029 | R1027x1 | 1-125 | 125 | FM | TS364_4 | 27.6 | NMR |
|
| |||||||
| R1030-D2 | 155-273 | 119 | TBM-hard | TS362_5-D2 | 40.34 | ||
|
| |||||||
| R1031 | 1-95 | 95 | FM | TS042_1 | 52.11 | ||
|
| |||||||
| R1033 | 1-100 | 100 | FM | TS376_1 | 37.75 | ||
|
| |||||||
| R1034 | R1034x1 | 1-156 | 156 | TBM-easy | TS070_1 | 70.03 | |
|
| |||||||
| R1035 | 1-102 | 102 | FM/TBM | TS031_2 | 69.12 | ||
|
| |||||||
| R1038-D2 | 123-198 | 76 | FM/TBM | TS326_5-D2 | 56.58 | ||
|
| |||||||
| R1039 | 1-161 | 161 | FM | TS031_1 | 36.022 | ||
|
| |||||||
| R1040V1 | 1-130 | 130 | FM | TS427_1 | v1-53.84 | ||
| R1040V2 | TS435_2 | v2-30.96 | |||||
|
| |||||||
| R1041V1 | 1-242 | 242 | FM | TS427_5 | v1-70.25 | ||
| R1041V2 | TS031_1 | v2-42.35 | |||||
|
| |||||||
| R1042V1 | 1-276 | 276 | FM | TS403_1 | v1-34.69 | ||
| R1042V2 | TS427_1 | v2-65.58 | |||||
|
| |||||||
| R1043V1 | 1-148 | 148 | FM | TS403_1 | v1-43.41 | ||
| R1043V2 | TS427_1 | v2-65.37 | |||||
|
| |||||||
| R1045S2 | 8-173 | 166 | TBM-hard | TS238_1 | 61.6 | ||
|
| |||||||
| R1049 | 1-134 | 134 | FM | TS351_1 | 50.93 | ||
|
| |||||||
| R1052-D2 | 540-588,669-832 | 213 | TBM-easy | TS209_1-D2 | 57.98 | ||
|
| |||||||
| R1053V1 | 407-577 | 171 | FM/TBM | TS042_5-D2 | v1-53.07 | ||
| R1053V2 | TS427_4-D2 | v2-80.12 | |||||
|
| |||||||
| R1055 | R1055x1 | 3-124 | 122 | FM/TBM | TS013_2 | 59.22 | NMR |
|
| |||||||
| R1056 | R1056x1 | 13-181 | 169 | TBM-hard | TS183_2 | 49.7 | |
|
| |||||||
| R1057 | 1-121,127-184,200-241,255-279 | 246 | TBM-easy | TS209_2 | 64.4 | ||
|
| |||||||
| R1061-D3 | 736-838 | 103 | TBM-easy | TS277_3-D3 | 58.25 | CRYO-EM | |
|
| |||||||
| R1065S1 | 6-124 | 119 | TBM-hard | TS351_4 | 73.32 | ||
|
| |||||||
| R1065S2 | 1-98 | 98 | FM/TBM | TS209_1 | 74.75 | ||
|
| |||||||
| R1067V1 | R1067x1 | 44-264 | 221 | TBM-hard | TS473_3 | v1-46.27 | |
| R1067V2 | TS427_1 | v2-79.08 | |||||
|
| |||||||
| R1068 | R1068x1 | 13-203 | 191 | TBM-hard | TS238_1 | 40.64 | |
|
| |||||||
| R1074V1 | 71-202 | 132 | FM | TS427_1 | v1-78.41 | ||
| R1074V2 | R1074x2 | TS140_5 | v2-35.61 | ||||
|
| |||||||
| R1078 | 3-131 | 129 | TBM-hard | TS226_2 | 69.69 | ||
|
| |||||||
| R1082 | 23-97 | 75 | FM/TBM | TS042_1 | 52.66 | ||
|
| |||||||
| R1085-D1 | 173-339 | 167 | TBM-hard | TS468_1-D1 | 42.5 | ||
|
| |||||||
| R1090 | 2-192 | 191 | FM | TS351_1 | 44.44 | ||
|
| |||||||
| R1091-D2 | 498-604 | 107 | TBM-easy | TS351_3-D2 | 60.75 | ||
Compared to previous CASPs, two different classes of refinement target were introduced. With the first, indicated in Table 1, groups were allowed six weeks for refinement rather than the usual three weeks. The six week extended versions bore names such as R1034×1, the regular three week submissions being R1034 etc. The second innovation was what we refer to as double-barrelled targets. As CASP14 progressed it became obvious that one group, ultimately revealed to be AlphaFold 2 (AF2), performed significantly better than all others. Although the AF2 submissions typically had less, and sometimes very little, room for improvement, we considered that perfecting them further represented an interesting and potentially important challenge. Certain proteins, the “double-barrelled” targets were therefore represented by both an AF2 prediction and a prediction from another group. There were seven targets of this type and they were named, for example, R1074v1 and R1074v2, the labelling as v1 or v2 being random between targets. As an unforeseen consequence of this, for three targets one group submitted (unpublished communications) derivatives of the AF2 models as ‘refinements’ of the non-AF2 target. In certain places indicated below we chose to exclude these points from our analysis.
Table 2 compares sizes and categories of the CASP14 refinement targets to those of CASP13 while Figure 1 illustrates their range of quality, expressed as GDT_HA (or GDTHA), with the previous two CASPs. In terms of quality, this set of refinement targets is comparable to those of previous CASPs, but clearly the mean size of target has crept up from 134 to 149 since CASP13. There has also been a change of distribution between Template-Based Modelling (TBM) and Free Modelling (FM) categories with a shift towards more difficult targets: the latter outnumbered the former around 2:1 in CASP14, a reversal of the CASP13 distribution.
Table 2.
Number of CASP14 targets in Template-Based Modelling (TBM) and Free Modelling (FM) categories and size measurements. Numbers in parentheses indicate values from CASP13. Extended and “double-barrelled” targets (see main text) are counted once here.
| Target class | Number of targets | Size in residues | ||
|---|---|---|---|---|
| minimum | maximum | mean | ||
| TBM-easy | 5 (13) | 103 | 246 | 165 (132) |
| TBM-hard | 8 (5) | 119 | 221 | 160 (130) |
| FM/TBM | 6 (5) | 75 | 171 | 107 (142) |
| FM | 11 (6) | 95 | 276 | 157 (137) |
| all | 30 (29) | 75 (77) | 276 (204) | 149 (134) |
Figure 1.
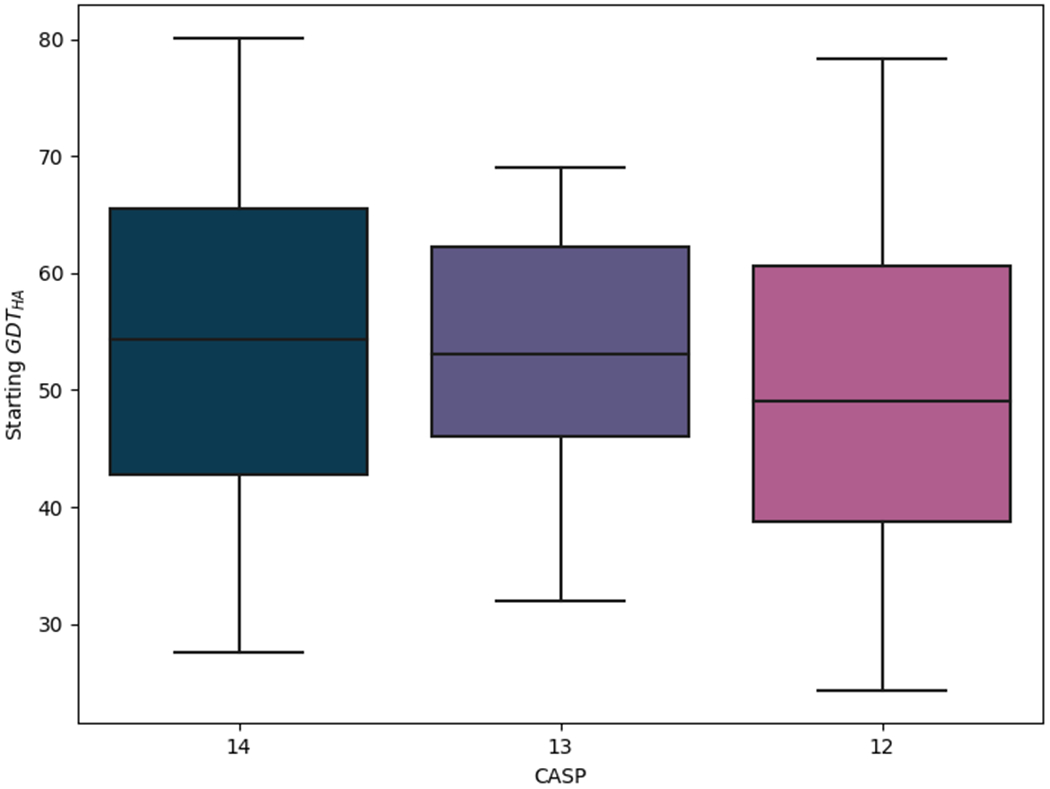
Comparison of the accuracy of models suggested as starting structures for refinement in CASP12-14. The accuracy is expressed in terms of GDT_HA. Box limits indicate upper and higher quartiles, whiskers indicate upper and lower bounds and a horizontal line in the middle of the box represents the median.
2.2. Evaluation
2.2.1. Overall ranking
In order to allow ready comparisons with other CASPs, we used the CASP12 refinement ranking score. This score was derived using a machine learning approach to reproduce automatically the expertly assigned scores of four independent assessors 12. For a single target it is given by
It includes five weighted z-scores (standard deviations above the mean of all submissions). Three of these assess atomic positional accuracy:RMS_CA is the local-global alignment (LGA; 13) sequence-dependent calculation of root-mean-square deviation between the superposed model and target, GDT_HA is the high-accuracy variant of the GDT score 13, SG is the SphereGrinder score that captures the local similarity of model and target at each residue within a sphere of 6Å 14. The Quality Control Score (QCS) assesses the correctness of secondary structure elements and their relative arrangements 15 while the Molprobity score assesses stereochemical parameters of backbone and side chains, as well as measuring atomic clashes 16. For overall group rankings SCASP12 scores are summed across all targets after discarding outliers (see 12 for details)..
2.2.2. Refinability
We wished to investigate properties of refinement targets that made them more (in)tractable. For this purpose we devised a simple refinability metric for each target as ∑ΔGDT_HA where ΔGDT_HA is the improvement (positive values) or worsening (negative) of the GDT_HA value from the starting refinement model to the particular refined version. We considered six variant scores differing combinatorially: firstly in whether for a target the sum was over all groups or only the top four groups; and secondly in which submissions were considered - only the group’s self-defined top prediction (model_1), the actual best prediction or all predictions (models 1 to 5, if available).
2.2.3. Assessing refinement groups’ self-assessments
Groups were asked to submit what they consider to be their best model as number 1, their next best as 2 and so on. We assessed their performance here by measuring a Spearman’s correlation coefficient between the submission order and the actual ranking of model accuracy expressed as GDT_HA. We additionally recorded for each group the % of targets where model_1 was indeed the highest accuracy model submitted.
Groups are also asked to include per-residue error estimates in the B-factor column of their submissions. These are scored at the CASP website using the ASE (Accuracy Self Estimate) score, which captures in a single value between 0-100 how well the error estimates and actual errors align in a given prediction. It should be mentioned though, that ASE score can be considered only as a supplementary measure as a good ASE score can correspond to a very poor structural model, for which authors ‘correctly predicted’ large local deviations for the vast majority of atoms.
2.2.4. Function prediction
In order to assess the impact of refinement on readout of structure-based function prediction methods, targets that were enzymes and/or nucleic acid binding proteins were identified. Catalytic sites from the Catalytic Site Atlas (CSA; 17) were then sought using the 3D-motif matching methods implemented at CatsId 18 and ProFunc 19. Nucleic acid binding capacity was predicted with the structure-based methods DNA_bind 20 and BindUP 21.
2.2.5. Docking assessment for function prediction
In order to assess the impact of model refinement on the ability to predict protein-protein interactions, ClusPro 22 was used to dock the subunits of targets involved in this kind of interactions. In those cases where pre-existing mutagenesis evidence implicating specific residues on the interaction was available, contact restraints were provided as they could be inferred from these experimental data. All other parameters were left at their default values. The quality of the resulting docked subunits was then assessed using PPDbench 23, which was used to calculate the fraction of native contacts (Fnat), ligand RMSD (L-RMSD) and interface RMSD (I-RMSD) between the docked pose obtained with ClusPro and the ground truth as observed on the crystal structures. These values were then used to determine the quality of the docking, using the CAPRI assessment protocol (Supplementary Table 1; 24)
2.2.6. Assessment of proximity of modelling errors and interfaces
In order to assess whether error regions present in the AF2 models selected for refinement were located in the vicinity of intermolecular interfaces that were not considered during the refinement stage and therefore could preclude successful refinement of such local errors, they were analysed as follows. Error regions were defined as comprising at least three consecutive residues with a five residue-window rolling average LGA distance (between target and experimental structure superimposed using the sequence-dependent algorithm) of at least 3Å. If the residues within this error region had an average of at least 0.5 residues originating in a symmetry mate, another chain or a different domain within a radius of 10Å -measured between Cα; the error region was then defined as neighbouring an unmodelled portion in one of these three categories, according to the predominant kind of contact observed.
3. Results and Discussion
3.1. Overall group rankings
For comparability with previous CASP rounds we employed the CASP12 scoring for overall ranking of groups (see Materials and Methods). This score was derived using a machine learning approach to reproduce automatically the expertly assigned scores of four independent assessors 12. It includes (see Materials and Methods) five weighted terms, three of which assess Cα positional accuracy, the Quality Control Score 15 which assesses secondary structure elements and the Molprobity score 16 for stereochemical analysis. Since the CASP12 score terms are Z-scores and more groups degrade model quality overall than improve it, then it is useful to compare the overall ΣSCASP12 score of each group with a “naïve predictor” corresponding simply to resubmission of the starting structures.
Figure 2A shows that, across all regular targets only four groups out-performed the “naïve predictor” : the human FEIG and its server equivalent FEIG-S, the overall top-scoring group BAKER, and the DellaCorteLab. This, along with the observation that only the FEIG group managed to improve more than half the targets (Figure 2B), is testimony to the continuing difficulty in consistently refining target structures. Quite distinct methods lie behind the most successful approaches. The FEIG and FEIG-S approaches are based on MD with flat-bottom harmonic restraints. New for CASP14 was additional sampling by the generation of multiple alternative initial models using Modeller 25 and templates identified by HHsearch 26. The DellaCorteLab uses a modified version of the FEIG group MD-based approach from CASP13, differing in details of salt concentration, equilibration and restraint application. In contrast, the BAKER group carries out all-atom refinement in Rosetta using information from a deep learning framework that estimates per-residue accuracy and residue-residue distances.
Figure 2.
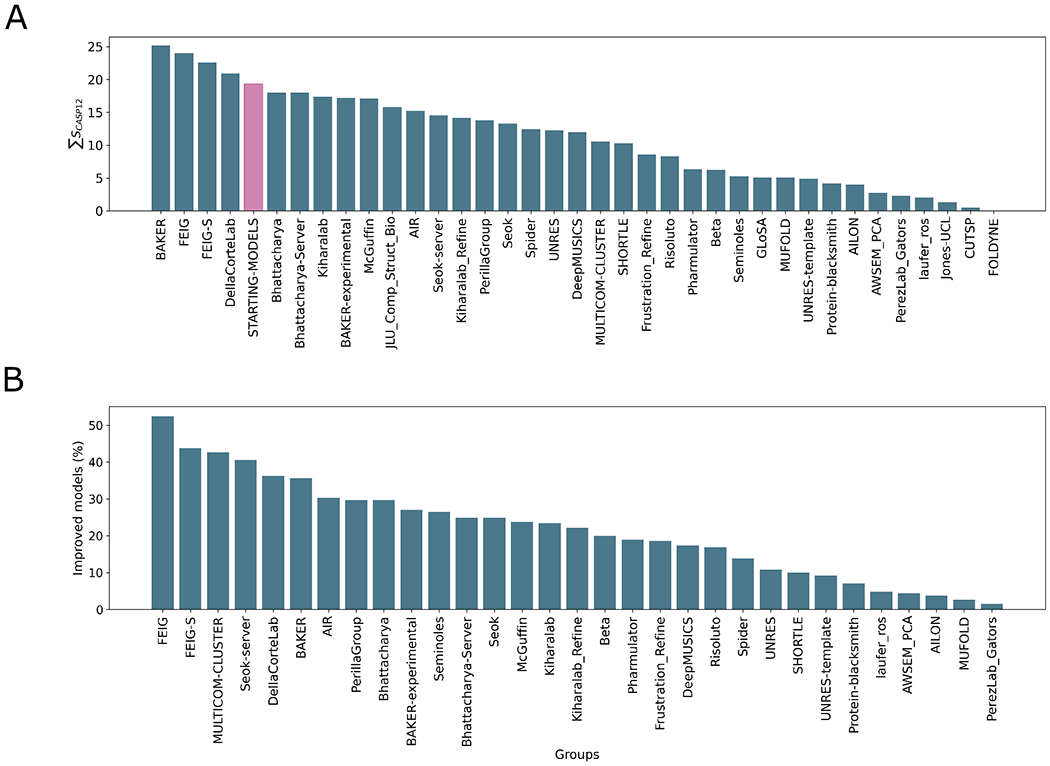
Overall group ranking according to the ΣSCASP12 score (A) and proportion of models improved by each group (B). The “naïve predictor” corresponding to resubmission of the starting models is shown in pink in A. The data used to generate these figures are from the regular refinement targets i.e. excluding the extended targets but including the double-barrelled targets.
While bearing in mind that the sample size is relatively small, some differences in performance on different groups of targets can be tentatively proposed. Figure 3 shows, unsurprisingly, that more groups perform well with smaller proteins, where conformational sampling is more tractable, than with larger targets. Ten groups, including the four overall top performers, outperform the “naïve predictor” on the four small targets with fewer than 100 residues. With these small targets the DellaCorteLab performs best, followed by FEIG and FEIG-S, similarly based on MD. The overall winner, the BAKER group, ranks only 8th for these targets. On the other hand, only the BAKER group beats the “naïve predictor” for the eight targets longer than 200 residues. DellaCorteLab, FEIG and FEIG-S rank 9, 12 and 7 on these largest targets. Overall, the results suggest that MD-based approaches, at least as currently configured, perform best on the smallest targets, but for larger targets their relative performance drops and the BAKER group approach would be preferred.
Figure 3.
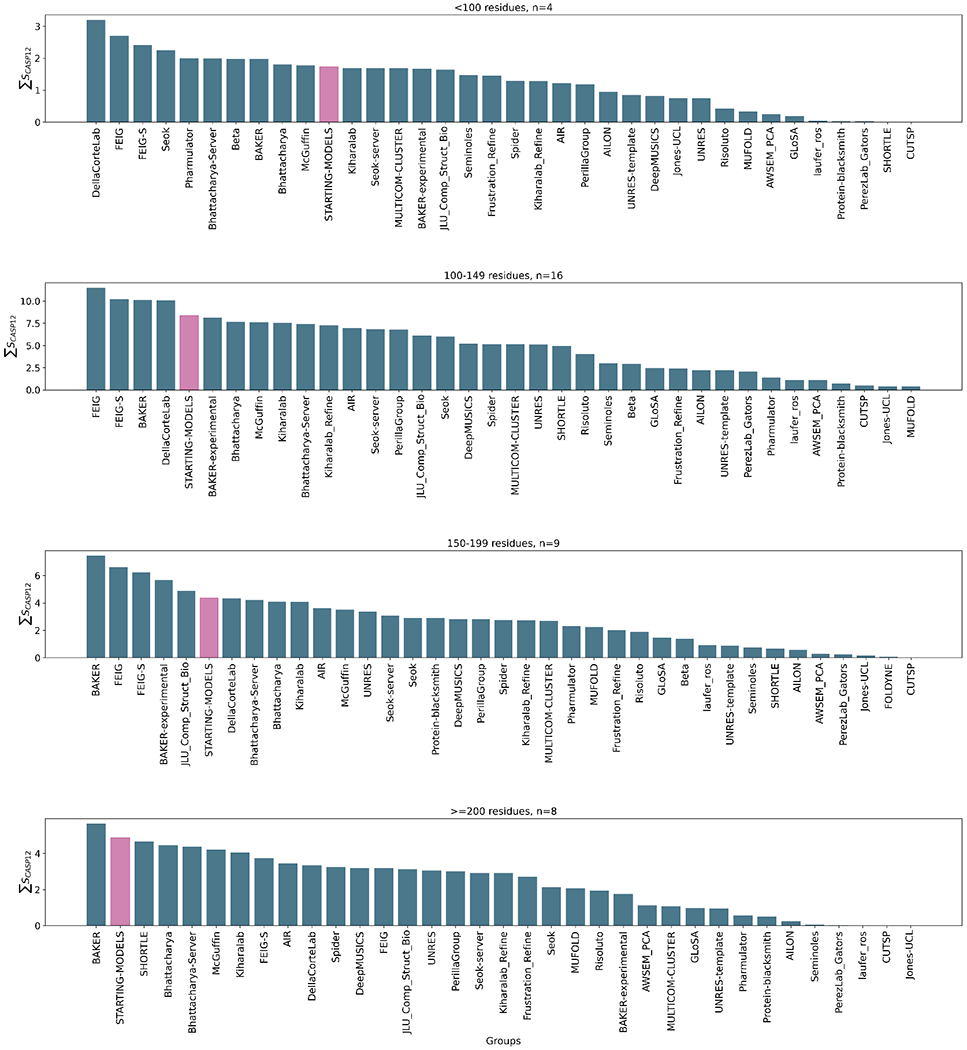
Overall group ranking according to the ΣSCASP12 score for targets subdivided according to size, from small (top) to large (bottom). The “naïve predictor” corresponding to resubmission of the starting models is shown in pink in each panel. The data used to generate these figures are from the regular targets i.e. excluding the extended targets but including the double-barrelled targets.
Figure 4 illustrates group rankings on targets classified by quality, as measured by their starting GDT_HA. While again remembering the rather small numbers in each category, there appears to be an overall trend in the number of groups out-performing the “naïve predictor” from seven for the lowest-quality starting structures to none where the targets were already of reasonable quality with GDT_HA > 70: evidently gross errors are generally easier to correct than the final incorrect details. Viewed by target starting quality there does not seem to be any observable overall difference among the top four performers between the MD-based methods and the BAKER group results. Interestingly, the JLU_Comp_Struct_Bio submission performs best in both 60 < Starting GDT_HA <=70 and Starting GDT_HA >70 categories. It employs a neural network implementation of generalized solvation free energy 27 to allow rapid structure refinement by differentiation rather than more expensive conformational sampling 28.
Figure 4.
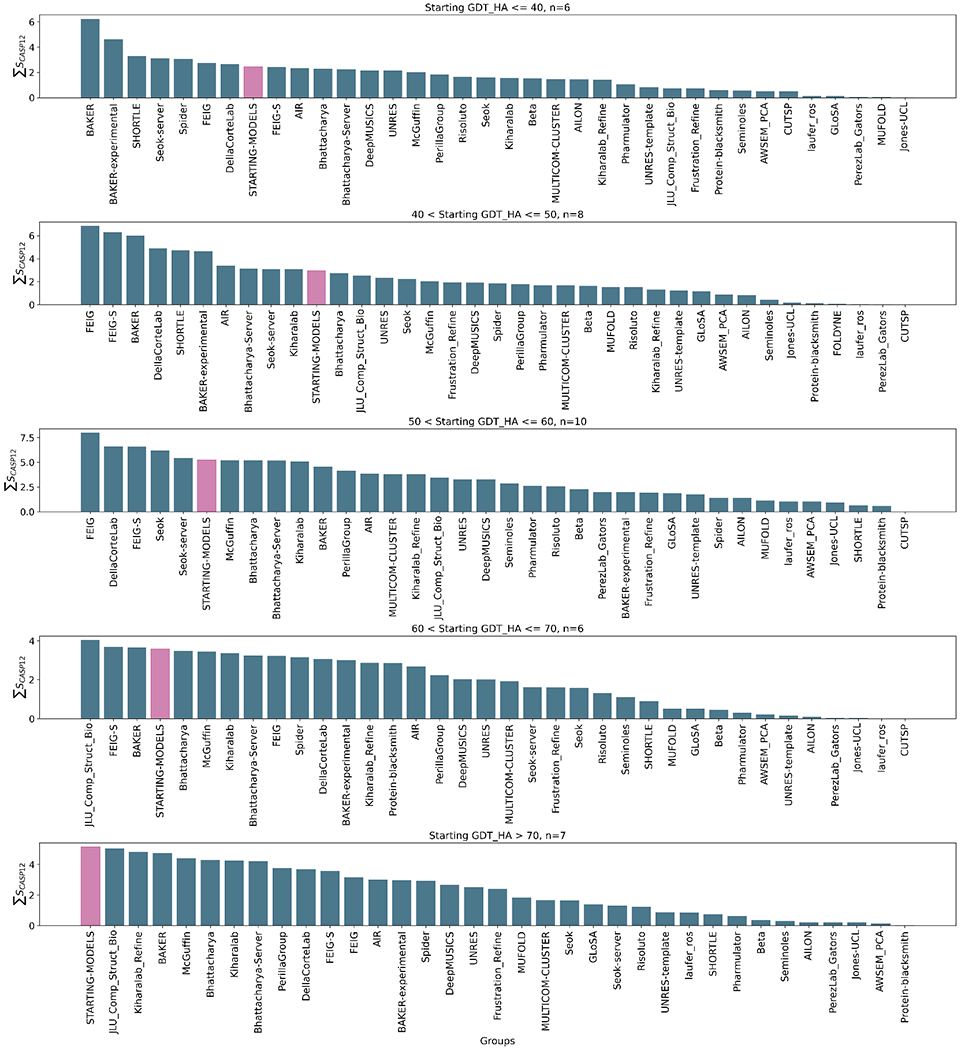
Overall group ranking according to the ΣSCASP12 score for targets subdivided according to starting quality, from poor (top) to good (bottom). The “naïve predictor” corresponding to resubmission of the starting models is shown in pink in each panel. The data used to generate these figures are from the regular targets i.e. excluding the extended targets but including the double-barrelled targets.
Figure 5 shows the distribution of ΔGDT_HA and ΔRMS_CA values for submissions by refinement groups, positive and negative respectively being refinements towards the experimental structure. The overall percentages of improved models are no better, or even somewhat worse than in recent CASP experiments. However, the AF2-derived refinement targets had some special properties that materially influence these numbers as discussed later. Figure 5 shows that the overall picture clearly improves when AF2 targets are excluded, but it remains the case that overall performance - in terms of the percentage of models with improved GDT_HA or RMS_CA - is comparable or still slightly down on previous CASPs. As commented by previous assessors, comparisons between CASPs are difficult as the targets are, by definition, different each time. Furthermore, initial predictive pipelines increasingly incorporate refinement steps, potentially reducing the scope for the separate refinement step assessed here. When considering why, despite the intense effort, refinement results seemingly show little if any progress, it is worth remembering that the mean target size this time at 149 residues is distinctly longer than at CASP13 (134), a factor that will likely depress the performance of MD-based refinement methods.
Figure 5.
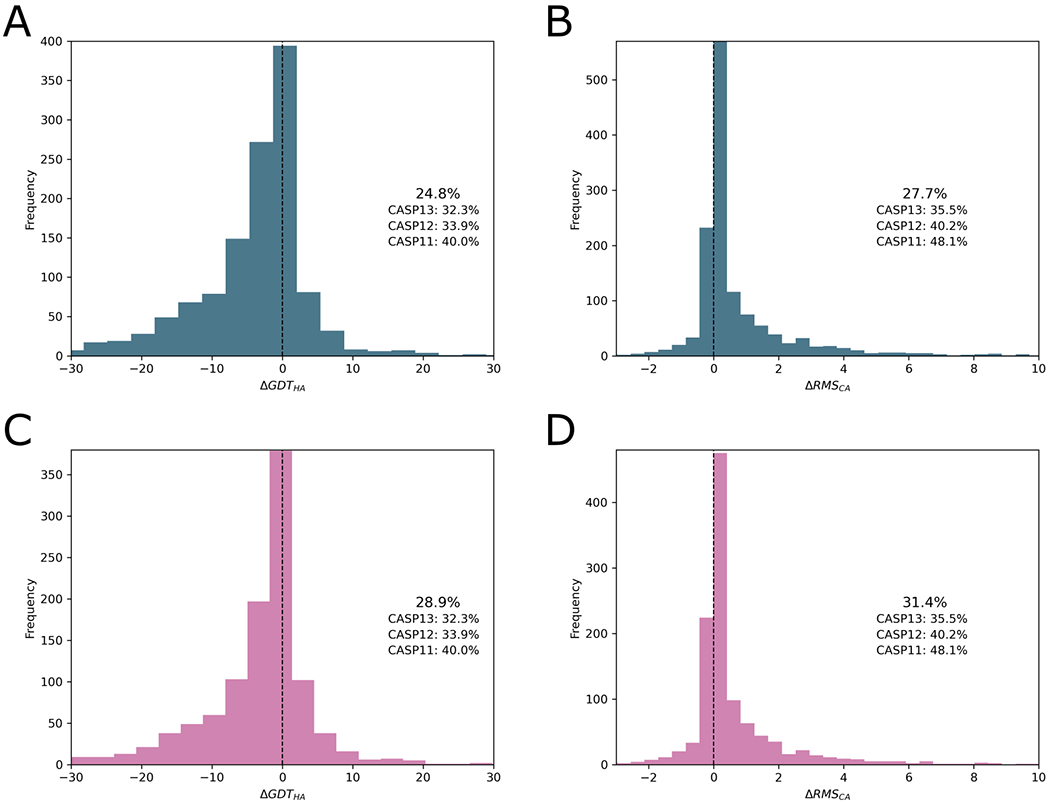
Distribution of ΔGDT_HA (A, C) and ΔRMS_CA (B, D) values for refined submissions of all groups. The numbers displayed alongside the chart compare the proportion that were improved with values from previous CASP experiments. Panels a and b show submissions for all targets, panels c and d illustrate analyses excluding targets based on AF2 modelling. The data used to generate these figures are from the regular and extended targets.
The distributions of ΔGDT_HA values for the best-performing four methods and the BAKER-experimental group, who produced a number of very large improvements, are shown in Figures 6 and 7. For example, the GDT_HA value of R1085-D1 increased from 42.5 to 73.1 after refinement by the BAKER-experimental group. Interestingly, Figure 7 suggests it is possible to distinguish between the more conservative MD-based methods and the more expansive protocols from the Baker group. The DellaCorteLab submissions are quite narrowly distributed about ΔGDT_HA of −0.3 indicating that the maximum improvement to be expected is relatively modest but, similarly, a model is unlikely to be significantly degraded in quality. The FEIG and FEIG-S distributions, in comparison, are flattened somewhat so that bigger improvements are sometimes seen but, at the same time, other models are more significantly degraded in quality. An example of a FEIG-S refinement is shown in Figure 8. The BAKER and, especially, the BAKER-experimental protocols broaden the distributions further so that occasional large improvements are accompanied by sometimes much larger worsening of quality.
Figure 6.
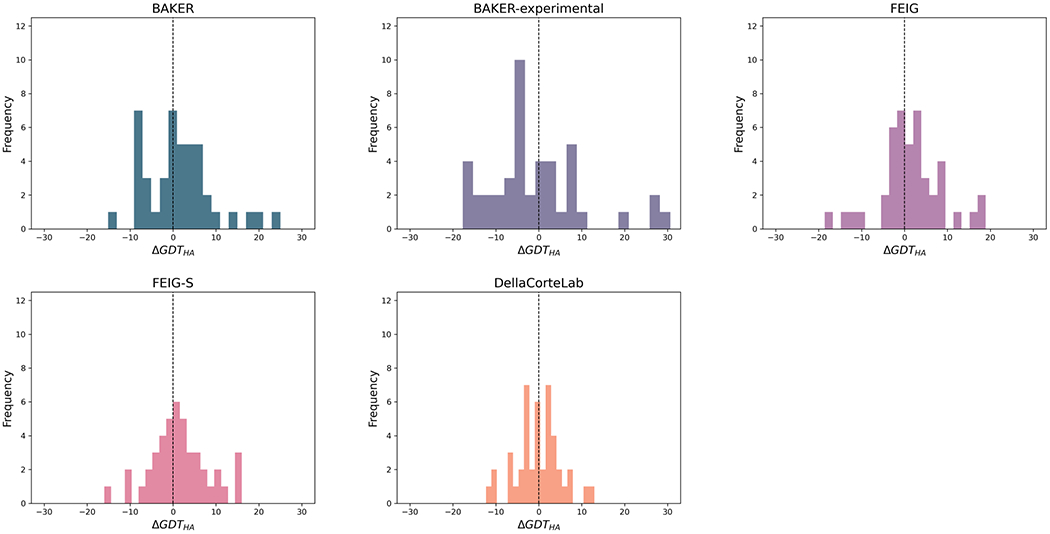
Distribution of ΔGDT_HA values for named groups. They are the four overall top-performing groups with the addition of BAKER-experimental which achieved the largest single refinement. The data used to generate these figures are from the regular and extended targets.
Figure 7.
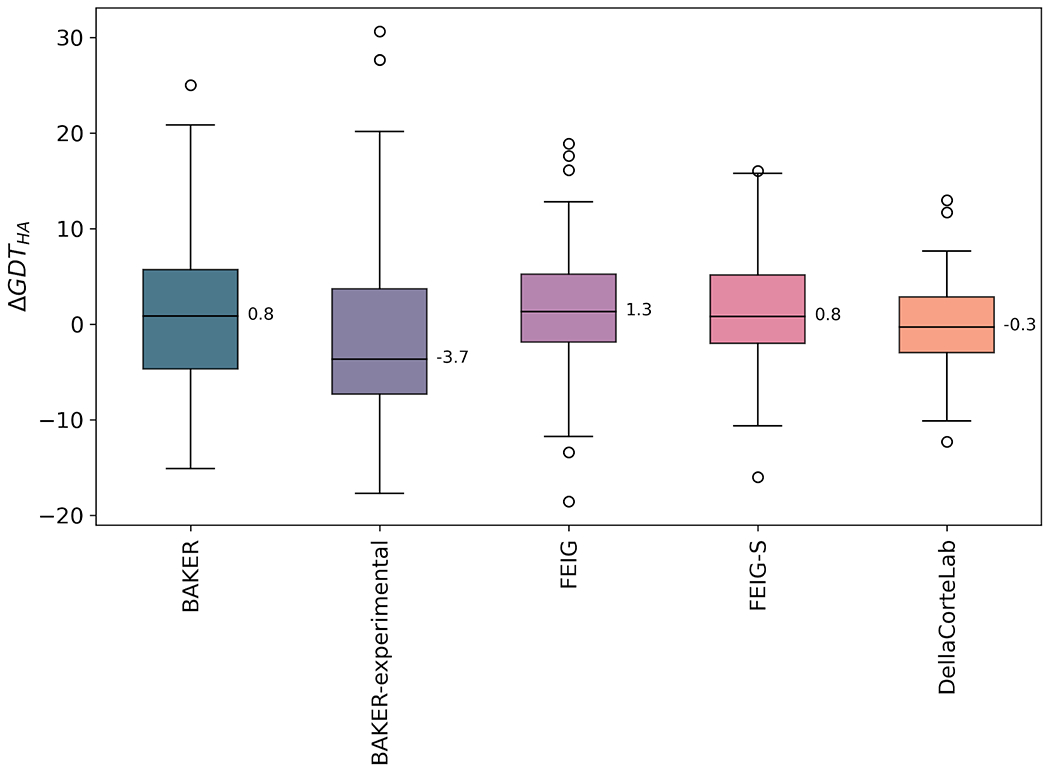
Distribution of ΔGDT_HA values represented as a box and whisker plot for named groups. Box limits indicate upper and higher quartiles, whiskers indicate upper and lower bounds, circles represent outliers and a horizontal line in the middle of the box represents the median, also labelled. The data used to generate these figures are from the regular and extended targets.
Figure 8.

A typical example of a refinement, here T1090 refined by FEIG-S (ΔGDT_HA = 16.01) - A shows a superposition of the starting model (blue) and the crystal structure (grey). B shows a superposition of the starting model (blue), the refined model (pink) and the crystal structure (grey). C shows a superposition of the refined model (pink) and the crystal structure (grey).
These characteristics can be related to the details of the protocols. Restrained MD lies at the heart of the DellaCorteLab and FEIG submissions. Restraints have been found to be necessary for avoiding model degradation but, naturally, limit the conformational space that can be sampled. The greater breadth of the FEIG and FEIG-S distributions compared to DellaCorteLab may be due to the innovation of the FEIG lab in sampling from alternative initial template-based models, as well as from the CASP refinement target. The Rosetta protocols behind the BAKER submissions can sample conformational space more broadly. This effect is enhanced in the BAKER-experimental protocol where deep learning-guided fragment insertion and rigid body movements form part of the procedure.
3.2. Refinability
Since even the best performing groups clearly struggle with some targets, we thought it interesting to study which kinds of targets could be refined, and which consistently confounded the refinement groups. We therefore devised a simple metric of refinability (see Material and Methods) which sums the improvements (or deteriorations) seen on a per-target basis. The basic refinability scoring concept can be applied to selected or all groups and selected or all submissions.
Analysis (Supplementary Figure 1) shows that the six variant scores we trialled (all groups or only the top four; model_1, or model_1 to model_5, or highest quality model) correlated quite well with each other. We therefore looked first at target refinability for all groups and all submissions, then for the least correlated variant - top groups, best submission.
The per-target refinability scores for all groups and all submissions show that percentage regular secondary structure is not significantly correlated with refinability and target size is only weakly correlated (Figure 9). Thus, targets containing less regular secondary structure are no harder to refine (expressed as improvement in GDT_HA value) than other structures, and the effect of length is only weak, at least within the ranges sampled by the target selection. However, there is a significant negative correlation between the starting GDT_HA value of a target and its refinability: higher quality starting models are harder to improve. Interestingly, Figure 9 also highlights that across all groups and all submissions only a single target - R1030-D2 a helical domain of a bacterial adhesin - has a positive refinability value.
Figure 9.
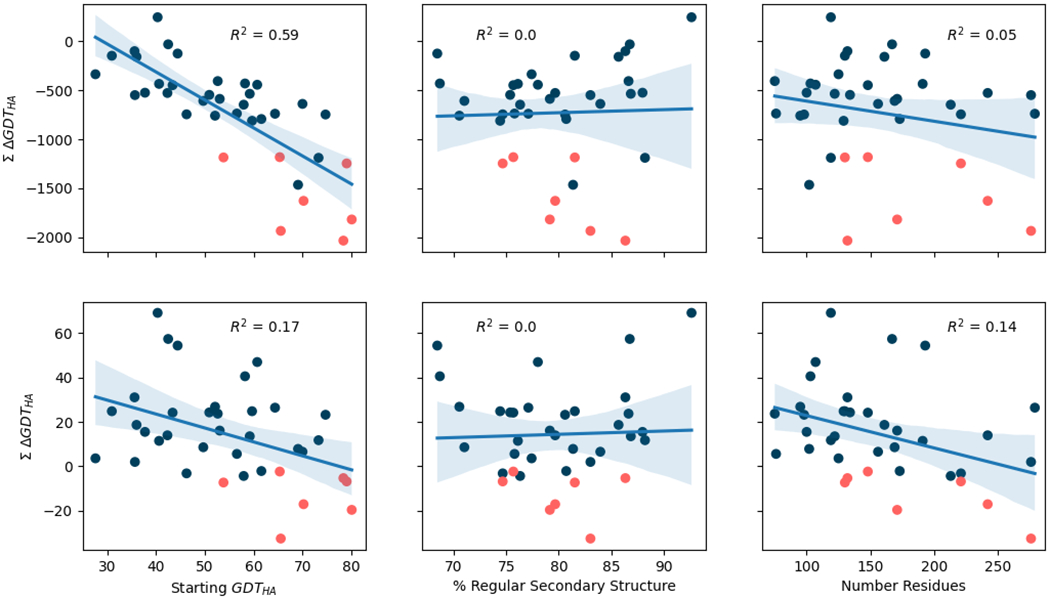
Correlation between target refinability - defined as the sum of the difference of GDT_HA before and after refinement - and three different factors: the starting GDT_HA of the refinement target, the target’s percentage of regular secondary structure and its total number of residues. Top row corresponds with data obtained across all submissions from all groups, bottom row with data observed across the top four groups’ best submissions. A linear model was fitted into the data displayed at each figure and included in the form of a line, together with the R2 value resulting from this model. Shaded bands around the regression line depict the 95% confidence interval for the regression estimate. Each point represents a different refinement target, those coloured in orange highlight refinement targets derived from AF2 modelling results. Only refinement target accuracy is correlated significantly with refinability, and the correlation is weaker for the top groups than for all groups.
In comparison, the refinability values calculated just from the top four groups’ best submissions show a much weaker association with starting model quality (Figure 9). This suggests that the best groups achieve similar performance across the range of target difficulties, with better starting structures proving more tractable for them than for other groups. By this refinability measure, most targets have positive values showing they can, on average, be improved by the top four groups. Intriguingly, however, AF2-derived targets (shown in orange in Figure 9) buck this trend and cannot, on average, be improved.
In order to test the universality of this observation across all groups and submissions, we plotted the per-target distributions of ΔGDT_HA (Figure 10a). For an orthogonal view of model quality we also performed a similar analysis with respect to FlexE scores (Figure 10b). FlexE estimates the energy of deformation between the model and the experimental structure 29. Negative ΔFlexE values indicate improvements in the native-likeness of the protein structure 29. By both measures, AF2-derived targets are anomalous in their near-unrefinability. Across all groups and all submissions, there are very few that improve AF2-derived targets, and the improvements are marginal at best.
Figure 10.
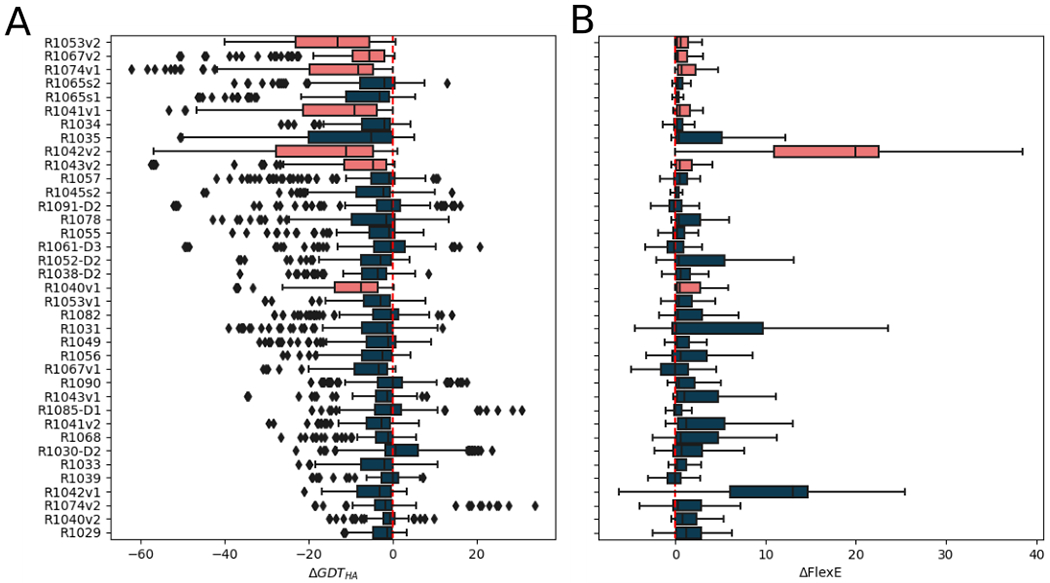
Distributions of ΔGDT_HA (A) and ΔFlexE (B) scores across all submissions for each target. Box limits indicate upper and higher quartiles, whiskers indicate upper and lower bounds and a horizontal line in the middle of the box represents the median. Model improvement corresponds to positive ΔGDT_HA and negative ΔFlexE values. The vertical dotted lines are drawn at zero - no change in model quality after refinement. Outliers are depicted as a rhombi in figure A but, for clarity, are omitted in figure B where they all had values above 0. Targets are ordered by their starting GDT_HA value from high (better model) at the top to low (poorer model) at the bottom. Targets deriving from AF2 predictions are coloured orange. Three submissions for double-barrelled targets involving cross submission of AF2-derived predictions (see Materials and Methods) are not shown.
Since non-AF2-derived targets of similar starting quality can be improved in both GDT_HA and FlexE (Figure 10) we sought an explanation for the anomalous behaviour of AF2-derived refinement targets. Visual inspection first suggested that the answer may lie in crystal lattice interfaces. Clearly, crystal packing can distort local protein structure from its favoured solution structure(s): a correct prediction of the (or a) relevant biological conformation could therefore appear to be an error in these circumstances. We therefore explored ways to quantify the extent to which error regions in the original AF2-derived targets (regions with smoothed LGA residue error of > 3Å over three or more consecutive residues) coincided with crystal lattice contacts (see Materials and Methods). (No AF2-derived targets were for structures determined by NMR or Cryo-EM.) For comparison, we similarly assessed contacts between the (sub-)structures represented by the AF2-based targets and other chains and domains. Since the context provided by other chains or domains would not be considered during the refinement exercise, such contacts would provide an alternative explanation for the inability of AF2-derived targets to be refined.
Table 3 presents a summary of this analysis. It is evident that the error regions in the initial AF2-derived targets are quite commonly found at crystal lattice contacts - eight regions, 64 residues - and only rarely at interfaces with other domains of the same protein - one region, five residues - and not, in this set, at all at interfaces with other chains. The remainder, that we term uncomplicated errors, are not in any of these categories, for at least one chain in the asymmetric unit: these include five error regions encompassing 35 residues. Some cases (italicised in Table 3) place regions at a crystal lattice or domain interface but only for one chain: these are counted as uncomplicated errors since the conformation of the region is essentially the same in each chain: thus, the interface location of one chain does not appear to distort the structure and thereby provide an explanation for the error. Figure 11 illustrates the error regions determined for AF2-derived R1067v2 and how they are each positioned near a crystal lattice contact. For comparison, we also show a non-AF2 target R1091-D2 which contains error regions that are uncomplicated by contact with crystal symmetry mates, other chains or other domains.
Table 3.
Analysis of the neighbourhoods of error regions in the AF2 models (see Materials and Methods for definitions). Error regions are classified (for each chain where appropriate) according to whether they predominantly lie near other symmetry mates in the crystal lattice, other domains in the native protein containing the refinement target sequence, or neither. We considered the possibility of contacts with other chains in the asymmetric unit but there were no cases like this. Each cell contains ranges of residues considered as error regions in the AF2-based refinement target. Numbers in parentheses correspond with the average number of contacting residues (in a symmetry mate or another domain) for residues in the error region. Where a region is categorised differently in different chains (italicised) it is excluded from the lattice contact and domain contact totals but included in the uncomplicated error column.
| Target | Chain | Errors near lattice contacts | Errors near domain contacts | Uncomplicated errors |
|---|---|---|---|---|
| 1040 | A | 35-51 (1.9) 97-99 (3.3) |
70-74 (0) | |
| B | 35-51 (1.6) 97-99 (4) |
70-74 (0) | ||
| 1041 | A | 191-200 (1.7) | 18-22 (6.6) | |
| B | 18-22 (7.2) | 191-200 (0.2) | ||
| 1042 | A | 150-154 (1.2) 273-275 (1) |
96-101 (5.6)
*
247-250 (0.5) * |
|
| B | 150-154 (1) 273-275 (1.6) |
96-101 (0.3)
*
247-250 (0) * |
||
| 1043 | A | 134-137 (3.25) |
25-34 (0.1)
115-119 (0.2) |
|
| B |
25-34 (0.8) 115-119 (1.4) 134-137 (0.75) |
|||
| 1053 | A | 68-72 (0) | ||
| B | 68-72 (0) | |||
| C | 68-72 (0.8) | |||
| D | 68-72 (0) | |||
| 1067 | 79-97 (3.9) | |||
| 1074 | 21-27 (0.5) 83-88 (0.85) |
|||
| Total number of error regions | 8 | 1 | 5 | |
| Total number of residues in error regions | 64 | 5 | 35 | |
These two error regions have residues missing in chain B. Thus, it is not clear whether they should be classified as a domain contact or as uncomplicated: they are therefore exclude from the counts
Figure 11.
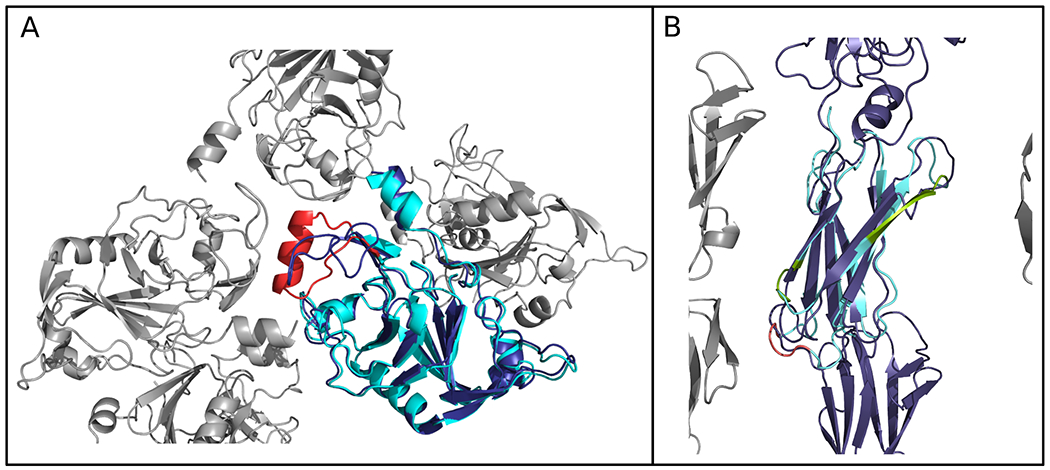
Comparison of error regions in (A) R1067v2, an AlphaFold 2-derived target with a starting GDT_HA of 79 and (B) R1091-D2, deriving from a tFold-IDT prediction with a starting GDT_HA of 61. Error regions are coloured according to whether they are at lattice contacts (red), or not (green).The remainder of the refinement target is coloured in cyan and is superimposed on the complete chain of the experimental structure (dark blue) with symmetry mates shown in grey.
The data appear to show a significant co-location of AF2 target errors and crystal lattice contacts: significantly more residues in error regions are found at crystal lattice interfaces than not. Remembering the overall extremely high quality of AF2 models in general, the question arises as to which of the structures - the AF2 prediction or the crystal structure - should be considered as the more authentic in these cases. Ordinarily, the structure based on experimental data would immediately be preferred but at crystal lattice contacts, where unnatural distortions can occur, the crystal structure should not necessarily be trusted to the same extent. Since crystal lattices take no part in the AF2 calculations (to the best of our knowledge), the resulting models do not suffer from this disadvantage. Naturally, they are only predictions, yet for the bulk of many targets they are as close a match to the native structure as would be another crystal structure of the same protein (see elsewhere in this issue). It seems we are forced to consider the prediction as not necessarily less useful or authentic than the experimental structure in these regions.
Returning to the question of refinability, overall the results suggest that the apparent unrefinability of AF2-derived targets can partly be explained by the fact that many remaining small errors lie at crystal lattice contacts. Thus, the ‘correct’, experimental structure used as a reference for refinement assessment may not necessarily be fully representative of the conformation(s) accessible in solution. This means that parts of the reference structure might not be accessible to or targeted by a refinement protocol that seeks a global energy minimum and/or a structure that satisfies covariance information deriving from residue contact constraints on natural conformations.
3.3. Self-assessments
In addition to submitting coordinates, refinement groups reported their own assessment of model accuracy in two ways, firstly at the global level, by ranking models from 1 to 5 in decreasing order of accuracy. Secondly at local level, groups are asked to submit a per-residue error estimate, unit Å, in the B-factor column of the submitted models. For different reasons each aspect has real world significance: a user would likely give most consideration to the top-ranked model, while per-residue error estimates are very valuable for search model weighting and editing when using predictions for Molecular Replacement 30.
While acknowledging the relatively small number of cases, some tentative conclusions can be drawn from Supplementary Table 2 which shows, for all groups that submitted five unique models for at least one target (all except five), an assessment of their ability to rank their five models. Most groups’ submissions (17 groups including the top four ranking overall) had a positive Spearman correlation coefficient between the model submission number 1 to 5 and the actual model quality expressed as GDT_HA. Seven groups, however, recorded a negative correlation coefficient. The ability of the groups to correctly identity their best refined model is arguably most important of all. Here, 17 groups were correct 20% or more of the time, but nine were below that level. Among the top-performing groups, BAKER, BAKER-experimental, FEIG and FEIG-S scored well at 34, 56, 30 and 50%, respectively, but DellaCorteLab was low at 11%. Some groups, notably Kiharalab, pinpointed their best prediction as model_1 very well despite scoring a low Spearman CC. This may indicate that some groups place more emphasis on detecting their best model than on ordering all five.
Per-residue error estimates are scored at the CASP website using the ASE (Accuracy Self Estimate) score (see Methods). The predictions from two groups (AIR and Frustration_Refine) were not accompanied by these error estimates while analysis suggested that the submissions from groups Risoluto, Beta and AWSEM_PCA had values in the B-factor column in a reversed order i.e. high for more accurate parts of the model. Figure 12 illustrates the ASE values for all submissions from the remaining groups. Interestingly, the overall best-performing groups occupy four of the top seven places showing that their high quality predictions are accompanied by high accuracy error estimates.
Figure 12.
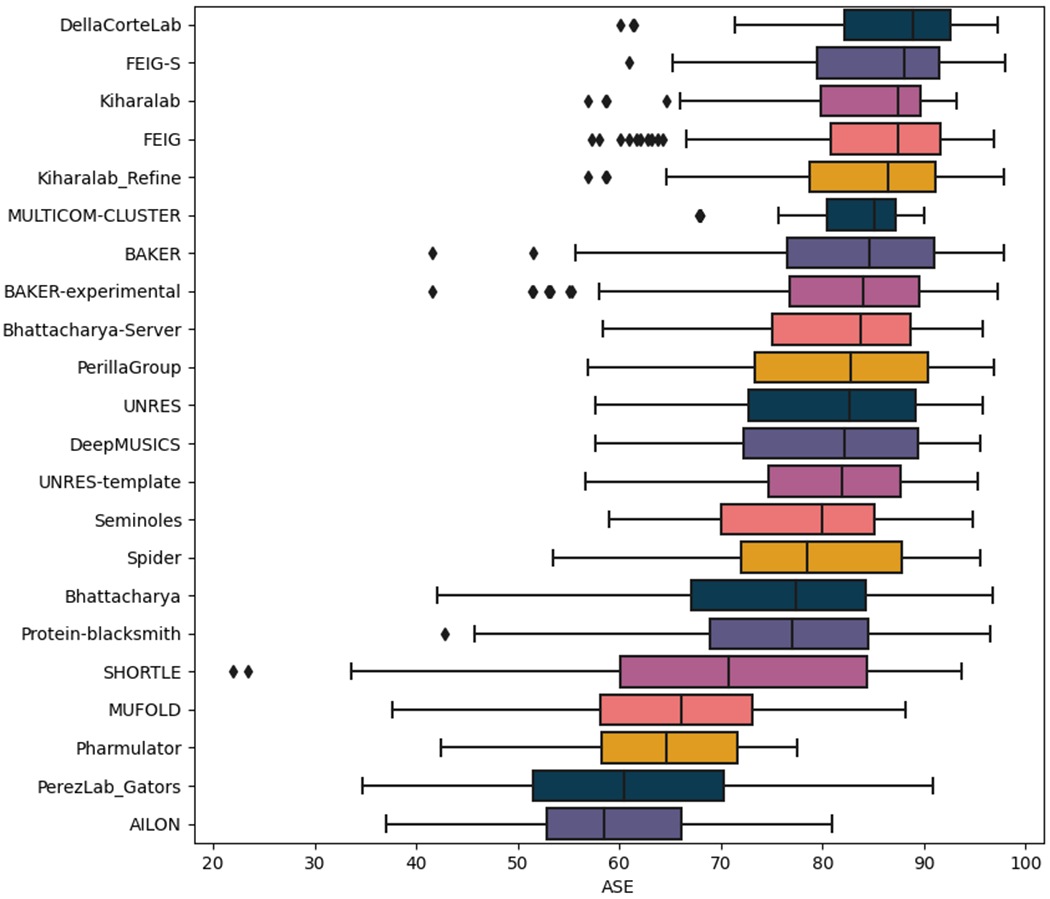
Distribution of the ASE values across all the submissions made by the refinement groups. Box limits indicate upper and higher quartiles, whiskers indicate upper and lower bounds and a horizontal line in the middle of the box represents the median. Outliers are depicted as a rhombi. Groups were ordered by descending median of their ASE values.
The ASE values also allow an analysis by target of features that are associated with the ability to accurately estimate errors. We found no association between secondary structure class (all-α, all-β, mixed), percentage regular structure and number of residues (not shown). However, there was a strong correlation between the mean ASE of a target (across all the groups shown in Supplementary Figure 2 and for all refinements) and its starting GDT_HA. Curiously the AF2-derived targets again performed differently, having lower ASE values than other targets of similar starting GDT_HA. Evidently it is harder to predict residue error for AF2-derived targets than for other comparable proteins. This is presumably because the AF2-derived targets were generally high quality throughout, not following the typical pattern of lower accuracy in exposed loops.
3.4. Extended targets
At CASP14, for the first time, for a subset of targets, refinement groups were invited to submit results after six weeks of work, in addition to submissions after the usual period of three weeks. The rationale was that some refinement methods, especially those based on MD, are quite compute-intensive and so can benefit from a longer window, particularly when dealing with larger targets.
Supplementary Figure 3A shows the groups ordered by overall performance (Figure 2) and illustrates the sum of all improvements made, expressed as sigma ΔGDT_HA, over model_1 submissions for all targets. Somewhat surprisingly, it is as common to see that the six-week submissions are worse (12 groups) than it is that they are improved (also 12). For the remaining three groups (DellaCorteLab, BAKER-experimental and MULTICOM_CLUSTER), the three- and six-week scores are identical, reflecting repeat submissions. Supplementary Figure 3B shows variation of scores on each of the seven extended targets. Again, equal numbers of targets benefit or suffer overall from the additional three weeks, while R1029 scores similarly at the two time points. Taken together, these results suggest that there is little benefit from the extended submission window of six weeks.
3.5. Structure-based function prediction
A major application of protein modelling lies in the better interpretation and prediction of function. Function prediction in CASP is a separate category reported elsewhere in this issue, but we wished to assess here what impact model refinement had on the ability to read out function from protein structure. We focused on servers that are readily accessible to the community. Inspection of the information provided to CASP predictors was combined with some initial analysis and literature review to identify functions encoded within the refinement targets that would be interpretable using structure-based methods. This produced four enzymes (R1053, a PI3 kinase; R1056, a metalloprotease; R1057, a methyltransferase; R1067, an LD-transpeptidase) with catalytic sites potentially discoverable by structural motif matching in ProFunc 19 or CatsId 18. R1057, along with the non-catalytic R1068 were DNA-binding proteins, a function potentially discoverable using DNA_BIND 20 or BindUP 21. Finally, we identified three targets that contribute to protein-protein interactions and considered testing their performance in docking using ClusPro 22.
In order to be able to measure the impact of refinement we required, for at least one criterion, that the experimental structure give a positive prediction while the refinement target yield a negative result. Any positive impact of the refinement would then be evident in the function annotation emerging from the refined version. Unfortunately, only one of the four enzymes - R1057, an N4-cytosine methyltransferase - fulfilled these criteria.
Table 4 shows that refinement can make a significant difference to structure-based function annotation, albeit the picture is mixed and method-dependent. For example, six of the 20 refinements from the top four groups hit a methyltransferase catalytic site template in CastID in a way the unrefined target does not. Although it is important to note that the submitted structures often matched other templates with similar scores - the methyltransferase match was not necessarily top-scoring - depending on the other information available regarding a protein of interest (ref for non-homology methods) it might still be very relevant to flag a particular activity as a possibility, even among a list of candidate activities. By Profunc, the unrefined target already scores almost as well as the experimental structure but its score can be increased, sometimes significantly after refinement, although it must also be pointed out that the match may also be lost on refinement. Unlike CastID, when a methyltransferase hit emerged for a submission to ProFunc it was the only hit. For DNA binding, refinement typically improves the unrefined target score with DNAbind, in four cases taking it above the threshold for a positive prediction. However, the BindUP predictions remain negative for all refinements tested.
Table 4.
Catalytic site and DNA binding predictions for R1057 and R1068 targets, comparing results for the crystal structure, the refinement target and selected refined versions thereof. Included are the five models of the top four groups along with model_1 from the other six groups that were ranked in the top 10 for both targets. CatsID identifies structural matches to catalytic sites among all Protein Data Bank proteins; scores listed are for methyltransferase hits. Scores above 0.02 are an indication of correct assignment of catalytic function. No models surpassed this threshold for a methyltransferase hit, but scores for any methyltransferase hits are displayed (bold). It should be noted also that where a methyltransferase hit was recorded, other hits with unrelated catalytic sites also were observed. For ProFunc scores, the higher the score of an active site template match the greater the confidence in a hit: methyltransferase hit scores are again highlighted in bold. DNAbind predicts DNA-binding ability even from low-resolution, Cα-only protein models: proteins with scores above the 0.5313 threshold are predicted to bind DNA (bold). BindUP predicts nucleic acid binding function given the protein’s three-dimensional structure.
| R1057 |
R1068 |
||||||||
|---|---|---|---|---|---|---|---|---|---|
| GDT_HA | CatsID | ProFunc | DNAbind | BindUP | GDT_HA | DNAbind | BindUP | ||
| Crystal | - | 0.004 | 82.04 | 0.663 | YES | - | 0.991 | YES | |
| Refinement target | 44.11 | No hits | 81.14 | 0.476 | NO | 21.612 | 0.959 | YES | |
| FEIG-S refinements | model_1 | 75.10 | No hits | 0 | 0.535 | NO | 43.58 | 0.989 | YES |
| model_2 | 70.20 | No hits | 0 | 0.497 | NO | 38.13 | 0.989 | YES | |
| model_3 | 74.60 | No hits | 0 | 0.531 | NO | 38.41 | 0.989 | YES | |
| model_4 | 72.20 | No hits | 0 | 0.535 | NO | 40.36 | 0.991 | YES | |
| model_5 | 74.00 | No hits | 80.5 | 0.527 | NO | 42.60 | 0.990 | YES | |
| DellaCorteLab refinements | model_1 | 64.40 | No hits | 83.0 | 0.515 | NO | 43.30 | 0.989 | YES |
| model_2 | 66.40 | No hits | 0 | 0.509 | NO | 42.60 | 0.989 | YES | |
| model_3 | 66.10 | No hits | 87.0 | 0.529 | NO | 42.32 | 0.990 | YES | |
| model_4 | 66.10 | No hits | 83.0 | 0.506 | NO | 42.64 | 0.989 | YES | |
| model_5 | 66.20 | No hits | 81.1 | 0.547 | NO | 40.64 | 0.989 | YES | |
| FEIG refinements | model_1 | 71.60 | 0.005 | 0 | 0.068 | NO | 46.23 | 0.987 | YES |
| model_2 | 70.90 | No hits | 90.1 | 0.525 | NO | 44.55 | 0.989 | YES | |
| model_3 | 67.90 | No hits | 0 | 0.065 | NO | 44.13 | 0.990 | YES | |
| model_4 | 67.40 | 0.004 | 0 | 0.496 | NO | 43.85 | 0.988 | YES | |
| model_5 | 67.80 | 0.005 | 0 | 0.483 | NO | 36.87 | 0.986 | YES | |
| Baker refinements | model_1 | 70.90 | No hits | 83.0 | 0.511 | NO | 40.64 | 0.986 | YES |
| model_2 | 67.80 | 0.004 | 83.0 | 0.491 | NO | 40.92 | 0.985 | YES | |
| model_3 | 64.40 | 0.004 | 124.0 | 0.469 | NO | 32.82 | 0.978 | YES | |
| model_4 | 65.30 | 0.004 | 0 | 0.457 | NO | 32.26 | 0.986 | YES | |
| model_5 | 62.20 | No hits | 81.1 | 0.547 | NO | 32.68 | 0.989 | YES | |
Among the targets involved in protein-protein interactions only one ultimately proved suitable for us. In the case of T1045, one subunit of the Arabidopsis thaliana PEX4-PEX22 complex was chosen for refinement. However, even ClusPro docking of the two partners from the crystal structure did not identify the native interaction mode in first place. T1055, selected for refinement, was a single chain NMR structure of the C-terminal domain of the A20 processivity factor but the crystal structure of its known partner vaccinia virus E9 DNA polymerase was available in the PDB 31. Unfortunately, even with mutagenesis evidence implicating specific residues on each partner in the interaction 31, no plausible binding mode between the two structures was obtained.
The refinement targets that could be used were both chains of T1065 which are described by the submitters as two subunits of Serratia marcescens N4-cytosine methyltransferase (although our own unpublished analysis suggests they may be a toxin-antitoxin pairing). We did pairwise docking between crystal structures, unrefined targets and the model_1 refinements of the top 5 groups, looking at the top predicted binding model in each case. We defined the receptor as the larger T1065s1 and the ligand as T1065s2. As Table 5 and Supplementary Figure 4A show, the crystal structures can be docked by ClusPro to closely capture the native interaction. Replacing the crystal structure of the ligand with the refinement target still yields good results (Supplementary Figure 4B), but the refinement target version of the receptor is not successfully docked to the ligand crystal structure (Supplementary Figure 4C). Nevertheless, the pair of refinement targets dock well. The impact of refinement here is again mixed. Positively, refinement of the receptor structure prediction by three of the four groups tested improved the results significantly, giving native-like poses where the unrefined target did not (eg Supplementary Figure 4D). On the other hand, the good quality result between ligand crystal structure and receptor refinement target is lost upon any of the tested refinements of the latter.
Table 5.
Results obtained using ClusPro to dock the two subunits of target T1065. Different combinations of structures were tested using, for each subunit; the crystal structure, the structure provided to the groups as the refinement target, and the model_1 submitted by each of the top four refinement groups. These top predictions are indicated simply by the refinement group name in the Table. For each docking exercise, the ClusPro cluster size and lowest energy reported were recorded. Additionally, the top cluster was selected for further docking quality assessment, where the fraction of native contacts (Fnat), ligand RMSD (L-RMSD) and the interface RMSD (I-RMSD) were recorded and used to estimate the docking quality based on the CAPRI assessment protocol - see Materials and Methods and Supplementary Table 1.
| ‘Receptor’ (R1065s1) | ‘Ligand’ (R1065s2) | ClusPro Cluster Size | ClusPro Lowest Energy | Fnat | L-RMSD (Å) | I-RMSD (Å) | CAPRI Assessment |
|---|---|---|---|---|---|---|---|
| Crystal | Crystal | 126 | −878.6 | 0.7 | 2.39 | 3.11 | Medium |
| Crystal | Refinement target | 108 | −616.1 | 0.7 | 4.91 | 4.84 | Medium |
| Crystal | BAKER | 159 | −713.2 | 0.08 | 31.61 | 29.25 | Incorrect |
| Crystal | FEIG | 169 | −743.4 | 0.09 | 24.93 | 23.89 | Incorrect |
| Crystal | FEIG-S | 80 | −676.8 | 0.1 | 26.36 | 25.08 | Incorrect |
| Crystal | DellaCorteLab | 173 | −752.9 | 0.07 | 32.76 | 30.62 | Incorrect |
| Refinement target | Crystal | 119 | −574.2 | 0.13 | 24.37 | 22.79 | Incorrect |
| BAKER | Crystal | 99 | −591.9 | 0.09 | 31.59 | 28.41 | Incorrect |
| FEIG | Crystal | 152 | −629.1 | 0.84 | 1.82 | 1.89 | Medium |
| FEIG-S | Crystal | 150 | −630.5 | 0.84 | 3.78 | 3.08 | Medium |
| DellaCorteLab | Crystal | 108 | −535.5 | 0.62 | 22.83 | 6.06 | Medium |
| Refinement target | Refinement target | 215 | −640.4 | 0.47 | 9.61 | 9.1 | Acceptable |
| BAKER | BAKER | 113 | −650.3 | 0.28 | 15.84 | 13.79 | Incorrect |
| FEIG | FEIG | 146 | −590.9 | 0.1 | 25.4 | 24.04 | Incorrect |
| FEIG-S | FEIG-S | 127 | −623 | 0.1 | 34.52 | 31.73 | Incorrect |
| DellaCorteLab | DellaCorteLab | 123 | −627.4 | 0.08 | 26.91 | 25.69 | Incorrect |
4. Conclusions
As mentioned earlier, it is hard to compare CASP to CASP performance since the selection of targets is necessarily different in each case. Some measures of performance would also be influenced by the entry or withdrawal of particularly strong or weak groups. Nevertheless, CASP 14 refinement targets seem comparable to those of CASP13, in coordinate quality for example, albeit with a somewhat larger mean size. In terms of the proportion of models improved, performance is at best maintained compared to previous CASPs: certainly there have not been advances of the magnitude of those seen in the initial modelling as a result of the deployment of Deep Learning methods. Nevertheless, some evidence of progress was suggested by the comparison between the DellaCorteLab and FEIG groups submissions since the former employed a protocol largely corresponding to the FEIG group approach from CASP13. Although both did well this time, and are in the select number capable of beating the naïve predictor, FEIG and FEIG-S clearly did better, validating the innovations in extra sampling they introduced this time. Indeed, in their own paper, Feig and co-workers demonstrate the superiority of their latest protocol by applying CASP12 and CASP13 approaches to CASP14 targets 32. Cross-fertilisation between CASP categories is quite common: for example, a number of original predictors incorporate elements of refinement protocols into their modelling. The top-performing BAKER group illustrate the reverse here: their latest refinement protocol 33 incorporates Deep Learning, which has revolutionised protein structure prediction in recent years, using it to estimate errors and thereby guide the diversification and optimisation of refined derivatives of the refinement target. Also notable is the use of a neural network by the JLU_Comp_Struct_Bio 27 which is the best performing group for refinement of higher quality starting models with GDT_HA > 60.
The CASP organisers introduced two new features to the refinement challenge this time. Some targets were allowed an additional three weeks of time, with submissions at a six-week checkpoint in addition to the usual three. Though well-motivated by the compute-intense nature of many refinement protocols, the results were disappointing: the quality of the extended target refinements was just as likely to be worse than better, even among submissions from the best groups. Also new this year were ‘double-barrelled’ targets where groups were challenged to refine lower and higher quality predictions for the same target. The higher quality predictions were from a single group, later revealed to be AlphaFold 2. Despite containing regions differing from the experimental structure these proved to be essentially unimprovable by two orthogonal measures of protein quality. Digging deeper, we found that a majority of the structural differences to the reference experimental structure lay at crystal lattice interfaces. Bearing in mind the potential distortion introduced by formation of the crystal lattice, it seems possible that the failure to ‘improve’ the quality of these error regions in the AF2 models may simply reflect that the experimental reference structures are in non-natural conformations at these points. The code we developed to categorise error regions as lying at lattice or other interfaces may prove useful to future CASP refinement assessors for the selection of targets with uncomplicated and improvable errors.
Remembering that structure predictions are frequently used by biologists for interpretation or prediction of function, we looked at the impact of refinement on structure-based function annotation methods for catalytic sites, nucleic acid binding capacity and protein-protein docking. Although only a small number of refinement targets were suitable, and although the picture was mixed, it is clear that refinement can sometimes yield a correct structure-based function read-out for a refinement target that did not give a positive result. Importantly, the server FEIG-S was among the groups whose refinements behaved in this way suggesting that biologists should consider structure-based hypotheses from server-refined models in addition to analysing the original structure predictions. We also looked at the impact of refinement on the prospects for use of structure predictions in Molecular Replacement (elsewhere in this issue) where the picture was very strongly encouraging: we frequently observed success with a refined version where the original prediction failed.
Finally, in the post-AF2 era, it is relevant to consider whether and in what form the refinement category should persist in the CASP experiment. Clearly if all structures can be computationally predicted by readily available software with the same accuracy as they can be experimentally determined then there is no refinement to be done and the category dies. However, we are not yet in that position despite the remarkable performance of AF2 (reported elsewhere in this issue). Firstly, AF2 did produce some lower-quality models for which refinement would potentially be of use. Secondly, AF2 is not yet available to the community and we have clearly shown the benefits of refinement of others’ models. And finally, it is not yet clear that AF2 or any future packages inspired by it perform equally well on all molecular architectures of interest. Nevertheless, it is probably fair to say that the space available to refinement groups to innovate and have impact is diminishing as the latest deep learning-based methods, allied to the ongoing incorporation of refinement protocols into the original predictive pipelines, ramp up starting model quality and reduce the potential for meaningful refinement. Part of the future may be a reconfiguration of the refinement category away from single domain proteins towards more challenging multi-domain proteins or multi-chain assemblies. Another trend may be towards refining an initial prediction, not against a single, potentially unrepresentative structure, but against the experimental data. As noted elsewhere 32, MD-based methods may be particularly well-suited to refining against data representing an ensemble of states: future refinement exercises could therefore include efforts to produce ensembles that better explain the experimental data than the initial submitted structure(s).
Supplementary Material
ACKNOWLEDGMENTS
Support for this work was provided by Biotechnology and Biological Sciences Research Council (grant BB/S007105/1), CCP4, Diamond Light Source (Joint UoL-DLS PhD studentship to FSR) and the US National Institute of General Medical Sciences (NIGMS/NIH) grant GM100482 (AK).
The data that support the findings of this study are available from the corresponding author upon reasonable request.
References
- 1.MacCallum JL, Hua L, Schnieders MJ, Pande VS, Jacobson MP, Dill KA. Assessment of the protein-structure refinement category in CASP8. Proteins 2009;77 Suppl 9:66–80. [DOI] [PMC free article] [PubMed] [Google Scholar]
- 2.MacCallum JL, Perez A, Schnieders MJ, Hua L, Jacobson MP, Dill KA. Assessment of protein structure refinement in CASP9. Proteins 2011;79 Suppl 10:74–90. [DOI] [PMC free article] [PubMed] [Google Scholar]
- 3.Mirjalili V, Noyes K, Feig M. Physics-based protein structure refinement through multiple molecular dynamics trajectories and structure averaging. Proteins 2014;82 Suppl 2:196–207. [DOI] [PMC free article] [PubMed] [Google Scholar]
- 4.Terashi G, Kihara D. Protein structure model refinement in CASP12 using short and long molecular dynamics simulations in implicit solvent. Proteins 2018;86 Suppl 1:189–201. [DOI] [PMC free article] [PubMed] [Google Scholar]
- 5.Lee GR, Heo L, Seok C. Effective protein model structure refinement by loop modeling and overall relaxation. Proteins 2016;84 Suppl 1:293–301. [DOI] [PubMed] [Google Scholar]
- 6.Park H, DiMaio F, Baker D. CASP11 refinement experiments with ROSETTA. Proteins 2016;84 Suppl 1:314–322. [DOI] [PMC free article] [PubMed] [Google Scholar]
- 7.Kryshtafovych A, Schwede T, Topf M, Fidelis K, Moult J. Critical assessment of methods of protein structure prediction (CASP)-Round XIII. Proteins 2019;87:1011–1020. [DOI] [PMC free article] [PubMed] [Google Scholar]
- 8.Rigden DJ, ed. From Protein Structure to Function with Bioinformatics, Second Edition. Heidelberg, Germany: Springer Nature; 2017. [Google Scholar]
- 9.Bibby J, Keegan RM, Mayans O, Winn MD, Rigden DJ. AMPLE: a cluster-and-truncate approach to solve the crystal structures of small proteins using rapidly computed ab initio models. Acta Crystallogr D Biol Crystallogr 2012;68:1622–1631. [DOI] [PubMed] [Google Scholar]
- 10.Qian B, Raman S, Das R, Bradley P, McCoy AJ, Read RJ, Baker D. High-resolution structure prediction and the crystallographic phase problem. Nature 2007;450:259–264. [DOI] [PMC free article] [PubMed] [Google Scholar]
- 11.Millán C, Keegan RM, Pereira J, Sammito M, Simpkin AJ, McCoy AJ, Lupas AN, Hartmann MD, Rigden DJ, Read RJ. Utility of CASP14 models for molecular replacement. Proteins: Structure, Function, and Bioinformatics 2021. [DOI] [PMC free article] [PubMed] [Google Scholar]
- 12.Hovan L, Oleinikovas V, Yalinca H, Kryshtafovych A, Saladino G, Gervasio FL. Assessment of the model refinement category in CASP12. Proteins 2018;86 Suppl 1:152–167. [DOI] [PMC free article] [PubMed] [Google Scholar]
- 13.Zemla A LGA: A method for finding 3D similarities in protein structures. Nucleic Acids Res 2003;31:3370–3374. [DOI] [PMC free article] [PubMed] [Google Scholar]
- 14.Kryshtafovych A, Monastyrskyy B, Fidelis K. CASP prediction center infrastructure and evaluation measures in CASP10 and CASP ROLL. Proteins 2014;82 Suppl 2:7–13. [DOI] [PMC free article] [PubMed] [Google Scholar]
- 15.Cong Q, Kinch LN, Pei J, Shi S, Grishin VN, Li W, Grishin NV. An automatic method for CASP9 free modeling structure prediction assessment. Bioinformatics 2011;27:3371–3378. [DOI] [PMC free article] [PubMed] [Google Scholar]
- 16.Chen VB, Arendall WB 3rd, Headd JJ, Keedy DA, Immormino RM, Kapral GJ, Murray LW, Richardson JS, Richardson DC. MolProbity: all-atom structure validation for macromolecular crystallography. Acta Crystallogr D Biol Crystallogr 2010;66:12–21. [DOI] [PMC free article] [PubMed] [Google Scholar]
- 17.Furnham N, Holliday GL, de Beer TA, Jacobsen JO, Pearson WR, Thornton JM. The Catalytic Site Atlas 2.0: cataloging catalytic sites and residues identified in enzymes. Nucleic Acids Res 2014;42:D485–9. [DOI] [PMC free article] [PubMed] [Google Scholar]
- 18.Kirshner DA, Nilmeier JP, Lightstone FC. Catalytic site identification--a web server to identify catalytic site structural matches throughout PDB. Nucleic Acids Res 2013;41:W256–65. [DOI] [PMC free article] [PubMed] [Google Scholar]
- 19.Laskowski RA, Watson JD, Thornton JM. ProFunc: a server for predicting protein function from 3D structure. Nucleic Acids Res 2005;33:W89–93. [DOI] [PMC free article] [PubMed] [Google Scholar]
- 20.Szilagyi A, Skolnick J. Efficient prediction of nucleic acid binding function from low-resolution protein structures. J Mol Biol 2006;358:922–933. [DOI] [PubMed] [Google Scholar]
- 21.Paz I, Kligun E, Bengad B, Mandel-Gutfreund Y. BindUP: a web server for non-homology-based prediction of DNA and RNA binding proteins. Nucleic Acids Res 2016;44:W568–74. [DOI] [PMC free article] [PubMed] [Google Scholar]
- 22.Kozakov D, Hall DR, Xia B, Porter KA, Padhorny D, Yueh C, Beglov D, Vajda S. The ClusPro web server for protein-protein docking. Nat Protoc 2017;12:255–278. [DOI] [PMC free article] [PubMed] [Google Scholar]
- 23.Agrawal P, Singh H, Srivastava HK, Singh S, Kishore G, Raghava GPS. Benchmarking of different molecular docking methods for protein-peptide docking. BMC Bioinformatics 2019;19:426-018-2449-y. [DOI] [PMC free article] [PubMed] [Google Scholar]
- 24.Lensink MF, Mendez R, Wodak SJ. Docking and scoring protein complexes: CAPRI 3rd Edition. Proteins 2007;69:704–718. [DOI] [PubMed] [Google Scholar]
- 25.Sali A, Blundell TL. Comparative protein modelling by satisfaction of spatial restraints. J Mol Biol 1993;234:779–815. [DOI] [PubMed] [Google Scholar]
- 26.Soding J Protein homology detection by HMM-HMM comparison. Bioinformatics 2005;21:951–960. [DOI] [PubMed] [Google Scholar]
- 27.Long S, Tian P. A simple neural network implementation of generalized solvation free energy for assessment of protein structural models. RSC Advances 2019;9:36227–36233. [DOI] [PMC free article] [PubMed] [Google Scholar]
- 28.Cao C, Tian P. End to end differentiable protein structure refinement. bioRXiv 2020. [Google Scholar]
- 29.Perez A, Yang Z, Bahar I, Dill KA, MacCallum JL. FlexE: Using elastic network models to compare models of protein structure. J Chem Theory Comput 2012;8:3985–3991. [DOI] [PMC free article] [PubMed] [Google Scholar]
- 30.Oeffner RD, Bunkoczi G, McCoy AJ, Read RJ. Improved estimates of coordinate error for molecular replacement. Acta Crystallogr D Biol Crystallogr 2013;69:2209–2215. [DOI] [PMC free article] [PubMed] [Google Scholar]
- 31.Tarbouriech N, Ducournau C, Hutin S, Mas PJ, Man P, Forest E, Hart DJ, Peyrefitte CN, Burmeister WP, Iseni F. The vaccinia virus DNA polymerase structure provides insights into the mode of processivity factor binding. Nat Commun 2017;8:1455-017-01542-z. [DOI] [PMC free article] [PubMed] [Google Scholar]
- 32.Heo L, Janson G, Feig M. Physics-Based Protein Structure Refinement in the Era of Artificial Intelligence. Proteins: Structure, Function, and Bioinformatics 2021. [DOI] [PMC free article] [PubMed] [Google Scholar]
- 33.Hiranuma N, Park H, Baek M, Anishchenko I, Dauparas J, Baker D. Improved protein structure refinement guided by deep learning based accuracy estimation. Nat Commun 2021;12:1340-021-21511-x. [DOI] [PMC free article] [PubMed] [Google Scholar]
Associated Data
This section collects any data citations, data availability statements, or supplementary materials included in this article.


