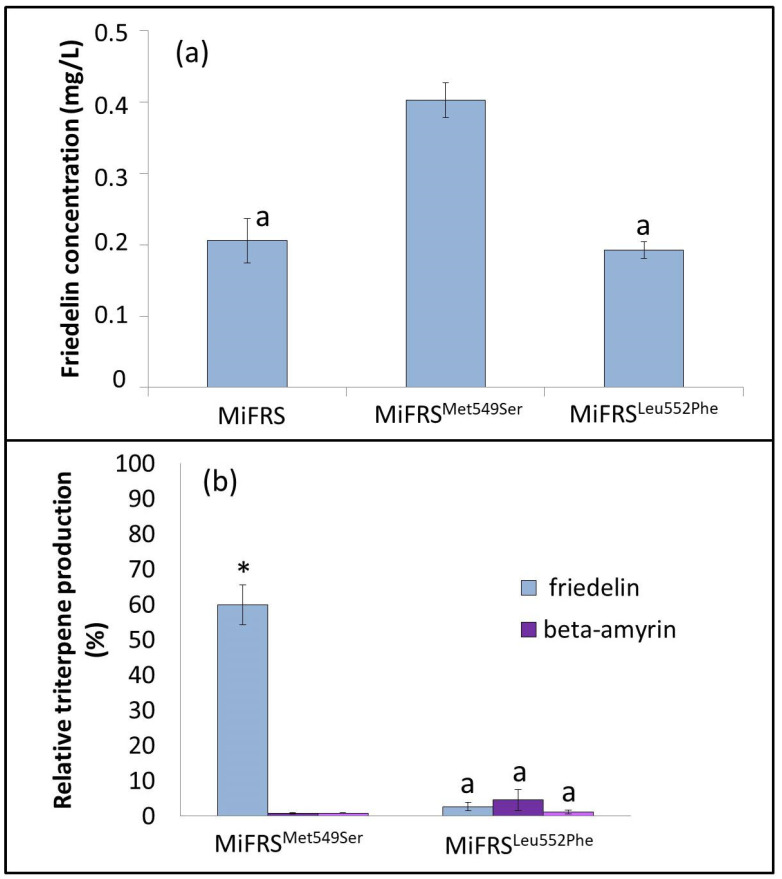
Figure 7.
Concentration of friedelin in fractions extracted from S. cerevisiae yeast, expressing MiFRS mutants. (a) Concentration of friedelin is expressed in mg/L of culture medium. (Complementary Data in Supplementary Material, Table S4). (b) Proportion between friedelin, β-amyrin and α-amyrin produced in the mutants of MiFRS. A statistically significant difference is indicated by one asterisk (*) on the top of the bar, after analysis of variance. Bars with the same letter denote an absence of a statistically significant difference between each other on the quantification friedelin in the respective season (p > 0.05; one-way ANOVA with Tukey’s test).

