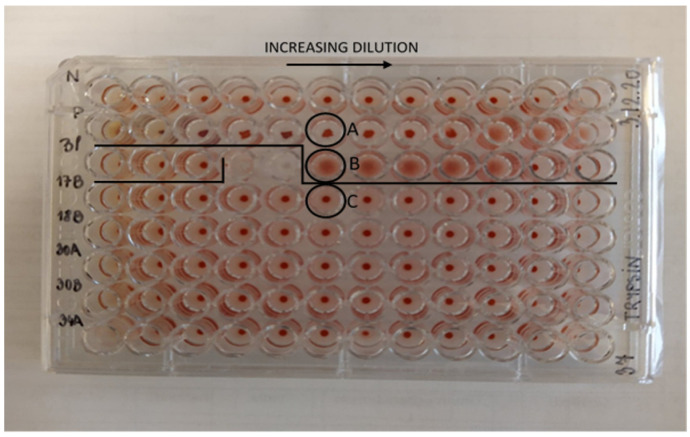
Figure 2.
A representative plate of a hemagglutination assay. (N) negative control, (P) positive control, (Bl) blank, numbers (17, 18, 30, 34) represent samples. (A) Shows an irregular shaped pellet from the positive control, (B) shows hemagglutination in the positive control, and (C) shows a lack of hemagglutination in a sample.

