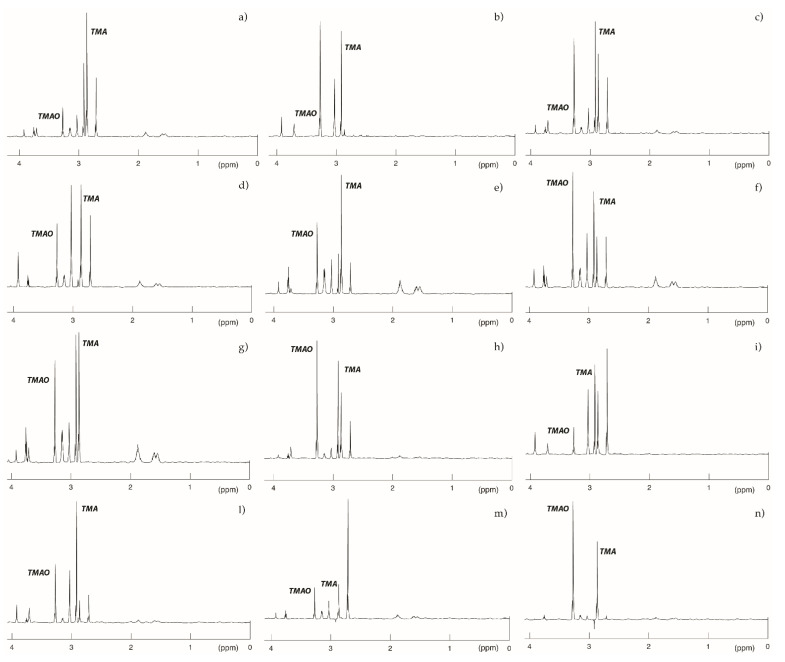
Figure 5.
500 MHz 1H spectra of patients included in the study. Here, are represented the spectra resulting from 1H NMR spectroscopy of the urine collected from patients showing a unique FMO3 variant haplotype. A healthy subject should present no peak for TMA and an intermediate peak for TMAO (not shown). Obtained results mostly confirmed genotyping and modelling analyses. (a) Patient 3; (b) Patient 10; (c) Patient 2; (d) Patient 9; (e) Patient 11; (f) Patient 6; (g) Patient 1; (h) Patient 8; (i) Patient 2; (l) Patient 4; (m) Patient 12; and (n) Patient 7. Metabolites peaks are assigned as follows: Trimethylamine-N-oxide (TMAO): 3.27 ppm; Creatinine (Cr): 3.06 ppm; Creatine (Cn): 3.04 ppm; Trimethylamine (TMA): 2.92 ppm; Dimethylamine (DMA): 2.73 ppm; and Citrulline (cit): 1.62 and 1.92 ppm.

