

Abstract
Background
In South-east Asia, Dipterocarpoideae is predominant in most mature forest communities, comprising around 20% of all trees. As large quantity and high quality wood are produced in many species, Dipterocarpoideae plants are the most important and valuable source in the timber market. The d-borneol is one of the essential oil components from Dipterocarpoideae (for example, Dryobalanops aromatica or Dipterocarpus turbinatus) and it is also an important traditional Chinese medicine (TCM) formulation known as “Bingpian” in Chinese, with antibacterial, analgesic and anti-inflammatory effects and can enhance anticancer efficiency.
Methods
In this study, we analyzed 20 chloroplast (cp) genomes characteristics of Dipterocarpoideae, including eleven newly reported genomes and nine cp genomes previously published elsewhere, then we explored the chloroplast genomic features, inverted repeats contraction and expansion, codon usage, amino acid frequency, the repeat sequences and selective pressure analyses. At last, we constructed phylogenetic relationships of Dipterocarpoideae and found the potential barcoding loci.
Results
The cp genome of this subfamily has a typical quadripartite structure and maintains a high degree of consistency among species. There were slightly more tandem repeats in cp genomes of Dipterocarpus and Vatica, and the psbH gene was subjected to positive selection in the common ancestor of all the 20 species of Dipterocarpoideae compared with three outgroups. Phylogenetic tree showed that genus Shorea was not a monophyletic group, some Shorea species and genus Parashorea are placed in one clade. In addition, the rpoC2 gene can be used as a potential marker to achieve accurate and rapid species identification in subfamily Dipterocarpoideae.
Conclusions
Dipterocarpoideae had similar cp genomic features and psbM, rbcL, psbH may function in the growth of Dipterocarpoideae. Phylogenetic analysis suggested new taxon treatment is needed for this subfamily indentification. In addition, rpoC2 is potential to be a barcoding gene to TCM distinguish.
Supplementary Information
The online version contains supplementary material available at 10.1186/s13020-021-00538-8.
Keywords: Dipterocarpoideae, Chloroplast genomes, Comparative genomics, Selected selection, Phylogenetics, DNA barcoding
Background
Dipterocarpaceae is a small eudicot family with many giant plants, it is the symbol of South-east Asian tropical rain forests and many seasonally dry forests [1]. This family includes two subfamilies, Monotoideae and Dipterocarpoideae. Dipterocarpoideae is the larger one with 470–650 species in 13 genera [2, 3]. In South-east Asia, the dominance of Dipterocarpoideae is evident in most mature forest communities, comprising around 20% of all trees [4, 5]. Many members of this subfamily are typically 40-70 m tall, with some plants reaching as high as 85 m [6]. As large quantity and high quality wood are produced in many species of Dipterocarpoideae, they are the most important and valuable source in the timber market [7, 8]. The d-borneol is one of the essential oil components from Dipterocarpoideae (for example, Dryobalanops aromatica or Dipterocarpus turbinatus) [9, 10]. Borneol is also an important traditional Chinese medicine (TCM) formulation known as “Bingpian” in Chinese, with antibacterial [11], analgesic and anti-inflammatory effects [12] and can enhance anticancer efficiency [13]. Thus, borneol has been widely used in the fields of medicine, pesticide and chemical industry [14]. This TCM has been recorded in Newly Revised Canon of Materia Medica (Xinxiu Bencao) for more than 1300 years. Due to the medicinal and economic values of Dipterocarpoideae, the species have been the targets of woodcutting for long history. Some species such as Parashorea chinensis and D. aromatica even become endangered because of the over-harvesting [15, 16]. Although Dipterocapoideae is important to forest ecology, conservation and medicine, little is known about the genetics of those species. The classifications of Dipterocarpoideae have been reported before, while delineation of genus Parashorea and Shorea still remains controversial, due to the difficulty in identifying these plants leads to an uneven quality of borneol medicinal materials. Chloroplast (cp) genome information will prove essential to solve this problem. Recently, the whole cp genomes of nine species in Dipterocarpoideae were sequenced and analyzed [17, 18]. Here we sequenced, assembled and annotated the cp genomes of eleven species in four genera with the highest species richness in Dipterocarpoideae (Hopea mollissima, Hopea odorata, Shorea henryana, Shorea roxburghii, Shorea leprosula, Dipterocarpus gracilis, Dipterocarpus alatus, Dipterocarpus intricatus, Vatica xishuangbannaensis, Vatica odorata, Vatica rassak). Further, we performed a comprehensive evolutionary analysis of the cp genomes of 20 species from Dipterocapoideae and identified barcoding loci that could be used for species identification.
Materials and methods
Sample collection, DNA extraction, and sequencing
The fresh and healthy leaves of eleven species (Hopea mollissima, Hopea odorata, Shorea henryana, Shorea roxburghii, Shorea leprosula, Dipterocarpus gracilis, Dipterocarpus alatus, Dipterocarpus intricatus, Vatica xishuangbannaensis, Vatica odorata, Vatica rassak) were collected from the Xishuangbanna Tropical Botanical Garden, Chinese Academy of Sciences, (101°25′ E, 21°41′ N) and were immediately quick-frozen in liquid nitrogen. The total genomic DNA was extracted from leaf tissues with a modified Cetyl Trimethyl Ammonium Bromide (CTAB) method [19]. All genome DNA were sequenced with an Illumina NovaSeq 6000 platform by Biomarker Technologies, Inc (Beijing, China). The clean reads were more than 5,000 x coverage of each whole cp genome.
Genome assembly and annotations
We used Getorganelle v1.7.1 [20] and NOVOPlasty v4.2 [21] to assemble chloroplast genome respectively, and selected the more complete result as the final genome. Five cp genomes were assembled using Getorganelle v1.7.1 (H. mollissima, D. gracilis, D. alatus, D. intricatus, V. odorata) and other six species cp genome using NOVOPlasty v4.2 (H. odorata, S. henryana, S. roxburghii, S. leprosula, V. xishuangbannaensis, V. rassak). The contigs were examined based on the complete chloroplast sequence of D. turbinatus (GenBank Accession Number: NC_046842) using the “Map to Reference” function of Genious Prime 2021.0.3 (https://www.geneious.com). We modified the relative position and direction of each contig. Then, the reads were applied to polish the assembled contigs using Nextpolish [22] to fill the gap. The newly assembled chloroplast genomes were annotated using Plastid Genome Annotator (PGA) software [23] with the cp genome of D. turbinatus as reference, whereas the tRNA genes were further verified by ARAGORN v1.2.38 [24] and tRNAscan-SE v2.0.7 [25], and then checked manually. Fully annotated plastomes of circular diagram were drawn by OrganellarGenomeDRAW (OGDRAW) [26].
Repeat sequences were detected using Tandem Repeats Finder (TRF) version 4.09 [27] and RepeatMasker version 1.317 (http://www.repeatmasker.org) with default parameters. The Perl script auto_repeat.pl from Zhouheling (zhouheling@genomics.org.cn) was used to analyze four types of Transposable Elements -DNA transposons, LINE (long interspersed nuclear elements), SINE (short interspersed nuclear elements) and LTR (long terminal repeats) in the chloroplast genomes of Dipterocarpoideae species.
Comparative analyses
To investigate the divergence in the chloroplast genome, the identity across the whole complete cp genomes were visualized using the shuffle-LAGAN program of mVISTA v2.0 program [28] for the 23 species, with the H. mollissima genome as the reference. To detect the variation in the LSC/IR/SSC boundaries of Dipterocarpoideae chloroplast genomes, all 20 chloroplast genomes of Dipterocarpoideae species were compared by drawing in Adobe Illustrator CC2019 (https://adobe.com/products/illustrator). Codon usage in these genes was assessed using the program codonW [29]. Six values were used to estimate the extent of bias toward codons: the codon adaptation index (CAI), codon bias index (CBI), frequency of optimal codons (Fop), the effective number of codons (ENc), GC content of synonymous third codons positions (GC3s) and the relative synonymous codon usage values (RSCU).
Species pairwise Ka/Ks ratios and positive selection analysis
Pairwise Ka/Ks ratios of all species were calculated using the concatenated 50 single-copy genes alignments with KaKs Calculator [30]. Positive selections in Dipterocarpoideae were tested based on a species tree we built. PRANK v170427 [31] was used to perform multiple alignments for the protein-coding DNA sequences within each single gene. The alignments of each dataset were then fed into the Codeml program in the PAML package [32] to identify positively selected genes. Chi-square test p value < 0.05 is positive.
Phylogenetic inference
We downloaded 12 published chloroplast genome sequences (three as the outgroup taxa) from Genbank that were included in the analyses to perform the phylogenetic reconstruction. Firstly, all single-copy genes were extracted from 23 taxa, and alignments of each gene were generated and trimmed. Secondly, these alignments were concatenated which were used for phylogenetic analysis. Finally, phylogenetic trees were constructed using Bayesian analysis (BI) methods with MrBayes v3.2.2 [33], Maximum likelihood (ML) method with PhyML v3.0 [34] and Neighbour-joining (NJ) method with TreeBeST v1.9.2 [35]. The supporting branches were assessed with 100 rapid bootstrapping replicates.
p-distance calculation
To screen for rapidly evolving regions of some marker genes, we aligned the target genes by MUSCLE [36] after the annotation of 20 cp genomes of Dipterocarpoideae species. The FASTA format file was then transformed into mega format by MEGA7 [37]. Estimation of sequence divergence was expressed as the p-distance quantification using the Kimura 2-parameter model [38].
Results
Comparison among chloroplast genomic features in Dipterocarpoideae
The chloroplast genome size of V. xishuangbannaensis (151,011 bp) was found to be the smallest and S. leprosula (152,100 bp) was found to be the largest (Fig. 1, Additional file 1: Fig. S1). The lengths of LSC, SSC, and IR of the 11 species are also shown in Table 1. In these species we found 110–111 unique genes including 78–79 protein coding genes, four rRNA genes, and 28 tRNA genes (Tables 1, 2).
Fig. 1.

Gene map of S. leprosula chloroplast genomes. Genes inside the circle are transcribed clockwise, genes outside are transcribed counter-clockwise. Genes are color-coded to indicate functional groups. The dark gray area in the inner circle corresponds to guanine-cytosine (GC) content while the light gray corresponds to the adenine-thymine (AT) content of the genome. The small (SSC) and large (LSC) single-copy regions and inverted repeat (IRa and IRb) regions are noted in the inner circle
Table 1.
Characteristics of the chloroplast genomes of eleven Dipterocarpoideae species
| Taxon | Size (bp) | LSC length (bp) | SSC length (bp) | IR length (bp) | GC conten t (%) | |||
|---|---|---|---|---|---|---|---|---|
| Total | LSC | SSC | IR | |||||
| D .gracilis | 152,015 | 83,302 | 20,237 | 24,238 | 37.2 | 35.2 | 31.5 | 43.0 |
| D. alatus | 151,638 | 83,101 | 20,199 | 24,169 | 37.3 | 35.3 | 31.7 | 43.0 |
| D. intricatus | 151,911 | 83,169 | 20,310 | 24,216 | 37.2 | 35.2 | 31.5 | 43.0 |
| H. mollissima | 151,497 | 84,281 | 19,702 | 23,757 | 37.4 | 35.3 | 31.9 | 43.3 |
| H. odorata | 151,745 | 84,529 | 19,678 | 23,769 | 37.3 | 35.3 | 31.9 | 43.3 |
| S. leprosula | 152,100 | 84,226 | 19,940 | 23,967 | 37.2 | 35.2 | 31.6 | 43.1 |
| S. roxburghii | 151,795 | 84,406 | 19,833 | 23,778 | 37.2 | 35.2 | 31.6 | 43.2 |
| S. henryana | 151,685 | 84,144 | 19,865 | 23,838 | 37.4 | 35.3 | 31.8 | 43.2 |
| V. xishuangbannaensis | 151,011 | 83,210 | 20,029 | 23,886 | 37.2 | 35.2 | 31.3 | 43.2 |
| V. odorata | 151,493 | 83,532 | 20,067 | 23,947 | 37.2 | 35.2 | 31.3 | 43.1 |
| V. rassak | 151,394 | 83,380 | 20,204 | 23,905 | 37.2 | 35.2 | 31.3 | 43.1 |
Table 2.
Genes difference of the chloroplast genomes of eleven Dipterocarpoideae species
| Taxon | Number of genes | Protein-coding genes | rRNA genes | tRNA genes | Genes content difference | |
|---|---|---|---|---|---|---|
| rps16 | ycf15 | |||||
| D .gracilis | 110 | 78 | 4 | 28 | N | Y |
| D. alatus | 110 | 78 | 4 | 28 | N | Y |
| D. intricatus | 110 | 78 | 4 | 28 | N | Y |
| H. mollissima | 111 | 79 | 4 | 28 | Y | Y |
| H. odorata | 111 | 79 | 4 | 28 | Y | Y |
| S. leprosula | 111 | 79 | 4 | 28 | Y | Y |
| S. roxburghii | 111 | 79 | 4 | 28 | Y | Y |
| S. henryana | 110 | 78 | 4 | 28 | Y | N |
| V. xishuangbannaensis | 110 | 78 | 4 | 28 | Y | N |
| V. odorata | 111 | 79 | 4 | 28 | Y | Y |
| V. rassak | 111 | 79 | 4 | 28 | Y | Y |
Y The gene exists in this species; N The gene does not exist in this species
The mVISTA program was further used to align the cp genomes and visualize the pattern of sequence identity along the whole chloroplast genome of the 23 species including 20 Dipterocarpoideae species and three outgroups, using the annotation for H. mollissima as a reference (Fig. 2). Compared with the three outgroups, all 20 chloroplast genomes Dipterocarpoideae species displayed similar structure and gene order. The coding regions were more conserved than non-coding regions in all the species tested. In addition, LSC and SSC regions had a larger divergence than the IR regions, which has been observed in cp genome study of other taxa [39, 40]. In total, all 20 Dipterocarpoideae species showed conserved gene and gene organization.
Fig. 2.

The chloroplast genomes of all 23 different species were analyzed by shuffle-LAGAN program. The percentage of identity is shown on the vertical axis, which ranges from 50–100%, while the horizontal axis represents the position in the chloroplast genome. Each arrow indicates the annotated gene in the reference genome and the direction of its transcription. Genomic regions are color-coded into exons, tRNA, conserved non-coding sequences, and mRNA
The overall guanine-cytosine (GC) content was also very conserved, ranged only from 37.1% (P. chinensis) to 37.5% (H. dryobalanoides) in Dipterocarpoideae. GC content in the LSC, SSC and IR regions was 35.2–35.3%, 31.3–31.9% and 43.0–43.2%, respectively. IR regions showed high GC content compared to the LSC and SSC regions (Table 1; Fig. 3).
Fig. 3.
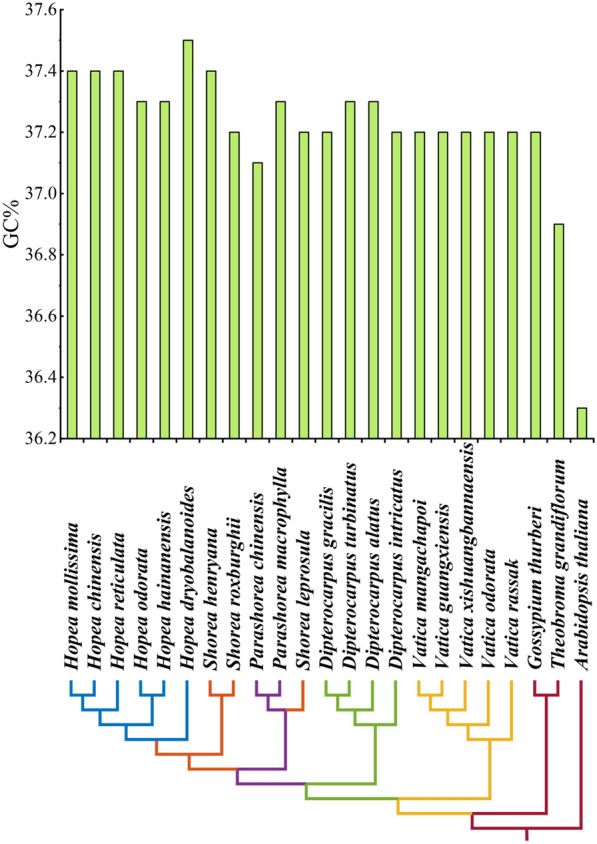
Changes in chloroplast GC content of all 23 species
Contraction and expansion of inverted repeats
The contraction and expansion of IR regions are the main contributors to the size variation in cp genomes and alter the evolutionary rate of the cp genome [41, 42]. We compared the IR boundaries in 20 Dipterocarpoideae species and found that the IR boundary regions varied slightly, especially IRb/SSC, SSC/IRa, and IRa/LSC (Fig. 4). At the junction of LSC and IRb regions, the rps19 gene was found completely covered by the LSC region in most species but extended into IRb region in only four Dipterocarpus species and H.hainanensis, while rpl2 was present completely in the IR regions. The analysis of the IRb/SSC junction showed the complete presence of ycf1 in the SSC region. The ndhF was found at the junction of IRa/SSC. The size of ndhF in IRa was ranged from 43 to 73 bp. The IR boundary characteristics of all other species were conserved, the contraction and expansion were not obvious in Dipterocarpoideae.
Fig. 4.

Comparison of the borders of the all regions among 20 chloroplast genomes of Dipterocarpoideae
Codon usage and amino acid frequency
To characterize the evolution of the codon usage in the Dipterocarpoideae species, we measured the codon usage bias of all protein-coding genes in cp genome of the eleven species (Tables 3 and 4, Additional file 2: Table S1). We calculated the codon usage bias through the relative synonymous codon usage (RSCU). In addition to the normal ATG start codon that encodes formyl-methionine, alternative start codons have also been found in Araceae species, including ACG, ATA, and GTG [43]. However, in our research, start codon was only ATG with no amino acid bias. While the arginine (Arg), leucine (Leu) and serine (Ser) were encoded by six codons with the highest preferences. Especially, the maximum (1.73–1.98) and minimum (0.43–0.51) values of RSCU were found in Arg (except H. odorata). In addition, the G/C at 3′end content values were 32.5% in H. odorata to 37.8% in V. odorata, which indicates that these genes preferred the codons ended with A/U. Other indicators that related to RSCU are relatively conserved among species, including the codon adaptation index (CAI), the codon usage index (CBI), frequency of optimal codons (Fop), the effective number of codons (ENc) and GC content of synonymous third codons positions (GC3s) .
Table 3.
The indexes of the codon usage bias of protein-coding genes of Dipterocarpoideae
| CAI | CBI | Fop | ENc | GC3s | |
|---|---|---|---|---|---|
| D.gracilis | 0.164 | − 0.079 | 0.369 | 55.47 | 0.359 |
| D. alatus | 0.155 | − 0.082 | 0.366 | 57.93 | 0.413 |
| D.intricatus | 0.158 | − 0.105 | 0.363 | 55.08 | 0.369 |
| H.mollissima | 0.162 | − 0.078 | 0.365 | 56.08 | 0.366 |
| H.odorata | 0.169 | − 0.082 | 0.369 | 53.64 | 0.329 |
| S.leprosula | 0.168 | − 0.087 | 0.365 | 53.99 | 0.332 |
| S.roxburghii | 0.166 | − 0.085 | 0.366 | 54.1 | 0.335 |
| S.henryana | 0.161 | − 0.079 | 0.364 | 56.05 | 0.365 |
| V. xishuangbannaensis | 0.157 | − 0.082 | 0.364 | 57.19 | 0.394 |
| V.odorata | 0.158 | − 0.096 | 0.362 | 56.41 | 0.378 |
| V. rassak | 0.163 | − 0.088 | 0.366 | 56.22 | 0.376 |
Table 4.
Codon content of 20 amino acids and stop codons in H.odorata
| H. odorata | |||||||
|---|---|---|---|---|---|---|---|
| AA | Codons | Numbers | RSCU | AA | Codons | Numbers | RSCU |
| Phe | UUU | 1187 | 1.25 | Ser | UCU | 787 | 1.63 |
| UUC | 707 | 0.75 | UCC | 486 | 1.01 | ||
| Leu | UUA | 763 | 1.61 | UCA | 545 | 1.13 | |
| UUG | 606 | 1.28 | UCG | 307 | 0.64 | ||
| CUU | 635 | 1.34 | Pro | CCU | 445 | 1.32 | |
| CUC | 255 | 0.54 | CCC | 302 | 0.9 | ||
| CUA | 365 | 0.77 | CCA | 377 | 1.12 | ||
| CUG | 226 | 0.48 | CCG | 225 | 0.67 | ||
| Ile | AUU | 1126 | 1.44 | Thr | ACU | 510 | 1.33 |
| AUC | 618 | 0.79 | ACC | 348 | 0.91 | ||
| AUA | 605 | 0.77 | ACA | 441 | 1.15 | ||
| Met | AUG | 593 | 1 | ACG | 236 | 0.61 | |
| Val | GUU | 571 | 1.44 | Ala | GCU | 606 | 1.61 |
| GUC | 235 | 0.59 | GCC | 264 | 0.7 | ||
| GUA | 520 | 1.31 | GCA | 390 | 1.04 | ||
| GUG | 259 | 0.65 | GCG | 246 | 0.65 | ||
| Tyr | UAU | 879 | 1.44 | Cys | UGU | 329 | 1.17 |
| UAC | 338 | 0.56 | UGC | 233 | 0.83 | ||
| TER | UAA | 292 | 0.94 | TER | UGA | 410 | 1.32 |
| UAG | 228 | 0.74 | Trp | UGG | 550 | 1 | |
| His | CAU | 567 | 1.46 | Arg | CGU | 365 | 0.97 |
| CAC | 211 | 0.54 | CGC | 180 | 0.48 | ||
| Gln | CAA | 772 | 1.47 | CGA | 472 | 1.26 | |
| CAG | 281 | 0.53 | CGG | 208 | 0.55 | ||
| Asn | AAU | 1006 | 1.42 | Ser | AGU | 481 | 1 |
| AAC | 410 | 0.58 | AGC | 286 | 0.59 | ||
| Lys | AAA | 1081 | 1.4 | Arg | AGA | 686 | 1.83 |
| AAG | 458 | 0.6 | AGG | 339 | 0.9 | ||
| Asp | GAU | 875 | 1.53 | Gly | GGU | 603 | 1.13 |
| GAC | 267 | 0.47 | GGC | 270 | 0.51 | ||
| Glu | GAA | 1086 | 1.39 | GGA | 802 | 1.5 | |
| GAG | 480 | 0.61 | GGG | 458 | 0.86 | ||
Repeat analyses
We used two methods (TandemRepeatFinder and RepeatMasker) to analyze the repetitive sequence in eleven Dipterocarpoideae cp genomes (Fig. 5). The results showed that there were slightly more tandem repeats in cp genomes of Dipterocarpoideae, while the cp genomes of Hopea and Shorea retained slightly more transposable factors (TE) than the tandem repeats. The numbers of four types TEs repeats in the eleven Dipterocarpoideae cp genomes were similar and conserved (Table 5) LTR (long terminal repeats) was the most abundant TE followed by DNA and LINE (long interspersed nuclear elements).
Fig. 5.
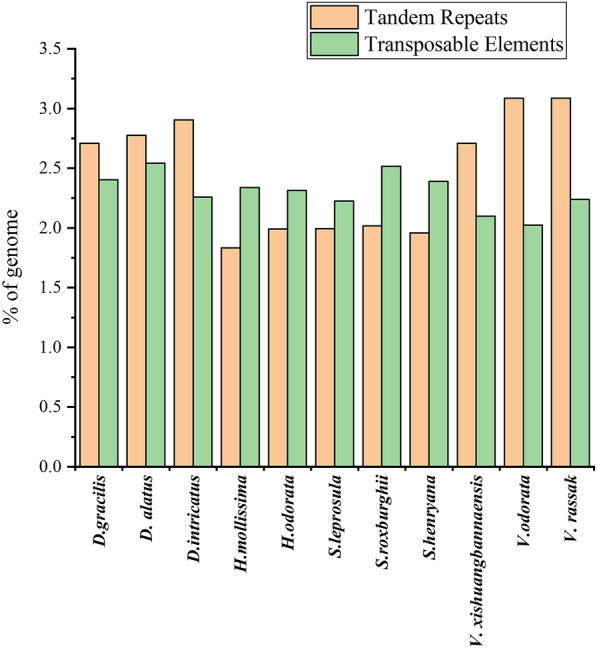
The repetitive sequence in eleven Dipterocarpoideae cp genomes used TandemRepeatFinder and RepeatMasker
Table 5.
Numbers of the TE repeat types in the eleven Dipterocarpoideae cp genomes
| Type length (bp) | DNA | LINE | SINE | LTR | Total |
|---|---|---|---|---|---|
| D. gracilis | 1125 | 150 | 0 | 2597 | 3872 |
| D. alatus | 1122 | 150 | 0 | 2581 | 3853 |
| D. intricatus | 1106 | 50 | 0 | 2494 | 3650 |
| H. mollissima | 1021 | 228 | 0 | 2499 | 3748 |
| H. odorata | 1012 | 228 | 0 | 2479 | 3719 |
| S. leprosula | 1019 | 147 | 0 | 2426 | 3592 |
| S. roxburghii | 1197 | 147 | 0 | 2701 | 4045 |
| S. henryana | 1191 | 147 | 0 | 2630 | 3849 |
| V. xishuangbannaensis | 1017 | 90 | 0 | 2086 | 3170 |
| V. odorata | 912 | 51 | 0 | 2376 | 3316 |
| V. rassak | 1083 | 39 | 0 | 2268 | 3390 |
Selective pressure analysis
The pairwise Ka/Ks ratios of all 23 species pair were calculated using the concatenated 50 single-copy genes alignments (Fig. 6). The ratios among species of Dipterocarpaceae were much higher than those involving the outgroups. The Ka/Ks ratios of D. gracilis-D. intricatus pair and D. gracilis-D. turbinatus pair were detected highes. The elevated Ka/Ks ratios are unlikely to be explained by changes in codon preference since we did not obtain obvious codon usage bias in Dipterocarpoideae species (Additional file 2: Table S1). So we consider that it may be an indication of an elevated mutation rate that caused the Ka/Ks ratios exceptionally high. We observed similar phenomenon in other research and they also inferred that high Ka/Ks ratios was caused by elevated mutation rate [44].
Fig. 6.

A comparison of pairwise Ka/Ks values of 23 species concatenated all single copy gene sequences
Since the short episodes of positive selection signal at of some sites may be masked by the long-term history of purification selection in the paired Ka/Ks test, we carried out positive selection test using the branch-site model implemented in PAML. The results showed that five genes (psbM, rbcL, rps7, rps2, psbH) have been positively selected (p < 0.05) at four branches (Figs. 7 and 8; Table 6). Among them, four genes had more than one positively selected site. The psbH gene at branch III which was ancestor of 20 Dipterocarpoideae species, with four positively selected sites, rps2 gene at branch IV possessed three sites under positive selection, followed by rps7 and rbcL at branch II and I had two positively selected sites, psbM gene at branch I possessed one positively selected site. The psbH gene was subjected to positive selection in the common ancestor of all the 20 species of Dipterocarpoideae (T5S, A48G, I57L, S71R) compared with three outgroups. And when we observed the alignment matrix of PSBM encoded by psbM, we found that the sixth amino acid was Alanine (A) in all Hopea species, but was Leucine (L) or Valine (V) in other species. In addition, the six Hopea species (H. mollissima, H. chinensis, H. reticulata, H. odorata, H. hainanensis, H. dryobalanoides) have specific mutations at two positions in rbcL gene (I375L, A398S).
Fig. 7.

Phylogenetic relationships of genus Dipterocarpoideae species with related species based on 50 single-copy genes. The topology is indicated with BI/ML/NJ bootstrap support values at each node. Roman scrip (I/II/III/IV) represent positively selected branches
Fig. 8.

Comparison of partial site under positive selection of different genes
Table 6.
Test of positively selected sites in species based on branch-site model
| Genename | Branch | p-value | BEB |
|---|---|---|---|
| psbM | I | 0.014 | 6:L:0.987* |
| rbcL | I | 0.047 | 375:L:0.765;398:S:0.655 |
| rps7 | II | 0.011 | 43:I:0.684;85:H:0.839 |
| psbH | III | 0.004 | 5:T:0.807;48:A:0.752;57:I:0.754;71:S:0.974* |
| rps2 | IV | 0.002 | 78:N:0.926;101:L:0.786;109:S:0.648 |
* The sites with a posterior probability of positive selection over 0.95
Phylogenetic relationships among Dipterocarpoideae
A total of 20 Dipterocarpoideae cp genomes were used to perform phylogenetic analysis. Gossypium thurberi, Theobroma grandiflorum and Arabidopsis thaliana were used as the outgroups. The phylogenetic tree was constructed using Bayesian analysis (BI), ML and NJ methods based on 50 single-copy genes (Fig. 7). All phylogenetic trees have the same topology. The bootstrap values of almost nodes were equal to 100. Each genus clustered together to form a single clade except Shorea in which most species clustered together while Shorea leprosula clustered with the Parashorea species which has been reported by Jacqueline Heckenhauer et al. [45].
Analysis of chloroplast barcoding loci
DNA barcoding is currently an effective and widely used tool that enables rapid and accurate identification of plant species. We found a number of potential marker genes (accD, matK, rbcL, rpoA, rpoB, rpoC1, rpoC2, ycf1 and ndhF) [46, 47] that may be used in identification of Dipterocarpoideae. Then, two criteria were satisfied for an ideal candidate DNA barcoding locus: (i) Sequences in all 20 species are divergent (ii) The phylogenetic trees based on the marker gene through the ML method with the same parameters are almost the same as the tree based on single-copy genes [46, 48]. The average p-distance values between 20 species of rpoC2 were 0.014-0.021 (Additional file 3: Table S2) which were larger than the average value in protein-coding genes of Magnoliaceae [49]. After filtering with these two criteria, only the rpoC2 gene was left, suggestiong that rpoC2 was a potential cp barcoding locus of Dipterocarpoideae (Additional file 3: Table S2).
Discussion
Our comparison of cp genome structure and content of all the 20 cp genomes in the same family showed that the gene content and genome organization are conserved across species in this family. There were some differences of rps16 and ycf15 among the species. In our eleven cp genomes, only three species lack rps16 (D. gracilis, D. alatus and D. intricatus) and ycf15 is absent in two species (S. henryana and V. xishuangbannaensis). The absence and pseudogene of the two genes have been also reported in other species [50, 51].
Codon usage changes have important contribution to cp genome evolution [52], and our results showed that codon usage bias was conserved across species in Dipterocarpoideae. In addition, most codons preferentially ended with A/U with RSCU≥1, suggesting that certain degenerate codon usage bias was a result of the adaptive evolution of the cp genome [43]. Besides, all ENc values are larger than 53.64 and CAI, CBI and Fop value are much less than one, indicating that the codon usage biases in all the eleven species are very low.
PAML results showed low rates of evolution for all protein-coding genes in the chloroplast genomes. Five genes (psbM, rbcL, rps7, rps2, psbH) at four branches were under positive selection which might be due to different types of stresses faced by these species, and all the positively selected sites are in the known domains of the proteins (except the T5S and S71R sites of psbH). Three of the five genes, psbM, rbcL and psbH, are involved in photosynthesis. Those three genes may function in the growth of all Dipterocarpoideae species in adaptation to a strongly illuminated environment [53].
The phylogenetic placement of Shorea is not clear. D. Gamage et al. [6] and S. Indrioko et al. [54] have built the phylogenetic tree used trnL-trnF spacer, trnL intron, matK regions marker genes and rbcL, petB, psbA, psaA, and trnL-trnF regions marker genes, respectively, to build the phylogenetic tree, which showed that genus Shorea was not a monophyletic group. This result was not exactly consistent with the traditional taxonomy based on plant morphology. Our study generated a consistent phylogeny with high confidence on all nodes with three different phylogenetic algorithms. And we confirmed the result that Shorea was not monophyletic group, suggesting a new taxonomy treatment is needed for this genus.
Identification of specific plant species is helpful for the herbal medicine since the morphology of plants in the same subfamily are very similar. D. turbinatus has been proven with medicinal value (antibacterial, analgesic, anti-inflammatory effects and enhance anticancer efficiency) in Dipterocarpoideae analyzed in our study, so it has become necessary to develop easy and safe methods for the identification and development of Dipterocarpoideae species. In our study, rpoC2 was a potential barcoding gene which used to be a maker to achieve accurate and rapid species identification in subfamily Dipterocarpoideae with important traditional Chinese medicine value. However, experimental verification was needed to confirm the function of the barcoding gene further.
Conclusions
Eleven complete chloroplast genomes of Dipterocarpoideae were reported for the first time by us. Analysis of the cp genome sequences of 20 Dipterocarpoideae species showed that they had very similar cp genomic structure, gene order, codon usage and repetitive sequence features. Positive selection analysis of the genes in chloroplast genome of this subfamily showed that psbH, psbM and rbcL may function in the growth of all Dipterocarpoideae species in adaptation to a strongly illuminated environment. Phylogenetic analysis based on all single-copy genes of chloroplast genome showed that genus Shorea was not a monophyletic group, suggesting a new taxon treatment is needed for this genus. In addition, we also recommended rpoC2 gene as a potential plant DNA barcoding locus to identify Dipterocarpoideae.
Supplementary Information
Additional file 1: Figure S1. Gene map of the Dipterocarpoideae chloroplast genomes.
Additional file 2: Table S1. Codon content of 20 amino acids and stop codons in Dipterocarpoideae.
Additional file 3: Table S2. Estimates of Evolutionary Divergence between Sequences.
Acknowledgements
We thank Dr. Juan He from Northwestern Polytechnical University for her suggestions and modifications to the manuscript. We also thank Dr Yaowu Xing, Mr Yunxue Xiao and Mr Qiyong Mu from Xishuangbanna Tropical Botanical Garden, Chinese Academy of Sciences, for their help on collecting samples.
Abbreviations
- TCM
Traditional Chinese medicine
- cp
Chloroplast
- LSC
Large single copy
- SSC
Small single copy
- IR
Inverted repeat
- rRNA
Ribosomal RNA
- tRNA
Transfer RNA
- LINE
Long interspersed nuclear elements
- SINE
Short interspersed nuclear elements
- LTR
Long terminal repeats
- CAI
The codon adaptation index
- CBI
Codon bias index
- Fop
Frequency of optimal codons
- ENc
The effective number of codons
- GC3s
GC content of synonymous third codons positions
- RSCU
The relative synonymous codon usage values
- TEs
Transposable elements
- BEB
Bayes Empirical Bayes
Authors’ contributions
CJ conceived the study and provided the funding, reviewed and revised the drafts of the paper. TZZ and ZP provided project ideas and overall process. YY analyzed data and wrote the manuscript, performed the genome assembly and annotation. ZH and ZTG analyzed the positive selection of all species. HYW and PYM analyzed data, completed the supplement of experimental data and review the final draft. All authors read and approved the final manuscript.
Funding
This work was supported by “the Thousand Talents Plan” to J.C. (5113190037); the Talents Team Construction Fund of Northwestern Polytechnical University (NWPU) (20GH020169); the Fundamental Research Funds for the Central Universities (3102019JC007).
Availability of data and materials
The datasets generated during the current study are available in the National Center for Biotechnology Information database (NCBI). www.ncbi.nlm.nih.gov/ [MZ160991–MZ160998, MZ379792, MZ397800–MZ397801].
Declarations
Ethics approval and consent to participate
Not applicable.
Consent for publication
Not applicable.
Competing interests
The authors declare that they have no competing interests.
Footnotes
Publisher’s Note
Springer Nature remains neutral with regard to jurisdictional claims in published maps and institutional affiliations.
Yang Yu, Yuwei Han and Yingmei Peng contributed equally to this work
Contributor Information
Yang Yu, Email: yuyang_axian@mail.nwpu.edu.cn.
Yuwei Han, Email: ywhan@nwpu.edu.cn.
Yingmei Peng, Email: pengyingmei@nwpu.edu.cn.
Zunzhe Tian, Email: zunzhetian@mail.nwpu.edu.cn.
Peng Zeng, Email: pengzeng@nwpu.edu.cn.
Hang Zong, Email: zonghangnb@163.com.
Tinggan Zhou, Email: tingganz@mail.nwpu.edu.cn.
Jing Cai, Email: jingcai@nwpu.edu.cn.
References
- 1.Brearley FQ, Banin LF, Saner P. The ecology of the Asian dipterocarps. Plant Ecol Divers. 2017;9(5-6):429–436. [Google Scholar]
- 2.Ashton PS. Dipterocarpaceae. vol. 9; 1982.
- 3.Dwiyanti FG, Kamiya K, Harada K. Phylogeographic structure of the commercially important tropical tree species, Dryobalanops aromatica gaertn. f. (Dipterocarpaceae) revealed by microsatellite markers. Reinwardtia. 2014;14(1):43–51. [Google Scholar]
- 4.Slik JWF, Poulsen AD, Ashton PS, Cannon CH, Eichhorn KAO, Kartawinata K, Lanniari I, Nagamasu H, Nakagawa M, Van Nieuwstadt MGL, et al. A floristic analysis of the lowland dipterocarp forests of Borneo. J Biogeogr. 2003;30(10):1517–1531. [Google Scholar]
- 5.Appanah S, Turnbull JM. A review of dipterocarps: Taxonomy, ecology, and silviculture. 1998.
- 6.Gamage DT, De Silva MP, Inomata N, Yamazaki T, Szmidt AE. Comprehensive molecular phylogeny of the sub-family Dipterocarpoideae (Dipterocarpaceae) based on chloroplast DNA sequences. Genes Genetic Syst. 2006;81(1):1–12. doi: 10.1266/ggs.81.1. [DOI] [PubMed] [Google Scholar]
- 7.Schulte A. Dipterocarp forest ecosystems: towards sustainable management: World Scientific; 1996.
- 8.Ådjers G, Hadengganan S, Kuusipalo J, Nuryanto K, Vesa L. Enrichment planting of dipterocarps in logged-over secondary forests: effect of width, direction and maintenance method of planting line on selected Shorea species. For Ecol Manag. 1995;73(1-3):259–270. [Google Scholar]
- 9.Aswandi A, Kholibrina C. New insights into Sumatran camphor (Dryobalanops aromatica Gaertn) management and conservation in western coast Sumatra, Indonesia. In: IOP Conference Series: Earth and Environmental Science. 2021. IOP Publishing. p. 012061.
- 10.Horváthová E, Slameňová D, Maršálková L, Šramková M, Wsólová L. Effects of borneol on the level of DNA damage induced in primary rat hepatocytes and testicular cells by hydrogen peroxide. Food Chem Toxicol. 2009;47(6):1318–1323. doi: 10.1016/j.fct.2009.03.002. [DOI] [PubMed] [Google Scholar]
- 11.Yang L, Zhan C, Huang X, Hong L, Fang L, Wang W, Su J. Durable antibacterial cotton fabrics based on natural borneol-derived anti‐MRSA agents. Adv Healthcare Mater. 2020;9(11):2000186. doi: 10.1002/adhm.202000186. [DOI] [PubMed] [Google Scholar]
- 12.Ji J, Zhang R, Li H, Zhu J, Pan Y, Guo Q. Analgesic and anti-inflammatory effects and mechanism of action of borneol on photodynamic therapy of acne. Environ Toxicol Pharmacol. 2020;75:103329. doi: 10.1016/j.etap.2020.103329. [DOI] [PubMed] [Google Scholar]
- 13.Cao W-q, Li Y, Hou Y-j, Yang M-x, Fu X-q, Zhao B-s. Enhanced anticancer efficiency of doxorubicin against human glioma by natural borneol through triggering ROS-mediated signal. Biomed Pharmacother. 2019;118:109261. doi: 10.1016/j.biopha.2019.109261. [DOI] [PubMed] [Google Scholar]
- 14.Dong Z, Zhao Y, Chen J, Chang M, Wang X, Jin Q, Wang X. Enzymatic Lipophilization of d-Borneol Extracted from Cinnamomum camphora chvar. Borneol Seed. 2021;111:801. [Google Scholar]
- 15.van der Velden N, Slik JF, Hu Y-H, Lan G, Lin L, Deng X, Poorter L. Monodominance of Parashorea chinensis on fertile soils in a Chinese tropical rain forest. J Trop Ecol. 2014;232:311–322. [Google Scholar]
- 16.Li N, Su NC, Qiu BF, Zhong YD: Research on the Machining Properties of Parashorea chinensis Wood for Engineering. In: Advanced Materials Research: 2013. Trans Tech Publ: 78–82.
- 17.Cvetković T, Hinsinger DD, Strijk JS. Exploring evolution and diversity of Chinese Dipterocarpaceae using next-generation sequencing. Sci Rep. 2019;9(1):1–11. doi: 10.1038/s41598-019-48240-y. [DOI] [PMC free article] [PubMed] [Google Scholar]
- 18.Zhu X-F, Sun Y. The complete chloroplast genome of the endangered tree Parashorea chinensis (Dipterocarpaceae) Mitochondrial DNA Part B. 2019;4(1):1163–1164. [Google Scholar]
- 19.Porebski S, Bailey LG, Baum BR. Modification of a CTAB DNA extraction protocol for plants containing high polysaccharide and polyphenol components. Plant Mol Biol Reporter. 1997;15(1):8–15. [Google Scholar]
- 20.Jin J-J, Yu W-B, Yang J-B, Song Y, dePamphilis CW, Yi T-S, Li D-Z. GetOrganelle: a fast and versatile toolkit for accurate de novo assembly of organelle genomes. Genome Biol. 2020;21(1):241. doi: 10.1186/s13059-020-02154-5. [DOI] [PMC free article] [PubMed] [Google Scholar]
- 21.Dierckxsens N, Mardulyn P, Smits G. NOVOPlasty: de novo assembly of organelle genomes from whole genome data. Nucleic Acids Res. 2016;45(4):e18-e18. doi: 10.1093/nar/gkw955. [DOI] [PMC free article] [PubMed] [Google Scholar]
- 22.Hu J, Fan J, Sun Z, Liu S. NextPolish: a fast and efficient genome polishing tool for long-read assembly. Bioinformatics. 2019;36(7):2253–2255. doi: 10.1093/bioinformatics/btz891. [DOI] [PubMed] [Google Scholar]
- 23.Qu X-J, Moore MJ, Li D-Z, Yi T-S. PGA: a software package for rapid, accurate, and flexible batch annotation of plastomes. Plant Methods. 2019;15(1):50. doi: 10.1186/s13007-019-0435-7. [DOI] [PMC free article] [PubMed] [Google Scholar]
- 24.Laslett D, Canback B. ARAGORN, a program to detect tRNA genes and tmRNA genes in nucleotide sequences. Nucleic acids Res. 2004;32(1):11–16. doi: 10.1093/nar/gkh152. [DOI] [PMC free article] [PubMed] [Google Scholar]
- 25.Lowe TM, Chan PP. tRNAscan-SE On-line: integrating search and context for analysis of transfer RNA genes. Nucleic Acids Res. 2016;44(W1):W54-W57. doi: 10.1093/nar/gkw413. [DOI] [PMC free article] [PubMed] [Google Scholar]
- 26.Greiner S, Lehwark P, Bock R. OrganellarGenomeDRAW (OGDRAW) version 1.3.1: expanded toolkit for the graphical visualization of organellar genomes. Nucleic Acids Res. 2019;47(W1):W59-W64. doi: 10.1093/nar/gkz238. [DOI] [PMC free article] [PubMed] [Google Scholar]
- 27.Benson G. Tandem repeats finder: a program to analyze DNA sequences. Nucleic Acids Res. 1999;27(2):573–580. doi: 10.1093/nar/27.2.573. [DOI] [PMC free article] [PubMed] [Google Scholar]
- 28.Brudno M, Malde S, Poliakov A, Do CB, Couronne O, Dubchak I, Batzoglou S. Glocal alignment: finding rearrangements during alignment. Bioinformatics. 2003;19(suppl_1):i54-i62. doi: 10.1093/bioinformatics/btg1005. [DOI] [PubMed] [Google Scholar]
- 29.Lin D, Li L, Xie T, Yin Q, Saksena N, Wu R, Li W, Dai G, Ma J, Zhou X, et al. Codon usage variation of Zika virus: The potential roles of NS2B and NS4A in its global pandemic. Virus Res. 2018;247:71–83. doi: 10.1016/j.virusres.2018.01.014. [DOI] [PubMed] [Google Scholar]
- 30.Wang D-P, Wan H-L, Zhang S, Yu J. γ-MYN: a new algorithm for estimating Ka and Ks with consideration of variable substitution rates. Biol Direct. 2009;4(1):1–18. doi: 10.1186/1745-6150-4-20. [DOI] [PMC free article] [PubMed] [Google Scholar]
- 31.Löytynoja A. Phylogeny-aware alignment with PRANK. In: Multiple sequence alignment methods. Springer; 2014. p. 155–70. [DOI] [PubMed]
- 32.Yang Z. PAML: a program package for phylogenetic analysis by maximum likelihood. Bioinformatics. 1997;13(5):555–556. doi: 10.1093/bioinformatics/13.5.555. [DOI] [PubMed] [Google Scholar]
- 33.Ronquist F, Teslenko M, Van Der Mark P, Ayres DL, Darling A, Höhna S, Larget B, Liu L, Suchard MA, Huelsenbeck JP. MrBayes 3.2: efficient Bayesian phylogenetic inference and model choice across a large model space. System Biol. 2012;61(3):539–542. doi: 10.1093/sysbio/sys029. [DOI] [PMC free article] [PubMed] [Google Scholar]
- 34.Guindon S, Gascuel O. A simple, fast, and accurate algorithm to estimate large phylogenies by maximum likelihood. System Biol. 2003;52(5):696–704. doi: 10.1080/10635150390235520. [DOI] [PubMed] [Google Scholar]
- 35.Saitou N, Nei M. The neighbor-joining method: a new method for reconstructing phylogenetic trees. Mol Biol Evol. 1987;4(4):406–425. doi: 10.1093/oxfordjournals.molbev.a040454. [DOI] [PubMed] [Google Scholar]
- 36.Edgar RC. MUSCLE: multiple sequence alignment with high accuracy and high throughput. Nucleic Acids Res. 2004;32(5):1792–1797. doi: 10.1093/nar/gkh340. [DOI] [PMC free article] [PubMed] [Google Scholar]
- 37.Kumar S, Stecher G, Tamura K. MEGA7: molecular evolutionary genetics analysis version 7.0 for bigger datasets. Molecular biology and evolution. 2016;33(7):1870–1874. doi: 10.1093/molbev/msw054. [DOI] [PMC free article] [PubMed] [Google Scholar]
- 38.Srivathsan A, Meier R. On the inappropriate use of Kimura-2‐parameter (K2P) divergences in the DNA‐barcoding literature. Cladistics. 2012;28(2):190–194. doi: 10.1111/j.1096-0031.2011.00370.x. [DOI] [PubMed] [Google Scholar]
- 39.Huang R, Xie X, Li F, Tian E, Chao Z. Chloroplast genomes of two Mediterranean Bupleurum species and the phylogenetic relationship inferred from combined analysis with East Asian species. Planta. 2021;253(4):1–17. doi: 10.1007/s00425-021-03602-7. [DOI] [PubMed] [Google Scholar]
- 40.Wu Z, Liao R, Yang T, Dong X, Lan D, Qin R, Liu H. Analysis of six chloroplast genomes provides insight into the evolution of Chrysosplenium (Saxifragaceae) BMC Genomics. 2020;21(1):1–14. doi: 10.1186/s12864-020-07045-4. [DOI] [PMC free article] [PubMed] [Google Scholar]
- 41.Zhang H, Li C, Miao H, Xiong S. Insights from the complete chloroplast genome into the evolution of Sesamum indicum L. PloS one. 2013;8(11):e80508. doi: 10.1371/journal.pone.0080508. [DOI] [PMC free article] [PubMed] [Google Scholar]
- 42.Choi KS, Ha Y-H, Gil H-Y, Choi K, Kim D-K, Oh S-H. Two Korean endemic Clematis chloroplast genomes: Inversion, reposition, expansion of the inverted repeat region, phylogenetic analysis, and nucleotide substitution rates. Plants. 2021;10(2):397. doi: 10.3390/plants10020397. [DOI] [PMC free article] [PubMed] [Google Scholar]
- 43.Henriquez CL, Ahmed I, Carlsen MM, Zuluaga A, Croat TB, McKain MR. Molecular evolution of chloroplast genomes in Monsteroideae (Araceae) Planta. 2020;251(3):1–16. doi: 10.1007/s00425-020-03365-7. [DOI] [PubMed] [Google Scholar]
- 44.Xie D-F, Yu H-X, Price M, Xie C, Deng Y-Q, Chen J-P, Yu Y, Zhou S-D, He X-J. Phylogeny of Chinese Allium species in section Daghestanica and adaptive evolution of Allium (Amaryllidaceae, Allioideae) species revealed by the chloroplast complete genome. Front Plant Sci. 2019;10:460. doi: 10.3389/fpls.2019.00460. [DOI] [PMC free article] [PubMed] [Google Scholar]
- 45.Heckenhauer J, Samuel R, Ashton PS, Turner B, Barfuss MH, Jang T-S, Temsch EM, Mccann J, Salim KA, Attanayake A. Phylogenetic analyses of plastid DNA suggest a different interpretation of morphological evolution than those used as the basis for previous classifications of Dipterocarpaceae (Malvales) Bot J Linnean Soc. 2017;185(1):1–26. [Google Scholar]
- 46.Krawczyk K, Szczecińska M, Sawicki J. Evaluation of 11 single-locus and seven multilocus DNA barcodes in L amium L.(L amiaceae) Mol Ecol Resour. 2014;14(2):272–285. doi: 10.1111/1755-0998.12175. [DOI] [PubMed] [Google Scholar]
- 47.Li H, Xiao W, Tong T, Li Y, Zhang M, Lin X, Zou X, Wu Q, Guo X. The specific DNA barcodes based on chloroplast genes for species identification of Orchidaceae plants. Scientific Reports. 2021;11(1):1–15. doi: 10.1038/s41598-021-81087-w. [DOI] [PMC free article] [PubMed] [Google Scholar]
- 48.Moon J-C, Kim J-H, Jang CS. Development of multiplex PCR for species-specific identification of the Poaceae family based on chloroplast gene, rpoC2. Appl Biol Chem. 2016;59(2):201–207. [Google Scholar]
- 49.Kuang D-Y, Wu H, Wang Y-L, Gao L-M, Zhang S-Z, Lu L. Complete chloroplast genome sequence of Magnolia kwangsiensis (Magnoliaceae): implication for DNA barcoding and population genetics. Genome. 2011;54(8):663–673. doi: 10.1139/g11-026. [DOI] [PubMed] [Google Scholar]
- 50.Steele PR, Hertweck KL, Mayfield D, McKain MR, Leebens-Mack J, Pires JC. Quality and quantity of data recovered from massively parallel sequencing: examples in Asparagales and Poaceae. Am J Bot. 2012;99(2):330–348. doi: 10.3732/ajb.1100491. [DOI] [PubMed] [Google Scholar]
- 51.Huo Y, Gao L, Liu B, Yang Y, Kong S, Sun Y, Yang Y, Wu X. Complete chloroplast genome sequences of four Allium species: comparative and phylogenetic analyses. Scientific reports. 2019;9(1):1–14. doi: 10.1038/s41598-019-48708-x. [DOI] [PMC free article] [PubMed] [Google Scholar]
- 52.Yan C, Du J, Gao L, Li Y, Hou X. The complete chloroplast genome sequence of watercress (Nasturtium officinale RBr): Genome organization, adaptive evolution and phylogenetic relationships in Cardamineae. Gene. 2019;699:24–36. doi: 10.1016/j.gene.2019.02.075. [DOI] [PubMed] [Google Scholar]
- 53.Brearley FQ, Banin LF, Saner P. The ecology of the Asian dipterocarps. Plant Ecology & Diversity. 2016;9(5-6):429–436. [Google Scholar]
- 54.Indrioko S, Gailing O, Finkeldey R. Molecular phylogeny of Dipterocarpaceae in Indonesia based on chloroplast DNA. Plant Systematics and Evolution. 2006;261(1):99–115. [Google Scholar]
Associated Data
This section collects any data citations, data availability statements, or supplementary materials included in this article.
Supplementary Materials
Additional file 1: Figure S1. Gene map of the Dipterocarpoideae chloroplast genomes.
Additional file 2: Table S1. Codon content of 20 amino acids and stop codons in Dipterocarpoideae.
Additional file 3: Table S2. Estimates of Evolutionary Divergence between Sequences.
Data Availability Statement
The datasets generated during the current study are available in the National Center for Biotechnology Information database (NCBI). www.ncbi.nlm.nih.gov/ [MZ160991–MZ160998, MZ379792, MZ397800–MZ397801].