

Abstract
The role of P1 receptors and P2Y1 receptors in coronary vasodilator responses to adenine nucleotides was examined in the isolated guinea pig heart. Bolus arterial injections of nucleotides were made in hearts perfused at constant pressure. Peak increase in flow was measured before and after addition of purinoceptor antagonists. Both the P1 receptor antagonist 8-(p-sulfophenyl)theophylline and adenosine deaminase inhibited adenosine vasodilation. AMP-induced vasodilation was inhibited by P1 receptor blockade but not by adenosine deaminase or by the selective P2Y1 antagonist N6-methyl-2′-deoxyadenosine 3′,5′-bisphosphate (MRS 2179). ADP-induced vasodilation was moderately inhibited by P1 receptor blockade and greatly inhibited by combined P1 and P2Y1 blockade. ATP-induced vasodilation was antagonized by P1 blockade but not by adenosine deaminase. Addition of P2Y1 blockade to P1 blockade shifted the ATP dose-response curve further rightward. It is concluded that in this preparation ATP-induced vasodilation results primarily from AMP stimulation of P1 receptors, with a smaller component from ATP or ADP acting on P2Y1 receptors. ADP-induced vasodilation is largely due to P2Y1 receptors, with a smaller contribution by AMP or adenosine acting via P1 receptors. AMP responses are mediated solely by P1 receptors. Adenosine contributes very little to vasodilation resulting from bolus intracoronary injections of ATP, ADP, or AMP.
Keywords: adenosine 5′-triphosphate; adenosine 5′-diphosphate; adenosine 5′-monophosphate; adenosine; P1 receptors; P2Y1 receptors; N6-methyl-2′-deoxyadenosine 3′,5′-bisphosphate; MRS 2179
it is well established that intracoronary administration of ATP results in coronary vasodilation (14, 16, 32). Reductions in oxygen tension equivalent to those seen in the normal coronary microcirculation have been shown to cause ATP release from red blood cells (2, 20). Endogenously released intravascular ATP has therefore been proposed as a possible physiological mediator of changes in blood flow (2, 10, 11, 33). In addition, a number of physiological and pathophysiological stimuli can lead to increased cardiac ATP release, including ischemia, hypoxia, platelet aggregation, sympathetic nerve stimulation, and damage to virtually any type of cell in the heart (3, 15, 17, 23, 25). It is therefore important to understand the mechanisms of vasodilation caused by ATP and to develop effective pharmacological blockades.
Progress in this area has been slowed by the lack of specific antagonists for ATP-induced vasodilation and the presence of ectonucleotidases that rapidly metabolize ATP to ADP, AMP, and adenosine (26, 34), which are also vasodilators. Intracoronary ATP can cause vasodilation through either P1 purinergic receptors (adenosine, AMP) or P2 purinergic receptors (ATP, ADP) (7, 27). Until recently, P1 receptor antagonists were virtually the only agents available to differentiate the contribution of ATP from those of its metabolites. The results have been controversial. Studies in isolated heart preparations using P1 receptor antagonists have concluded that adenosine accounts for none (5), some (6, 22, 31), or all (12) of the vasodilation due to ATP. The recent development of a selective P2Y1 receptor antagonist, N6-methyl-2′-deoxyadenosine 3′,5′-bisphosphate (MRS 2179) (4, 9, 21), provides a new agent to separate the contributions of ATP and ADP from those of their metabolites. The present study tests the hypothesis that ATP and/or ADP causes coronary vasodilation independent from AMP and adenosine. The results indicate that ATP-induced vasodilation results primarily from AMP rather than adenosine acting via P1 receptors, with an additional contribution from ATP/ADP mediated through P2Y1 receptors.
METHODS
Isolated guinea pig heart preparation.
This study was performed in accordance with the “Guiding Principles for Research Involving Animals and Human Beings” of the American Physiological Society. Male Hartley guinea pigs (400–650 g) were anesthetized with pentobarbital sodium (150 mg/kg ip). The injectate also contained 200 units heparin. After thoracotomy, the heart and lungs were rapidly excised and placed in ice-cold saline for 15–30 s. The aorta was cannulated and perfused in the Langendorff manner at an initial flow rate of ~5 ml/min while the lungs were quickly removed. Flow was then increased to 20 ml/min until perfusion pressure reached 50 mmHg, at which point perfusion was switched to constant-pressure mode and maintained at 50 mmHg. The left ventricle was vented via a short polyethylene cannula inserted through the left atrial appendage. The ventricles were paced at 300 beats/min with 5-ms square-wave pulses of 5–7 V.
The perfusate was a Krebs-Ringer-bicarbonate buffer solution consisting of (in mM) 117 NaCl, 4.7 KCl, 1.2 KH2PO4, 1.2 MgSO4, 25 NaHCO3, 2.5 CaCl2, 5.5 glucose, and 2.0 sodium pyruvate with 5 U/l insulin. Water was obtained from a Barnstead Nanopure Infinity purification system. Before the experiment, the perfusate was filtered through a 0.45-μm filter. The perfusate reservoir was bubbled with 95% O2-5% CO2 and heated in a water bath to achieve a temperature of 37°C at the aortic cannula. Perfusate was pumped from the reservoir to the perfusion system at a constant flow of 30 ml/min. A 3-μm filter was interposed between the reservoir and the heart as further protection against particulates. Perfusion pressure was controlled by the height of an overflow column above the heart and was measured with a Statham pressure transducer through a fluid-filled catheter. Excess perfusate from the overflow column was continuously returned to the reservoir. Coronary flow was measured continuously with an in-line Transonics ultrasonic transit time flow transducer just proximal to the aortic cannula.
Drugs and chemicals.
ATP, ADP, AMP, 2-methylthio-ADP (2-MeS-ADP), and adenosine were obtained from Sigma-Aldrich and dissolved in isotonic saline. These agonists were freshly prepared on the day of the experiment and kept on ice when not in use. MRS 2179 and 2-methylthio-ATP (2-MeS-ATP) were purchased from Tocris. 8-(p-Sulfophenyl)-theophylline (8-SPT) was obtained from Dr. Ray Olsson (Univ. of South Florida College of Medicine, Tampa, FL) (29). 8-SPT and MRS 2179 were both administered to give a final perfusate concentration of 50 μM. Purinergic antagonists were dissolved in a small volume of saline and added to the perfusate reservoir. Adenosine deaminase was obtained from Roche Diagnostics as a 50% glycerol solution (1,000 U/ml) and was added to the perfusate to give a final concentration of 6 U/ml.
Experimental protocol.
After the preparation was completed, hearts were allowed to equilibrate until a stable baseline flow was achieved. Purinergic agonists (ATP, ADP, AMP, adenosine) were injected into the perfusion line between the flow probe and the heart via a T connector with a rubber septum on one arm. Bolus injections (25 μl) were made with a 50-μl Hamilton syringe. Coronary flow was allowed to return to baseline before proceeding with the next injection. Injections were made at successively higher agonist concentrations until a maximum flow increase was achieved. Two dose-response curves to a purinergic agonist were generated in each heart. Five minutes before the second dose-response experiment, perfusion was switched to a second reservoir bottle containing a purinergic antagonist and the dose-response experiment was repeated. Experiments were terminated in each heart after completion of the second dose-response curve. Each heart therefore served as its own control, and antagonist concentration did not change during agonist-induced vasodilation. Time-control experiments with no antagonist were also performed for each agonist. In some cases, an antagonist was present during both dose-response experiments. In this case, the heart was equilibrated with normal perfusate and then switched to the experimental perfusate at least 5 min before the first dose-response experiment.
Data analysis.
Coronary flow and perfusion pressure were continuously digitized at 200 samples/s, stored on disk, and analyzed with Windaq data analysis software. Purinergic agonist injections at constant pressure resulted in transient flow increases. Coronary flow data were sampled just before each injection (baseline) and at the peak flow response. Baseline flow was averaged for at least 3 s just before injection and subtracted from the maximum flow value. The resulting increase in flow was normalized per gram of wet weight of myocardium and used as the response to the injected dose. The very small response to a saline vehicle injection was subtracted from all agonist responses.
The results are presented as a series of graphs rather than shifts in EC50 because the dose-response curves were not right-shifted in a parallel manner by all antagonists. The reason that there were not parallel shifts is because at least two receptor types were involved and agonists were metabolized to secondary vasoactive compounds. It should be noted that the concentrations of agonists given in Figs. 1–6 are the concentrations in the 25-μl bolus injection, not the concentration in the perfusate after the bolus injection.
Fig. 1.
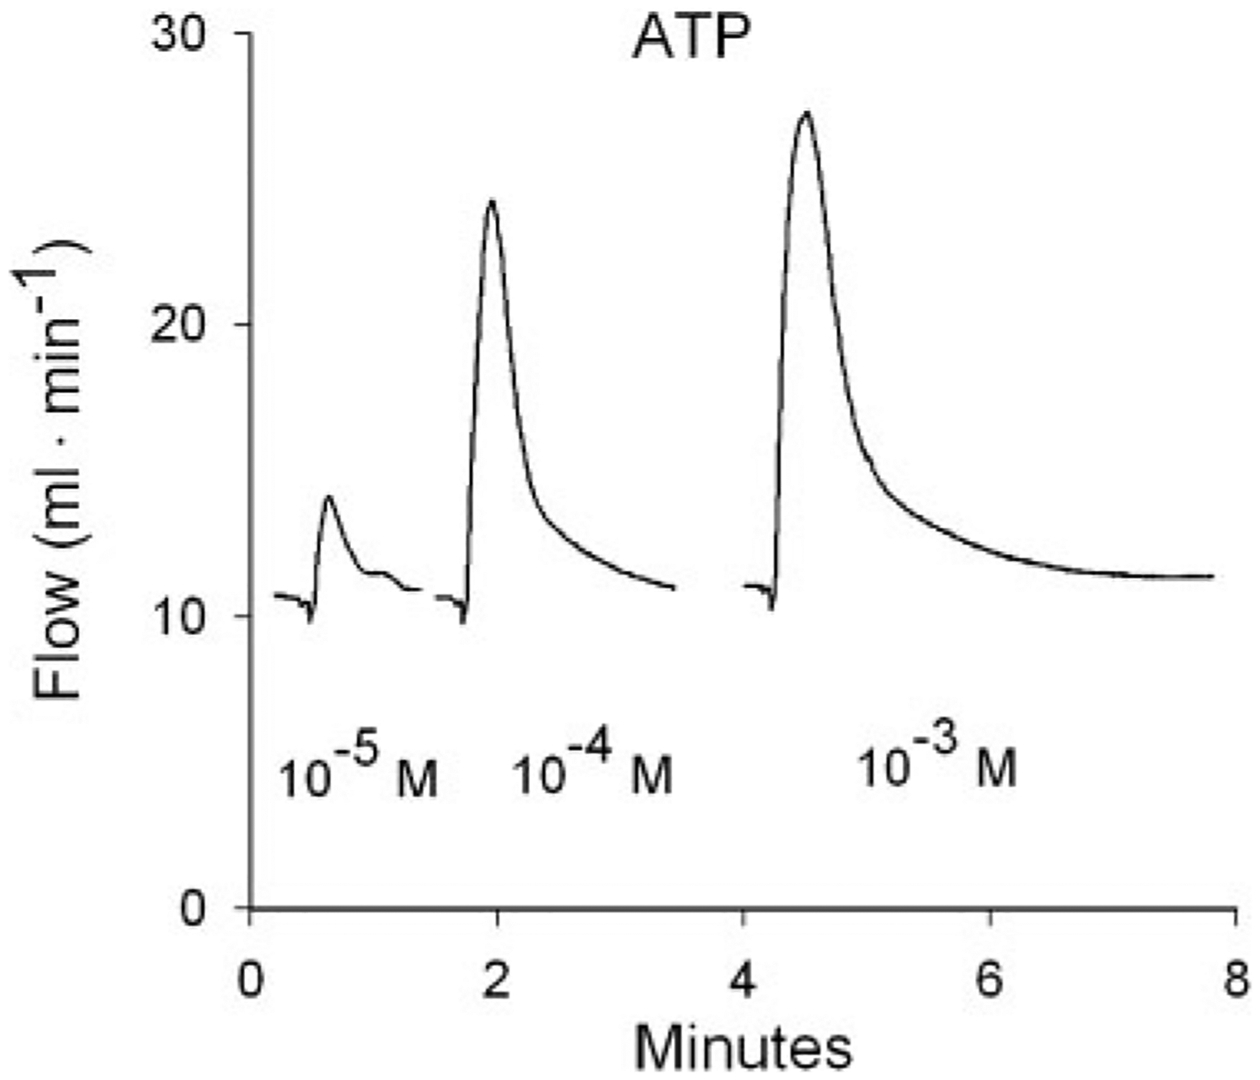
Flow responses to 3 bolus intracoronary ATP injections from 1 heart. Injection volumes were 25 μl. Concentrations refer to the ATP concentration in the bolus injectate. Responses to 2 injections at intermediate concentrations are not shown. ATP-induced vasodilation results in transient flow increases in this constant-pressure preparation. Peak increase in flow above baseline was used as the response to each injection.
Fig. 6.
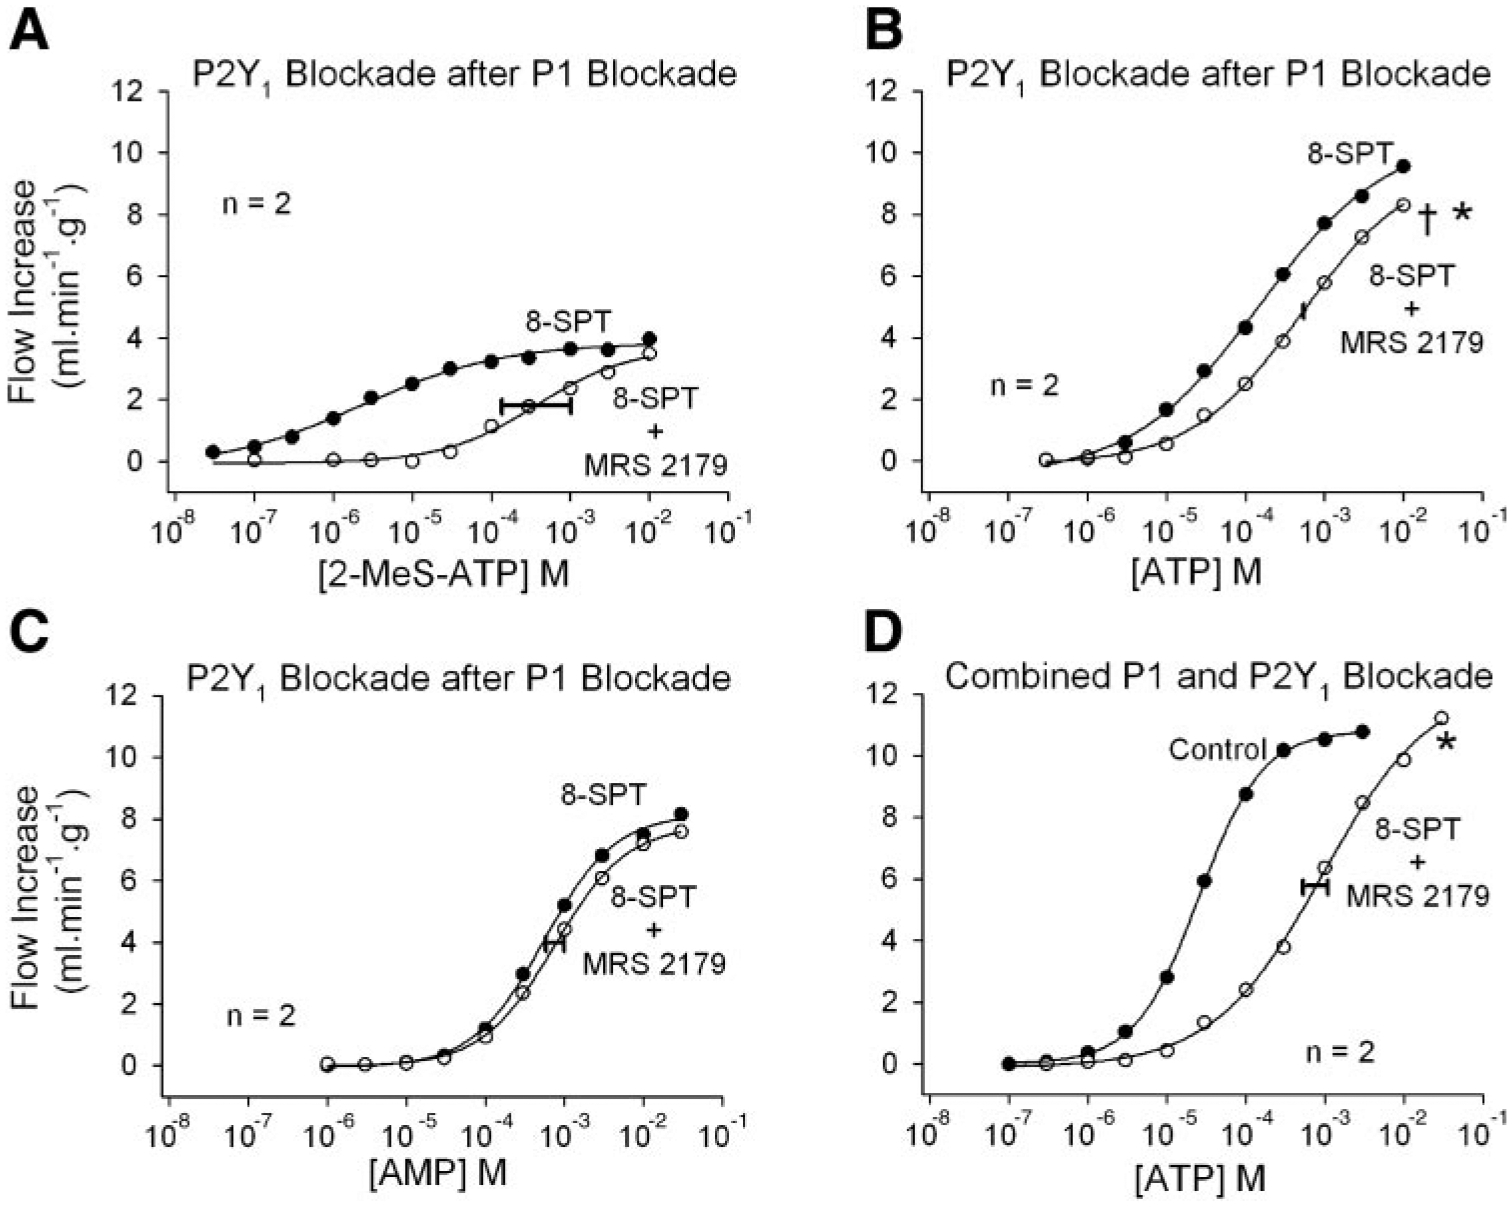
The role of P2Y1 receptors in ATP-induced coronary vasodilation. A: in the presence of P1 blockade with 8-SPT, 2-methylthio-ATP (2-MeS-ATP) causes vasodilation that is antagonized by the P2Y1 antagonist MRS 2179. B: after P1 receptor blockade with 8-SPT, MRS 2179 provides further inhibition of ATP-induced vasodilation, indicating a P2Y1 receptor contribution. C: P1 receptor blockade by 8-SPT is not strengthened by addition of MRS 2179, indicating that the results in B are due to P2Y1 receptor blockade. D: combined P1 and P2Y1 receptor blockade inhibits ATP-induced coronary vasodilation. Concentrations indicate the concentration in the 25-μl bolus injectate. The width of the horizontal bar on the experimental dose-response curve indicates the difference in rightward shift in the 2 hearts. *P < 0.01 vs. the ATP time-control experiment; †P < 0.01 vs. experiment in C.
Each graph presents the average “control” and “antagonist” responses from two hearts, generated from four individual dose-response curves. In most cases the antagonist curve was shifted rightward compared with the control curve, even in time-control experiments. The following procedure was used to determine whether the rightward shift was significantly greater than in a time-control experiment. First, the combined control data and the combined antagonist data from two hearts were separately fit without constraints to the Hill equation
where y is the flow increase at dose x, y0 is the minimum flow increase, a is the maximum flow increase, c is the EC50, and b is the Hill exponent. These fits are shown in Figs. 2–6. Curve fitting was done with SigmaPlot software. The maximum and minimum values from control and antagonist fits were averaged, and the control and antagonist data were then refit while constrained to the same average minimum and maximum. In time-control experiments the rightward shift of the second dose-response curve was calculated as c2/c1, where c1 and c2 are the EC50 values of the first and second dose-response curves, respectively. The control concentrations in subsequent experiments using the same agonist were multiplied by c2/c1, effectively shifting the control curve rightward by the same amount as in a time-control experiment.
Fig. 2.
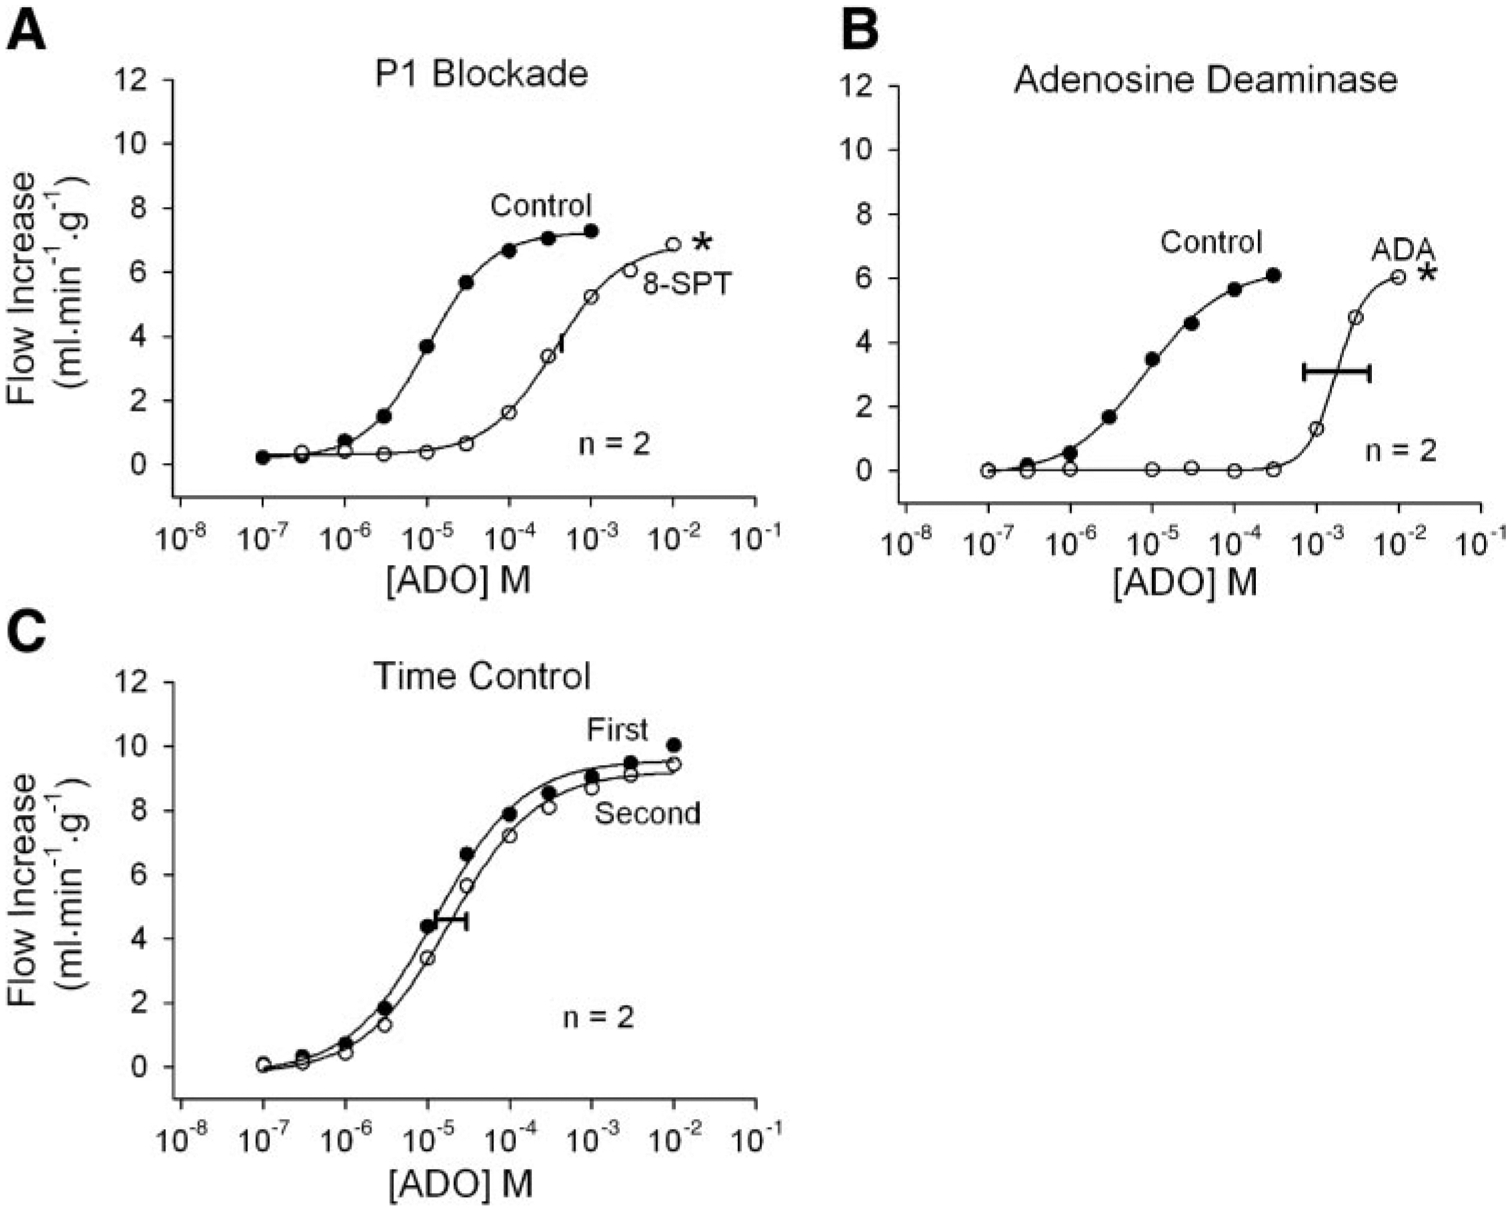
Responses to intracoronary adenosine (ADO) injections. A control and an experimental dose-response curve were obtained in each heart. Mean responses from 2 hearts are shown in each panel. Both P1 receptor blockade with 50 μM 8-(p-sulfophenyl) theophylline (8-SPT; A) and addition of 6 U/ml adenosine deaminase (ADA) to the perfusate (B) effectively antagonize adenosine responses and shift the dose-response curves severely rightward. Time-control experiments (C) demonstrate that the responses to adenosine are stable over time. Concentrations indicate the concentration in the 25-μl bolus injectate. The width of the horizontal bar on the experimental dose-response curve indicates the difference in rightward shift in the 2 hearts. *P < 0.01 vs. the adenosine time-control experiment.
The shifted control curve was then compared with the antagonist curve by using the F-test for nonlinear regressions (24). This test determines whether the data are significantly better fit by two separate regressions as opposed to one. The residual sum of squares for separate fits of the shifted control data and the antagonist data were added and compared with the residual sum of squares from a single fit of the combined data using the same constraints. The F-test was used to determine whether the residuals were significantly different at a P value of <0.01. A positive result indicates that the control and antagonist curves are significantly different after correction for time-dependent changes. In one instance (see Fig. 6B), an experiment other than a time control was used to shift the control curve rightward before applying the F-test.
Because each heart served as its own control before the addition of the selected antagonist, it is the shift in the log dose-response curve that was important, not the variability of the dose-response among different hearts. To provide an index of the variability in the shift in the log dose-response curve due to the selected antagonist, a half-maximal flow increase (F50) was first calculated for each figure panel from the average (control + antagonist) maximum and minimum as determined above. With the use of the Hill equation parameters for the control and antagonist curves in each heart individually, the concentrations at the F50 were calculated as
where x is the agonist concentration at the F50 and y is the F50. The rightward shift in a dose-response curve produced by an antagonist was calculated as the increase in the logarithm of the dose at the F50. The difference between the two antagonist-induced rightward shifts in the two hearts was plotted as a horizontal bar centered on the average antagonist dose-response curve at the F50. Thus the two antagonist responses indicated by the ends of the horizontal bar can be viewed as though they originated from a common control response.
RESULTS
Although n = 2 for each individual experiment, each antagonist was used in multiple experiments. The effects of the antagonists on baseline flow were determined by combining these results. Baseline flows at the beginning of the two dose-response experiments in each heart were compared with the paired t-test and are reported as means ± SE. In time-control experiments, baseline coronary flow averaged 6.9 ± 0.2 ml·min−1·g−1 before the first dose-response experiment and 6.5 ± 0.2 ml·min−1·g−1 before the second dose-response experiment (not significant; n = 8). When no other drug was present, addition of 8-SPT before the second experiment reduced baseline flow slightly from 7.3 ± 0.3 to 6.5 ± 0.2 ml·min−1·g−1 (P < 0.01; n = 8). In the presence of 8-SPT, addition of MRS 2179 before the second dose-response curve lowered baseline flow slightly from 6.5 ± 0.3 to 6.1 ± 0.4 ml·min−1·g−1 (P < 0.01; n = 10). Addition of adenosine deaminase caused a transient increase in baseline flow that returned to control levels before the second dose-response experiment was begun (7.7 ± 0.6 ml·min−1·g−1 control vs. 7.7 ± 0.8 ml·min−1·g−1 with adenosine deaminase; n = 6).
Flow recordings after three ATP injections are shown in Fig. 1. Peak flow and the duration of increased flow changed in parallel in the presence and absence of the purinergic antagonists. Responses to intracoronary adenosine injections are shown in Fig. 2. Figure 2A demonstrates that the P1 receptor antagonist 8-SPT at 50 μM is a very effective adenosine antagonist. Adenosine deaminase at 6 U/ml was also highly effective at reducing adenosine vasodilation (Fig. 2B). The time-control experiment in Fig. 2C demonstrates that the adenosine dose-response curves are reproducible with low variability.
Responses to intracoronary AMP injections are shown in Fig. 3. Figure 3A demonstrates that the P1 receptor antagonist 8-SPT is also highly effective as an AMP antagonist. However, because AMP may be largely converted to adenosine, this result alone does not demonstrate that AMP acts independently from adenosine. Adenosine deaminase (Fig. 3B) did not shift the AMP curve significantly compared with AMP time-control experiments (Fig. 3D), indicating that the adenosine component of AMP vasodilation is quite small. When this adenosine component was first removed by pretreatment with adenosine deaminase (Fig. 3C), 8-SPT again shifted the AMP dose-response curve far to the right. AMP therefore causes vasodilation in this preparation independently from adenosine, and both AMP and adenosine act via P1 receptors.
Fig. 3.
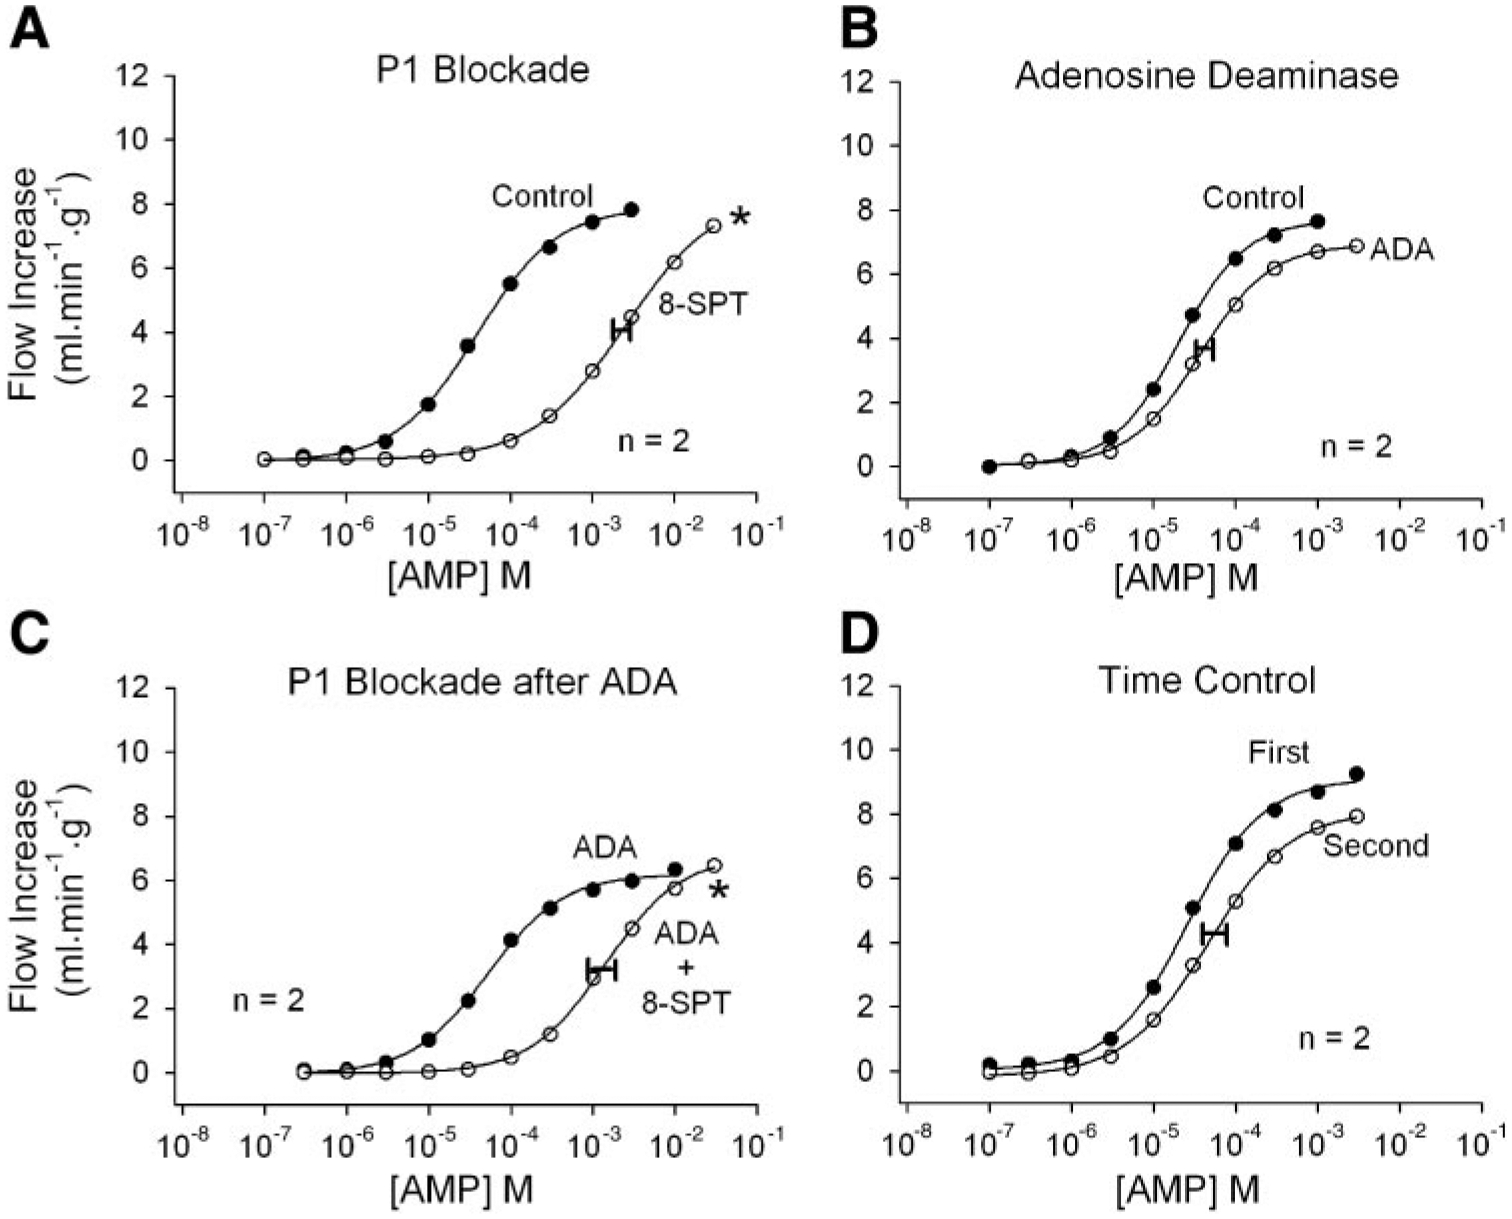
Responses to intracoronary bolus AMP injections. A: the P1 receptor antagonist 8-SPT greatly reduces AMP vasodilation. B: adenosine deaminase in the perfusate has no significant effect on AMP vasodilation, suggesting that AMP acts independently from adenosine. C: when adenosine responses are eliminated by adenosine deaminase, 8-SPT remains an effective AMP antagonist, confirming that AMP dilates independently from adenosine and acts via P1 receptors. D: the effects of 8-SPT are not due to time. Concentrations indicate the concentration in the 25-μl bolus injectate. The width of the horizontal bar on the experimental dose-response curve indicates the difference in rightward shift in the 2 hearts. *P < 0.01 vs. the AMP time-control experiment.
Responses to intracoronary ADP injections are shown in Fig. 4. P1 receptor blockade with 8-SPT shifted the dose-response curve significantly rightward (Fig. 4A) compared with the time-control experiment (Fig. 4D), indicating a small AMP or adenosine component to the responses. The efficacy of MRS 2179 as a P2Y1 antagonist was tested with 2-MeS-ADP, a potent P2Y1 agonist (28). In the presence of 8-SPT, MRS 2179 shifted the 2-MeS-ADP curve severely rightward (Fig. 4B). A similar result was obtained by using ADP as the agonist, indicating a strong P2Y1 component to ADP responses (Fig. 4C). The ADP responses were stable over time (Fig. 4D).
Fig. 4.
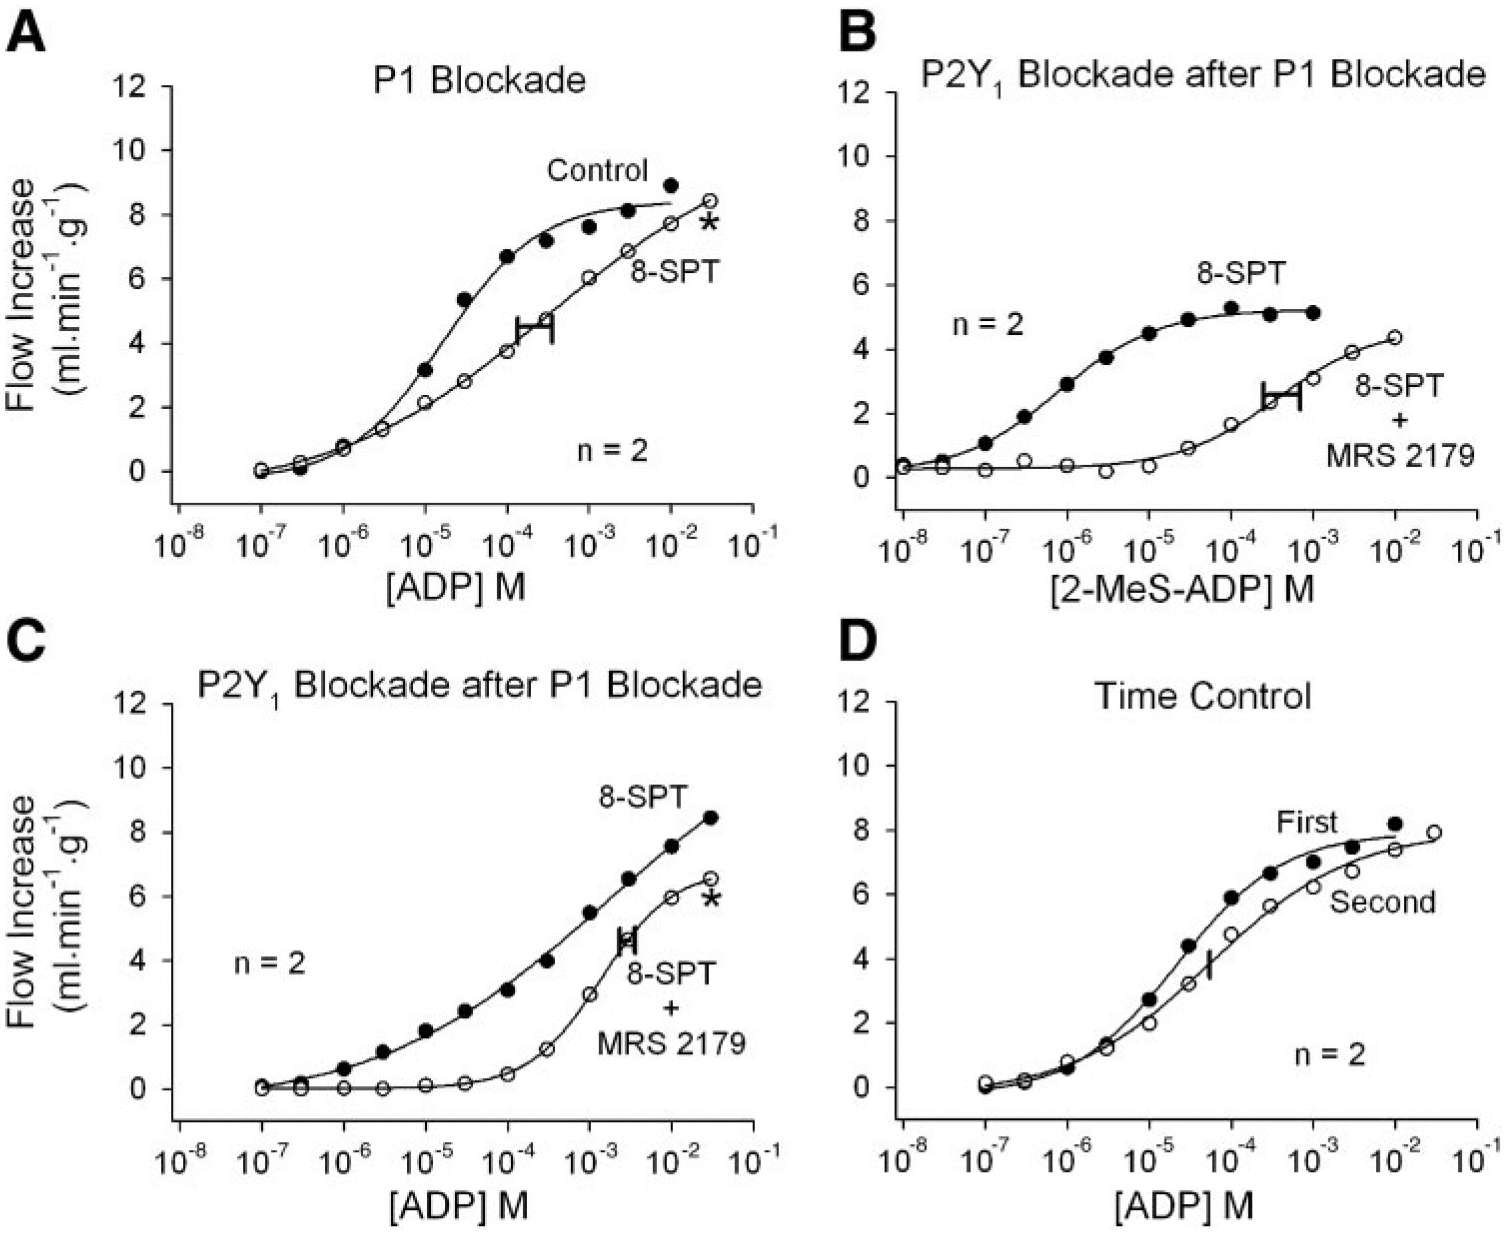
Responses to intracoronary bolus ADP injections. A: P1 receptor blockade by 8-SPT shifts the ADP dose-response curve moderately to the right, indicating some contribution by AMP and/or adenosine. B: after P1 receptor blockade with 8-SPT, 50 μM N6-methyl-2′-deoxyadenosine 3′,5′-bisphosphate (MRS 2179) severely inhibits vasodilation to 2-methylthio-ADP (2-MeS-ADP), confirming that MRS 2179 is an effective P2Y1 receptor antagonist. C: after P1 receptor blockade with 8-SPT, MRS 2179 shifts the ADP dose-response curve further rightward, indicating a contribution by P2Y1 receptors. The P2Y1 component is especially prominent at low ADP concentrations, where P1 receptor blockade has little effect (A). D: ADP responses are stable over time. Concentrations indicate the concentration in the 25-μl bolus injectate. The width of the horizontal bar on the experimental dose-response curve indicates the difference in rightward shift in the 2 hearts. *P < 0.01 vs. the ADP time-control experiment.
Responses to intracoronary ATP injections are shown in Figs. 5 and 6. P1 receptor blockade with 8-SPT shifted the ATP dose-response curve significantly rightward, indicating a strong contribution by either AMP or adenosine (Fig. 5A). Addition of adenosine deaminase to the perfusate had no effect on ATP responses (Fig. 5B), suggesting that the P1 component is mediated by AMP. This is confirmed in Fig. 5C, where the first ATP dose-response curve was obtained in the presence of both adenosine deaminase and MRS 2179, which attenuates both adenosine- and P2Y1-mediated vasodilation. Addition of 8-SPT shifted the curve significantly rightward, demonstrating a strong P1 receptor component to ATP-induced vasodilation that is presumably due to AMP. ATP responses were stable over time (Fig. 5D).
Fig. 5.
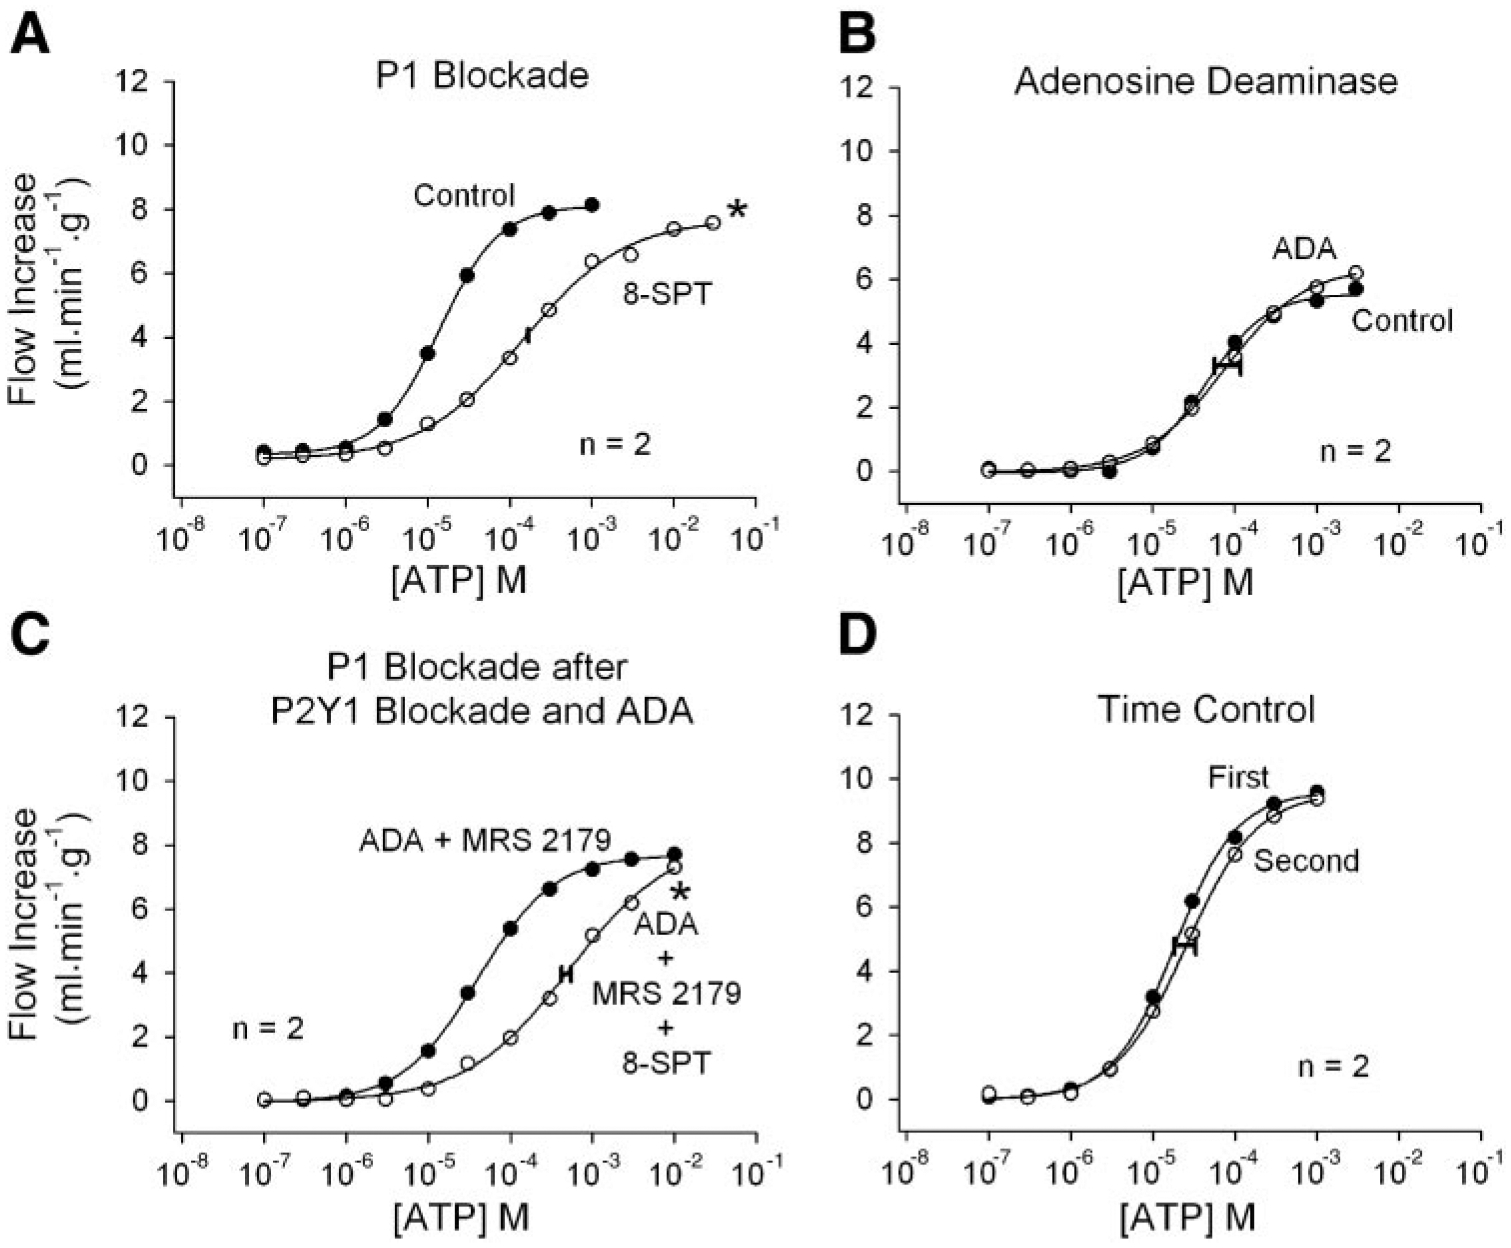
Responses to intracoronary bolus ATP injections. A: P1 receptor blockade by 8-SPT inhibits ATP-induced vasodilation, indicating a contribution by AMP and/or adenosine. B: adenosine deaminase does not inhibit responses to ATP, indicating lack of contribution by adenosine. C: when adenosine responses are eliminated by adenosine deaminase and P2Y1 receptor-mediated vasodilation is blocked by MRS 2179, 8-SPT again inhibits responses to ATP. This indicates that a significant amount of ATP-induced vasodilation is due to AMP acting at P1 receptors. D: ATP responses are stable over time. Concentrations indicate the concentration in the 25-μl bolus injectate. The width of the horizontal bar on the experimental dose-response curve indicates the difference in rightward shift in the 2 hearts. *P < 0.01 vs. the ATP time-control experiment.
Experiments to assess the role of P2Y1 receptors in ATP-induced vasodilation are shown in Fig. 6. In the presence of P1 receptor blockade, 2-MeS-ATP caused modest coronary vasodilation and the dose-response curve was shifted severely rightward by MRS 2179 (Fig. 6A). This indicates that MRS 2179 blocks P2Y1 receptors. ATP is subject to rapid metabolism, however, which will tend to reduce the P2Y1 receptor component and increase the P1 receptor component (AMP or adenosine). When the P1 receptor component was inhibited by 8-SPT, addition of MRS 2179 shifted the ATP responses significantly rightward (Fig. 6B). This indicates a P2Y1 receptor component, but it might also be explained if MRS 2179 is a weak P1 antagonist and thus strengthens the effect of 8-SPT. Figure 6C demonstrates that this is not the case, because addition of MRS 2179 to 8-SPT did not shift the AMP dose-response curve rightward. Figure 6D demonstrates that the combination of 8-SPT and MRS 2179 is effective in antagonizing ATP-induced vasodilation.
DISCUSSION
The goal of the present experiments was to characterize ATP-induced vasodilation in the isolated guinea pig heart and to devise an effective pharmacological blockade. The major conclusions are as follows. 1) Adenosine contributes very little to the vasodilation induced by intracoronary injections of ATP, ADP, or AMP. 2) The majority of ATP-induced vasodilation is mediated by AMP acting on P1 purinoceptors. 3) In addition to a P1 component, ATP and ADP cause vasodilation via P2Y1 receptors that can be blocked by MRS 2179. 4) The combination of P1 and P2Y1 receptor blockade is effective in blocking ATP coronary vasodilation.
The reasoning behind many of the conclusions of this study was presented in results. The mechanisms underlying vasodilation to intravascular AMP, ADP, and ATP can be briefly summarized as follows. AMP-induced vasodilation is mediated via P1 receptors (Fig. 3A; Refs. 7 and 13), with no contribution from P2Y1 receptors (Fig. 6C). Furthermore, AMP does not need to be converted to adenosine to cause vasodilation (Fig. 3, B and C). ADP dilates largely via P2Y1 receptors (Fig. 4C), with an additional contribution from AMP/adenosine acting on P1 receptors (Fig. 4A). ATP-induced vasodilation in this preparation is mediated largely by AMP acting via P1 receptors (Figs. 5, A–C), with an additional component due to P2Y1 activation (Fig. 6B).
The presence of ectonucleotidases in the coronary circulation means that ATP can be rapidly metabolized to ADP, AMP, and adenosine (26, 34). The P2Y1 receptor component of ATP-induced vasodilation might therefore be mediated by either ATP or ADP. Both species are capable of stimulating P2Y1 receptors in this preparation, as evidenced by MRS 2179-inhibitable vasodilation in response to 2-MeS-ATP and 2-MeS-ADP (Figs. 6A and 4B). One way to distinguish between ATP and ADP would be to inhibit ecto-ATPases. Unfortunately, the ecto-ATPase inhibitors currently available are not effective in the isolated guinea pig heart preparation (12). The present experiments therefore cannot determine whether ATP acts independently or only after conversion to ADP.
In the presence of P1 receptor blockade, P2Y1 receptor blockade with MRS 2179 inhibits ADP responses to a greater extent than ATP responses (Figs. 4C and 6B). P2Y1 receptors therefore appear to contribute more to ADP responses than to ATP-induced vasodilation. On the other hand, P1 receptors contribute more to ATP-induced vasodilation than to ADP responses (Figs. 5A and 4A). This suggests that much of the injected ATP is converted directly to AMP rather than ADP. The existence of extracellular enzymes catalyzing the direct ATP→AMP reaction (ecto-ATP diphosphohydrolase or ectoapyrase) is well established (34). Further tests of this hypothesis will have to await the development of specific ecto-ATPase inhibitors.
The combination of P1 and P2Y1 antagonists provides a good blockade of ATP-induced vasodilation (Fig. 6D). Even under these conditions, however, P2Y2 and P2Y4 receptors remain unblocked and may be responsible for much of the residual ATP responses. Delineation of the role of P2Y2 and P2Y4 receptors in ATP-induced vasodilation will have to await the development of specific antagonists for these receptors.
Maximum vasodilations in response to the 2-methylthio analogs of ATP and ADP were noticeably smaller than the maximum responses to either ATP or ADP (Figs. 6 and 4). The current experiments do not directly address the reason for these differences, but two possibilities are suggested. The 2-methylthio nucleotide responses might represent the maximum contribution of P2Y1 receptors to the vasodilator response. Another possibility is that the smaller maxima reflect competition between P2Y1-mediated vasodilation and P2X receptor-mediated vasoconstriction. This competition may be more prominent for the 2-methylthio nucleotides than for native nucleotides.
The conclusions of this study apply to intravascular ATP injections. Because vasodilator P2Y receptors are located primarily on the endothelium and vasoconstrictor P2X receptors primarily on vascular smooth muscle, intravascular ATP responses are biased toward vasodilation. In many situations ATP is released from myocytes or nerves into the interstitial space, where the net effects on vascular smooth muscle may be quite different from those seen here. The results in the current study apply primarily to ATP released within the intravascular space from either blood-formed elements or endothelial cells (2, 3, 10, 11, 20, 33).
Previous studies in isolated rodent hearts have concluded that adenosine accounts for none (5), some (6, 22, 31), or all (12) of ATP-induced vasodilation. These conclusions were based primarily on the effects (or lack thereof) of adenosine (P1) antagonists on ATP-induced vasodilation. The current results agree with most previous studies in that a P1 receptor antagonist reduces ATP-induced vasodilation. Most studies have concluded that this is due to adenosine antagonism, but the present data indicate that this is due to inhibition of AMP responses. When ATP is infused in the isolated guinea pig heart, AMP is the most abundant metabolite recovered in the venous effluent (1, 3). This supports a stronger role for AMP than adenosine in ATP-induced vasodilation.
The current results do not support a role for adenosine in nucleotide vasodilation, but, unlike previous studies (5), this is not based on the ineffectiveness of P1 receptor antagonists. It is based instead on the ineffectiveness of adenosine deaminase. The lack of an adenosine deaminase effect is at odds with the study by Erga et al. (12), who found that adenosine deaminase reduced ATP-induced vasodilation in a guinea pig preparation. The difference may arise from their use of steady ATP infusions in a constant-flow preparation instead of the bolus ATP injections used in the current constant-pressure preparation. The advantages of the bolus injection and constant-pressure preparation over a constant-flow preparation are as follows. 1) Agonist washout is more rapid with a bolus injection; thus the next dose may be given relatively quickly, and a complete dose response may be obtained without prolonged time effects. 2) A constant-pressure preparation is more physiological than a constant-flow preparation where coronary vasodilation results in very low perfusion pressures. 3) Vasodilation at constant flow in the isolated guinea pig heart preparation increases flow heterogeneity and compromises ventricular function (18).
In conclusion, in the buffer-perfused guinea pig heart preparation ATP-induced vasodilation results primarily from AMP stimulation of P1 purinergic receptors, with a smaller component from ATP or ADP acting on P2Y1 purinergic receptors. ADP-induced vasodilation is largely due to P2Y1 receptors, with a smaller contribution by AMP or adenosine acting via P1 receptors. AMP responses are mediated solely by P1 receptors. Adenosine contributes very little to vasodilation resulting from bolus intracoronary injections of ATP, ADP, or AMP. A combination of P1 and P2Y1 receptor blockade inhibits ATP coronary vasodilation in the buffer-perfused guinea pig heart.
DISCLOSURES
This work was supported by National Heart, Lung, and Blood Institute Grant HL-49822.
REFERENCES
- 1.Belardinelli L, Shryock J, West A, Clemo HF, DiMarco JP, and Berne RM. Effects of adenosine and adenine nucleotides on the atrioventricular node of isolated guinea pig hearts. Circulation 70: 1083–1091, 1984. [DOI] [PubMed] [Google Scholar]
- 2.Bergfeld GR and Forrester T. Release of ATP from human erythrocytes in response to a brief period of hypoxia and hypercapnia. Cardiovasc Res 26: 40–47, 1992. [DOI] [PubMed] [Google Scholar]
- 3.Borst MM and Schrader J. Adenine nucleotide release from isolated perfused guinea pig hearts and extracellular formation of adenosine. Circ Res 68: 797–806, 1991. [DOI] [PubMed] [Google Scholar]
- 4.Boyer JL, Mohanram A, Camaioni E, Jacobson KA, and Harden TK. Competitive and selective antagonism of P2Y1 receptors by N6-methyl 2′-deoxyadenosine 3′,5′-bisphosphate. Br J Pharmacol 124: 1–3, 1998. [DOI] [PMC free article] [PubMed] [Google Scholar]
- 5.Brown IP, Thompson CI, and Belloni FL. Mechanisms of coronary vasodilatation produced by ATP in guinea-pig isolated perfused heart. Br J Pharmacol 105: 211–215, 1992. [DOI] [PMC free article] [PubMed] [Google Scholar]
- 6.Bunger R, Haddy FJ, and Gerlach E. Coronary responses to dilating substances and competitive inhibition by theophylline in the isolated perfused guinea pig heart. Pflügers Arch 358: 213–224, 1975. [DOI] [PubMed] [Google Scholar]
- 7.Burnstock G A basis of distinguishing two types of purinergic receptors. In: Cell Membrane Receptors for Drugs and Hormones: A Multidisciplinary Approach, edited by Bolis L and Straub RW. New York: Raven, 1978, p. 107–118. [Google Scholar]
- 8.Buxton ILO, Kaiser RA, Oxhorn BC, and Cheek DJ. Evidence supporting the Nucleotide Axis Hypothesis: ATP release and metabolism by coronary endothelium. Am J Physiol Heart Circ Physiol 281: H1657–H1666, 2001. [DOI] [PubMed] [Google Scholar]
- 9.Camaioni E, Boyer JL, Mohanram A, Harden TK, and Jacobson KA. Deoxyadenosine bisphosphate derivatives as potent antagonists at P2Y1 receptors. J Med Chem 41: 183–190, 1998. [DOI] [PMC free article] [PubMed] [Google Scholar]
- 10.Dietrich HH, Ellsworth ML, Sprague RS, and Dacey RG Jr. Red blood cell regulation of microvascular tone through adenosine triphosphate. Am J Physiol Heart Circ Physiol 278: H1294–H1298, 2000. [DOI] [PubMed] [Google Scholar]
- 11.Ellsworth ML, Forrester T, Ellis CG, and Dietrich HH. The erythrocyte as a regulator of vascular tone. Am J Physiol Heart Circ Physiol 269: H2155–H2161, 1995. [DOI] [PubMed] [Google Scholar]
- 12.Erga KS, Seubert CN, Liang HX, Wu L, Shryock JC, and Belardinelli L. Role of A2A-adenosine receptor activation for ATP-mediated coronary vasodilation in guinea-pig isolated heart. Br J Pharmacol 130: 1065–1075, 2000. [DOI] [PMC free article] [PubMed] [Google Scholar]
- 13.Fleetwood G and Gordon JL. Purinoceptors in the rat heart. Br J Pharmacol 90: 219–227, 1987. [DOI] [PMC free article] [PubMed] [Google Scholar]
- 14.Folkow B The vasodilator action of adenosine triphosphate. Acta Physiol Scand 17: 311–316, 1949. [DOI] [PubMed] [Google Scholar]
- 15.Fredholm BB, Hedqvest P, Lindstrom K, and Wennmalm M. Release of nucleosides and nucleotides from the rabbit heart by sympathetic nerve stimulation. Acta Physiol Scand 116: 295, 1982. [DOI] [PubMed] [Google Scholar]
- 16.Gillespie JH. The biological significance of the linkages in adenosine triphosphoric acid. J Physiol 80: 345–359, 1934. [DOI] [PMC free article] [PubMed] [Google Scholar]
- 17.Gordon JL. Extracellular ATP: effects, sources and fate. Biochem J 233: 309–319, 1986. [DOI] [PMC free article] [PubMed] [Google Scholar]
- 18.Gorman MW, Wangler RD, and Sparks HV. Distribution of perfusate flow during vasodilation in isolated guinea pig heart. Am J Physiol Heart Circ Physiol 256: H297–H301, 1989. [DOI] [PubMed] [Google Scholar]
- 20.Jagger JE, Bateman RM, Ellsworth ML, and Ellis CG. Role of erythrocyte in regulating local O2 delivery mediated by hemoglobin oxygenation. Am J Physiol Heart Circ Physiol 280: H2833–H2839, 2001. [DOI] [PubMed] [Google Scholar]
- 21.Kaiser RA and Buxton ILO. Nucleotide-mediated relaxation in guinea-pig aorta: selective inhibition by MRS2179. Br J Pharmacol 135: 537–545, 2002. [DOI] [PMC free article] [PubMed] [Google Scholar]
- 22.Korchazhkina O, Wright G, and Exley C. Intravascular ATP and coronary vasodilation in the isolated working rat heart. Br J Pharmacol 127: 701–708, 1999. [DOI] [PMC free article] [PubMed] [Google Scholar]
- 23.Mills DCB, Robb IA, and Roberts GCK. The release of nucleotides, 5-hydroxytryptamine and enzymes from human blood platelets during aggregation. J Physiol 195: 710–729, 1968. [DOI] [PMC free article] [PubMed] [Google Scholar]
- 24.Motulsky HJ and Ransnas LA. Fitting curves to data using nonlinear regression: a practical and nonmathematical review. FASEB J 1:365–374, 1987. [PubMed] [Google Scholar]
- 25.Paddle BM and Burnstock G. Release of ATP from perfused heart during coronary vasodilatation. Blood Vessels 11: 110–119, 1974. [DOI] [PubMed] [Google Scholar]
- 26.Pearson JD and Gordon JL. Nucleotide metabolism by endothelium. Annu Rev Physiol 47: 617–627, 1985. [DOI] [PubMed] [Google Scholar]
- 27.Ralevic V and Burnstock G. Receptors for purines and pyrimidines. Pharmacol Rev 50: 415–492, 1998. [PubMed] [Google Scholar]
- 28.Schachter JB, Li Q, Boyer JL, Nicholas RA, and Harden TK. Second messenger cascade specificity and pharmacological selectivity of the human P2Y1-purinoceptor. Br J Pharmacol 118:167–173, 1996. [DOI] [PMC free article] [PubMed] [Google Scholar]
- 29.Tune JD, Richmond KN, Gorman MW, Olsson RA, and Feigl EO. Adenosine is not responsible for local metabolic control of coronary blood flow in dogs during exercise. Am J Physiol Heart Circ Physiol 278: H74–H84, 2000. [DOI] [PubMed] [Google Scholar]
- 31.Vials AJ and Burnstock G. The effect of suramin on vasodilator responses to ATP and 2-methylthio-ATP in the Sprague-Dawley rat coronary vasculature. J Cardiovasc Pharmacol 23: 757–764, 1994. [DOI] [PubMed] [Google Scholar]
- 32.Wolf MM and Berne RM. Coronary vasodilator properties of purine and pyrimidine derivatives. Circ Res 9: 343–348, 1956. [DOI] [PubMed] [Google Scholar]
- 33.Yang S, Cheek DJ, Westfall DP, and Buxton ILO. Purinergic axis in cardiac blood vessels. Agonist-mediated release of ATP from cardiac endothelial cells. Circ Res 74: 401–407, 1994. [DOI] [PubMed] [Google Scholar]
- 34.Zimmermann H Extracellular metabolism of ATP and other nucleotides. Naunyn Schmiedebergs Arch Pharmacol 362: 299–309, 2000. [DOI] [PubMed] [Google Scholar]