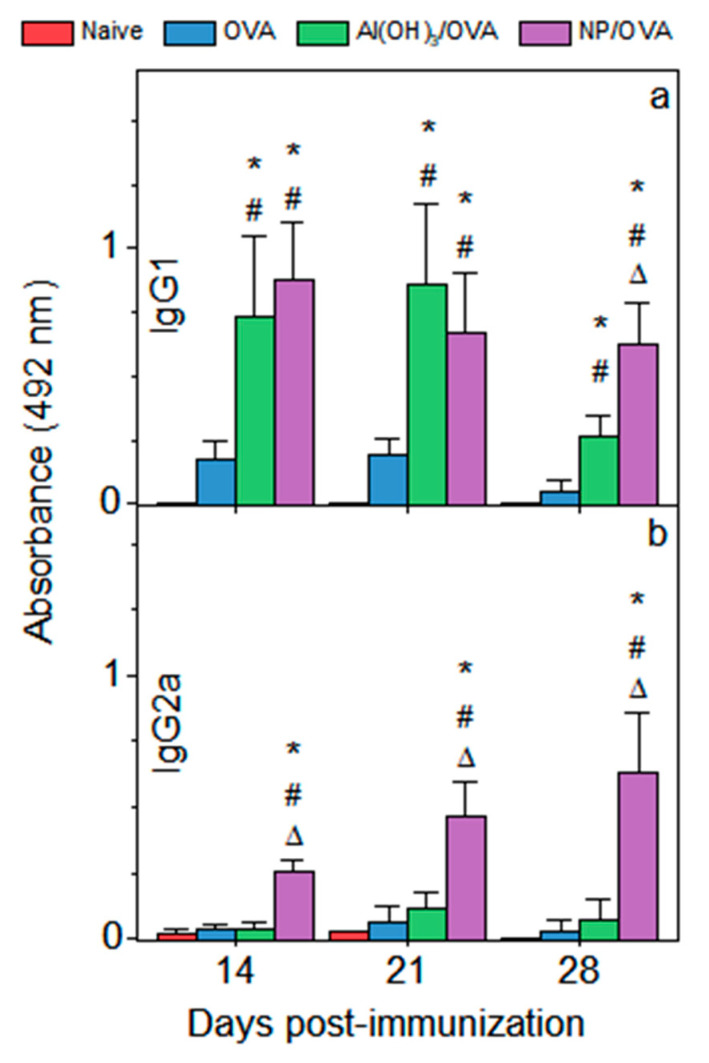
Figure 5.
Antibody production in sera on days 14, 21 and 28 after immunization as induced by ovalbumin (OVA), Al(OH)3/OVA and NPs/OVA. The mean absorbance measured at 492 nm ± standard deviation was relative to the production of OVA-specific IgG1 (a) or IgG2a (b). Serum dilution to present IgG1 primary response was 1/1024 and IgG2a primary response was showed at 1/32. Secondary response of IgG1 was displayed at 1/512,000 whereas IgG2a secondary response was presented at 1/512. p < 0.05 compared to the naive group (#), p < 0.05 compared to the OVA group (*), p < 0.05 compared to the Al(OH)3/OVA group (∆).

