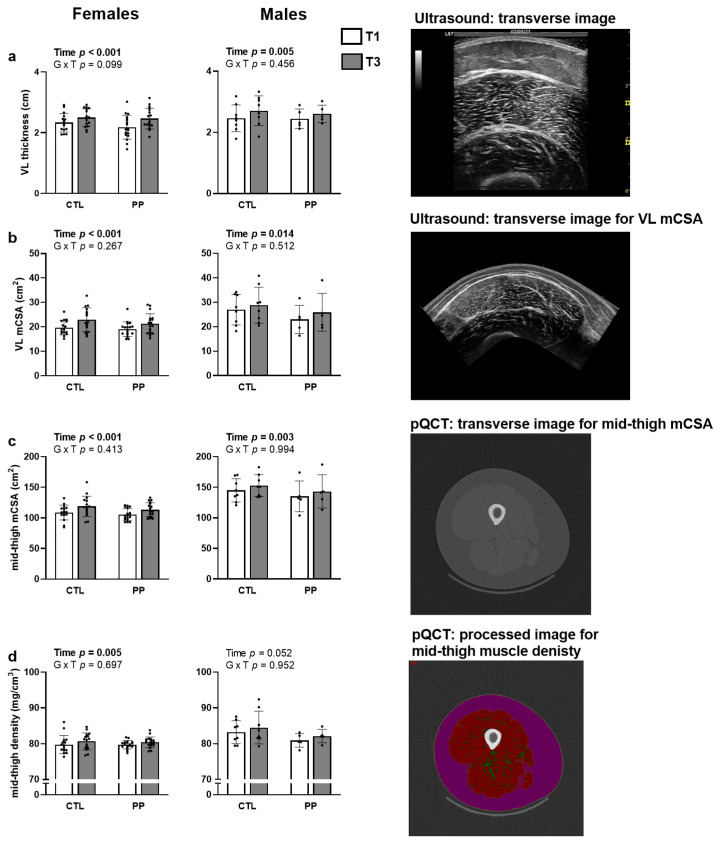
Figure 5.
Mid-thigh muscle adaptations. Data include vastus lateralis (VL) thickness (a), vastus lateralis muscle cross-sectional area (mCSA; (b)), mid-thigh mCSA (c), and mid-thigh muscle density (d). Representative images of each technique are provided to the right of each bar graph. All data are presented as mean ± standard deviation values. Other abbreviations: PP, peanut protein group; CTL, control group. Symbol: •, indicates individual respondent data.

