Abstract
Clonal hematopoiesis results from somatic genomic alterations that drive clonal expansion of blood cells. Somatic gene mutations associated with hematologic malignancies detected in hematopoietic cells of healthy individuals, referred to as clonal hematopoiesis of indeterminate potential (CHIP), have been associated with myeloid malignancies while mosaic chromosomal alterations (mCAs) have been associated with lymphoid malignancies. Here, we analyzed CHIP in 55,383 individuals and autosomal mCAs in 420,969 individuals with no history of hematologic malignancies in the UK Biobank and Mass General Brigham Biobank. We distinguished myeloid and lymphoid somatic gene mutations, as well as myeloid and lymphoid mCAs, and found both to be associated with risk of lineage-specific hematologic malignancies. Further, we performed an integrated analysis of somatic alterations with peripheral blood count parameters to stratify the risk of incident myeloid and lymphoid malignancies. These genetic alterations can be readily detected in clinical sequencing panels and used with blood count parameters to identify individuals at high risk of developing hematologic malignancies.
Editor summary:
Genomic analyses in the UK Biobank show that clonal hematopoiesis of indeterminate potential in the lymphoid lineage is associated with a higher risk of developing lymphoid malignancies
Introduction
Clonal hematopoiesis (CH), defined by the presence of somatic genomic alterations in the blood cells of individuals without a hematologic malignancy, increases in prevalence with age1–5. Clonal hematopoiesis of indeterminate potential (CHIP) is a subset of CH defined by a clonal population of blood cells bearing a point mutation or short insertion/deletion with a variant allele fraction (VAF) ≥2% in a gene that is recurrently mutated in hematologic malignancies6–8. While CHIP has been associated with risk of myeloid malignancies9,10, mosaic chromosomal alterations (mCA) have been associated primarily with lymphoid malignancies4,5. To date, analyses of CHIP have largely focused on somatic variants in a subset of genes that are recurrently mutated in myeloid malignancies11,12. We hypothesized that CH may also be detectable in the lymphoid lineage and that it may contribute to risk of lymphoid malignancies13–16. Here, we distinguished lymphoid and myeloid CH by analyzing somatic point variants and mCAs identified in peripheral blood using whole-exome sequences and SNP-array intensity data in the UK Biobank (UKB). Lymphoid and myeloid CH predicted malignancies of their respective lineages with stark specificity. Integrating CHIP and mCAs together with peripheral blood count parameters enabled identification of individuals at the highest risk of developing myeloid and lymphoid malignancies. The distinct categories of genetic abnormalities classified in this study can be easily incorporated into next generation sequencing assays, enabling screening and monitoring of individuals at high risk of developing malignancies.
Results
Identification of myeloid and lymphoid CHIP
We examined somatic variants in both myeloid and lymphoid driver genes using whole-exome sequencing (WES) data from 46,706 unrelated individuals aged 40 to 70 years (median=58 years) with no prior hematologic malignancy diagnosis in the UKB17 (Methods). We first collated a list of 235 genes that are recurrently mutated in lymphoid malignancies18–30, which have not been examined systematically in the context of CHIP previously (Methods and Supplementary Table S1). In the WES data from UKB, we identified 597 individuals (1.3%) carrying 617 variants (referred to here as lymphoid CHIP, L-CHIP) (Methods, Supplementary Fig. S1, and Supplementary Table S2). In addition, we examined 56 genes known to drive CHIP and myeloid malignancies (Supplementary Table S1), and identified 2,708 individuals (5.8%) carrying 2,974 variants (referred to here as myeloid CHIP, M-CHIP) (Methods, Supplementary Fig. S1, and Supplementary Table S2). We found that the prevalence of L-CHIP was less common compared to M-CHIP; however, the prevalence of both M-CHIP and L-CHIP increased with age (Fig. 1a). Unlike M-CHIP, in which the top three genes DNMT3A, TET2, and ASXL1 were mutated in 87% of the individuals, L-CHIP variants were distributed more evenly across a larger number of genes, similar to the distribution of variants in the remaining M-CHIP genes (Fig. 1b).
Figure 1: CH with myeloid and lymphoid drivers stratify risk of lineage-specific malignancies.
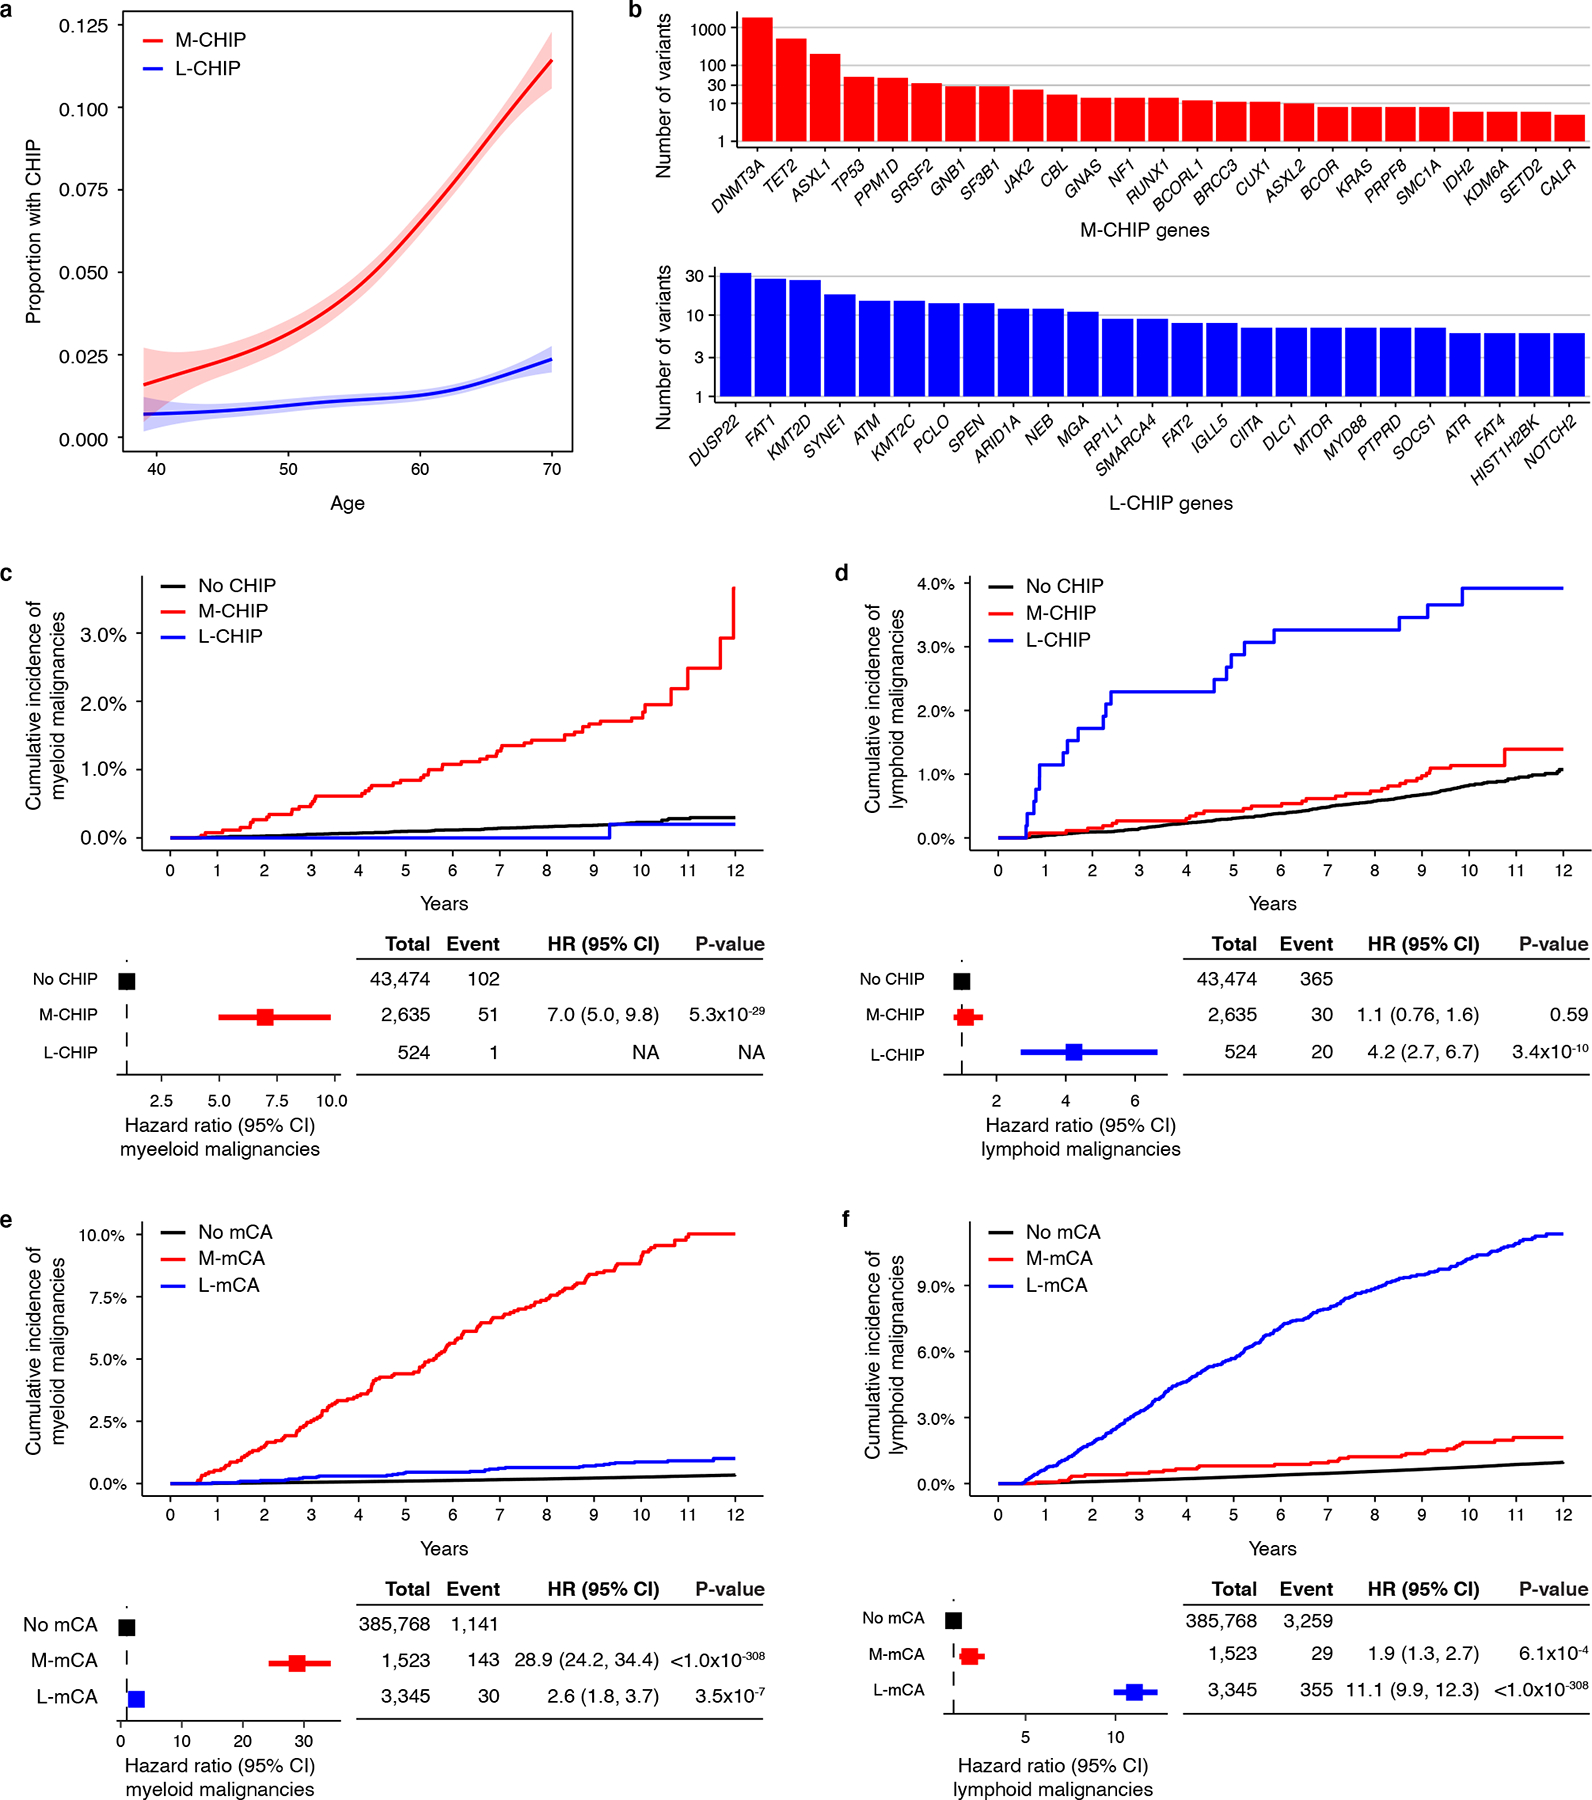
a) Prevalence of M-CHIP and L-CHIP increase with age. Data is fit with the general additive model using cubic regression splines and the shaded bands indicate the estimated 95% confidence interval. b) Frequencies of somatic variants detected in top 25 myeloid and lymphoid driver genes. c-d) M-CHIP and L-CHIP increase risk of myeloid and lymphoid malignancies, respectively. Individuals carrying both M-CHIP and L-CHIP (n=73) were excluded of whom five developed a myeloid malignancy and one developed a lymphoid malignancy. Hazard associated with L-CHIP for developing myeloid malignancies could not be computed due to small number of events. e-f) M-mCA and L-mCA increase risk of myeloid and lymphoid malignancies, respectively. Individuals carrying A-mCA and unclassified mCAs were excluded. The incidence curves are un-adjusted for covariates. (c-f) Data are presented as hazard ratio and 95% confidence intervals, computed by Cox proportional hazards model adjusting for age, sex, smoking, genetic ethnic ancestry, and genetic principal components 1–5. M-CHIP, CHIP with myeloid driver, L-CHIP, CHIP with lymphoid driver; M-mCA, mCA with myeloid driver; L-mCA, mCA with lymphoid driver; A-mCA, mCA with ambiguous driver; HR, hazard ratio; CI, confidence interval.
We next assessed the association of M-CHIP and L-CHIP with incident myeloid and lymphoid malignancies diagnosed between 6 months and 12 years after recruitment in the UKB (Methods). The median follow-up time was 10 years. In total, 159 individuals were diagnosed with a myeloid malignancy (median time to diagnosis=5.8 years), and 416 individuals with a lymphoid malignancy (median time to diagnosis=6.3 years). M-CHIP was associated with a higher incidence of myeloid malignancies (hazard ratio, HR=7.0; 95% confidence interval, CI=5.0–9.8; p-value, P<0.001) and L-CHIP was associated with a higher incidence of lymphoid malignancies (HR=4.2; CI=2.7–6.7; P<0.001) (Fig. 1c–d). Consistent with previous reports, larger clones conferred higher risk of malignancies (Extended Data Fig. 1). Myeloid versus lymphoid CHIP variants starkly distinguished the lineage of incident malignancies. Only one individual with L-CHIP developed a myeloid malignancy, and the individuals with M-CHIP had an equivalent risk of lymphoid malignancy as those without any CHIP variants. Among individuals with M-CHIP who developed lymphoid malignancies, the most frequently mutated genes were DNMT3A, TET2, and ASXL1, none of which were significantly associated with the incidence of lymphoid malignancies (Supplementary Fig. S2 and Supplementary Table S3). Individuals carrying both M-CHIP and L-CHIP (n=73) had a higher frequency of myeloid malignancies (n=5) compared to the lymphoid malignancies (n=1).
Identification of myeloid and lymphoid mCA
Next, we investigated the risk of myeloid and lymphoid malignancies associated with autosomal mCAs in the SNP-array intensity data from 400,452 individuals in the UKB4,5. While previous work4,5 has shown mCAs to increase the risk of lymphoid malignancies, we sought to categorize mCAs into those that might specifically increase the risk of myeloid malignancies, and others, of lymphoid malignancies. We first analyzed 892 mCAs detected in 546 individuals with a prevalent hematologic malignancy (Supplementary Table S4). Based on the differential frequencies of these mCAs in prevalent myeloid and lymphoid malignancies, we categorized the mCAs into myeloid (M-mCA) and lymphoid (L-mCA) (Methods). We refer to mCAs common to both malignancies as ambiguous drivers (A-mCA). We then analyzed the presence of these mCAs in 399,906 individuals with no prior hematologic malignancy diagnosis and identified 1,523 individuals with M-mCA, 3,345 with L-mCA, 1,278 with A-mCA, and 7,966 carried other unclassified mCAs (Supplementary Fig. S3 and Supplementary Table S5). We then examined the association between mCAs and risk of incident hematologic malignancies diagnosed between 6 months and 12 years after recruitment with a median follow-up of 11.1 years. In total, 1,408 individuals were diagnosed with a myeloid malignancy (median time to diagnosis=6.6 years), and 3,872 individuals with a lymphoid malignancy (median time to diagnosis=6.3 years). M-mCA increased risk of myeloid malignancies (HR=28.9; CI=24.2–34.4; P<0.001), L-mCA increased risk of lymphoid malignancies (HR=11.1; CI=9.9–12.3; P<0.001), and A-mCA increased risk of both myeloid (HR=5.9; CI=4.0–8.8; P<0.001) and lymphoid malignancies (HR=5.8; CI=4.6–7.3; P<0.001) (Fig. 1e–f and Extended Data Fig. 1). All three types of M-mCAs studied - copy loss, copy gain, and copy neutral loss-of-heterozygosity (LOH) - were independently associated with risk of myeloid malignancies (HR=15.5 – 34.9) and lymphoid malignancies (HR=3.8 – 19.3) (Extended Data Fig. 2). LOH alterations constituted the largest fraction of L-mCA; however, were only weakly associated with the risk of lymphoid malignancies.
Association with types of hematologic malignancies
The panel of genes that we have used to define L-CHIP and M-CHIP draw upon genes implicated in a variety of hematologic malignancies of their respective lineages. We next sought to investigate events that drive specific subtypes of myeloid and lymphoid malignancies. Frequencies of acute myeloid leukemia (AML), myelodysplastic syndrome (MDS), and myeloproliferative neoplasms (MPN) were each higher among individuals with M-CHIP and M-mCA (Fig. 2 and Supplementary Fig. S4). Among lymphoid malignancies, L-CHIP and L-mCA were most powerfully associated with increased risk of CLL and small lymphocytic lymphoma (SLL), consistent with the proclivity of CLL cells to circulate in peripheral blood relative to other lymphoid malignancy subtypes. In addition, L-mCA was associated with various subtypes of the more common lymphoid malignancies such as diffuse large B-cell lymphoma (DLBCL) and follicular lymphoma, as well as rarer lymphoid malignancies with circulating components and unspecified non-Hodgkin’s lymphoma (Extended Data Fig. 3). However, the L-mCA conferred lower risk of subtypes compared to that for CLL (HR=1.85–8.4 vs HR=68.6 for CLL/SLL) (Extended Data Fig. 3). Association between L-CHIP and other lymphoid malignancy subtypes could not be tested due to small sample size.
Figure 2: CH detected prior to the diagnosis of hematologic malignancies in WES cohort.
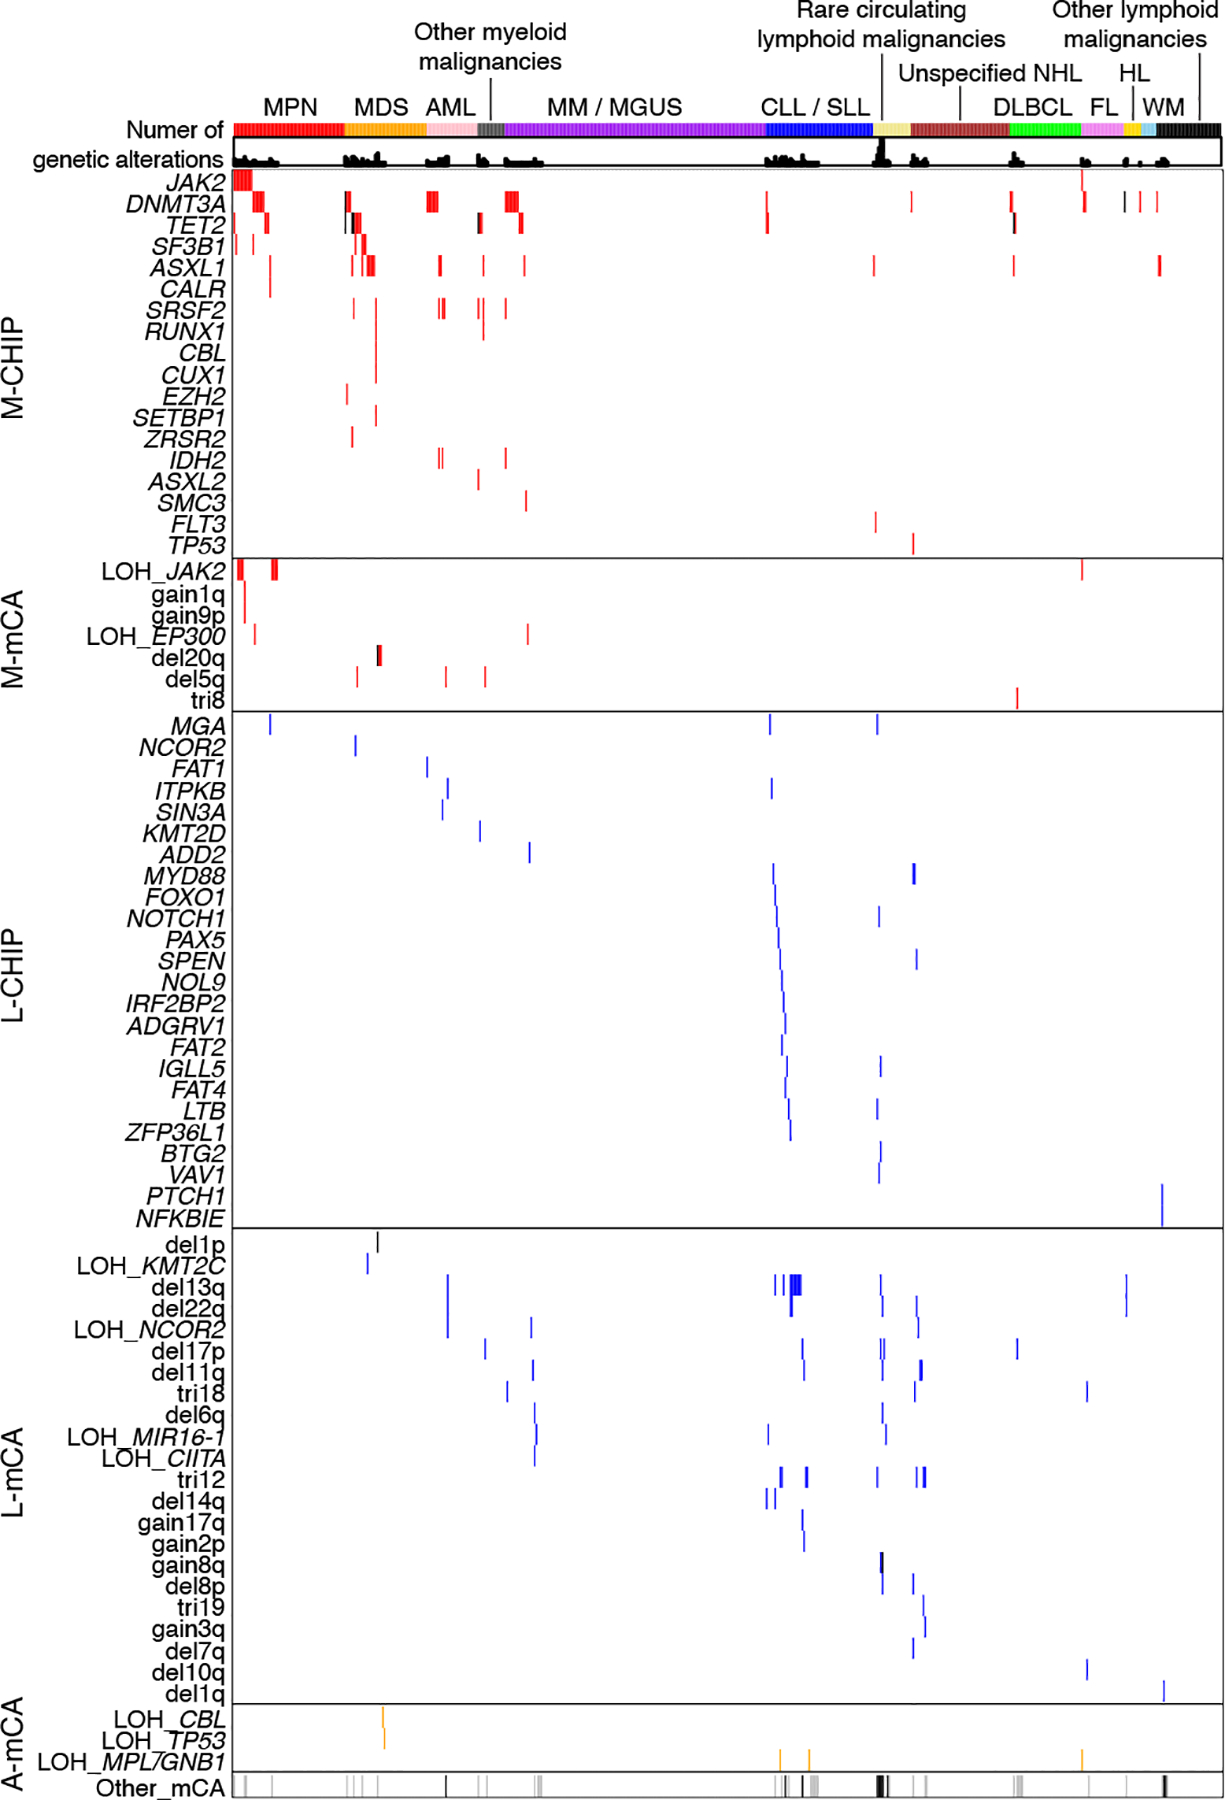
Rows indicate CHIP genes or mCAs, columns indicate individuals who developed hematologic malignancy between 6 months and 12 years after blood sample collection for sequencing (n=579), and the shells indicate number of CH alterations. The individuals are grouped by the type of first diagnosis of hematologic malignancies. Only CHIP genes and mCAs detected among individuals with an incident hematologic malignancy are shown. LOH, copy-neutral loss-of-heterozygosity; del, copy loss (deletion); gain, copy gain; tri, trisomy (gain of whole chromosome); MPN, myeloproliferative neoplasm; MDS, myelodysplastic syndrome; AML, acute myeloid leukemia; CLL, chronic lymphocytic leukemia; SLL, small lymphocytic lymphoma; MM, multiple myeloma; MGUS, monoclonal gammopathy of undetermined significance; NHL, non-Hodgkin’s lymphoma; DLBCL, diffuse large B-cell lymphoma; FL, follicular lymphoma; WM, Waldenstrom’s macroglobulinaemia; HL, Hodgkin’s lymphoma.
Despite a significantly higher relative risk of myeloid and lymphoid malignancies among individuals with CHIP and mCA as compared to those without, the absolute incidence of these malignancies was low. In the UKB cohort, the rate of myeloid malignancies increased from 0.02–0.03% per year among individuals with no CH to 0.17% and 0.82% per year among individuals with M-CHIP and M-mCA, respectively (Supplementary Table S8). Similarly, the rate of CLL/SLL increased from 0.01% per year among individuals with no CH to 0.22% and 0.60% per year among individuals with L-CHIP and L-mCA, respectively (Supplementary Table S8).
Replication in the Mass General Brigham Biobank
Next, we sought to evaluate the reproducibility of our findings in an independent cohort, the Mass General Brigham Biobank (MGBB). We analyzed somatic variants in WES from 8,677 individuals aged 18 to 92 years (median=48 years) and mCAs in 20,517 individuals aged 18 to 105 years (median=57 years). All individuals with prior hematologic malignancy diagnosis were excluded. In total, L-CHIP was detected in 128 individuals (1.5%) and M-CHIP was detected in 431 individuals (5.0%) (Supplementary Table S6). The distribution of mutated M-CHIP and L-CHIP genes were similar in MGBB and UKB, and the prevalence of both M-CHIP and L-CHIP increased with age (Extended Data Fig. 4). The association between CHIP and hematologic malignancies could not be tested due to small sample size (n=3 incident myeloid malignancies, n=7 incident lymphoid malignancies). In comparison to the UKB cohort, the MGBB WES cohort was smaller (n=8,677 vs 46,706), had younger participants (median age=48 years vs 56 years), and had a shorter follow-up period (median follow-up=2.9 years vs 10 years).
To distinguish myeloid and lymphoid mCAs in the MGBB cohort, we analyzed 1,542 autosomal mCAs identified in 1,212 individuals (5.9%)31. We identified 158 individuals with M-mCA, 349 with L-mCA, 131 with A-mCA, and 574 with unclassified mCAs (Methods and Supplementary Table S7). Next, we examined the association between the categories of mCAs and hematologic malignancies diagnosed between 6 months and 5.5 years after DNA sample collection with a median follow-up of 3.1 years. Although the sample sizes were small, M-mCA and L-mCA were distinctly associated with lineage-specific malignancies (HR=16.5; CI=4.5–60.2, P<0.001 for M-mCA and myeloid malignancies, and HR=11.1; CI=4.3–28.7; P<0.001 for L-mCA and lymphoid malignancies) replicating the findings in the UKB cohort (Extended Data Fig. 4).
Co-occurrence of CHIP and mCAs
We analyzed the co-occurrence of CHIP and mCAs among individuals with both WES and SNP-array data (n=46,706) in the UKB. In total, 4,562 (9.8%) individuals carried at least one CHIP mutation or an mCA, and 562 (1.2%) carried multiple alterations (Extended Data Fig. 5). The mCAs were more frequent among individuals with M-CHIP (n=155, 5.7%) and L-CHIP (n=59, 9.9%) compared to those without CHIP (n=1,330, 3.1%). In 27 M-CHIP and 7 L-CHIP cases, mCAs overlapping the mutated genes were present (Supplementary Tables S2), and the majority of these were copy-neutral LOH, resulting in bi-allelic variants in specific driver genes (Extended Data Fig. 5).
Integration of CHIP and mCA calls enabled assessment of relative risk of malignancies associated with these alterations. CHIP variants and mCAs were independently associated with risk of malignancies (Extended Data Fig. 6). M-CHIP (HR=7.3; CI=5.1–10.4; P<0.001) and M-mCA (HR=17.8; CI=9.5–33.4; P<0.001) increased the risk of myeloid malignancies, and L-CHIP (HR=15.7; CI=7.3–33.8; P<0.001) and L-mCA (HR=28.6; CI=15.1–54.2; P<0.001) increased the risk of CLL/SLL. Since L-CHIP and L-mCA were associated most strongly with CLL/SLL, we assessed the risk of developing CLL/SLL separately from that of other lymphoid malignancies. For both myeloid malignancies and CLL/SLL, the mCAs conferred a greater degree of risk compared to that for CHIP variants (Extended Data Fig. 6). The risk was amplified among individuals with both a CHIP variant and an mCA (HR=102.6; CI=43.4–242.3; P<0.001 for myeloid malignancies and HR=66.9; CI=32.8–136.2; P<0.001 for CLL/SLL), also observed recently for secondary myeloid malignancies among solid tumor patients32. The presence of multiple alterations was associated with a higher risk for developing malignancies irrespective of the type of alterations (Extended Date Fig. 7), consistent with prior findings that multiple genetic abnormalities independently increase risk of malignancies9,10.
Integration with blood count parameters
Abnormal peripheral blood counts may herald the development of hematologic malignancies. We found that M-CHIP and M-mCA were associated solely with myeloid cell parameters (platelet, red blood cell, neutrophil, and monocyte counts), and that L-CHIP and L-mCA were associated with an elevated lymphocyte count (Extended Data Fig. 8). Indeed, a larger percentage of individuals with L-CHIP (4.4%) and L-mCA (8.6%) had elevated lymphocyte counts compared to those without genetic alterations (0.3–0.4%) (Supplementary Table S9). Associations of L-CHIP and L-mCA with lymphocyte count and CLL/SLL may indicate an overlap with monoclonal B-cell lymphocytosis (MBL)33 which could not be assessed in this study.
We next evaluated whether the presence of abnormal peripheral blood counts would add further predictive power, beyond CHIP and mCAs, for identifying individuals at highest risk of developing hematologic malignancies. Independent of CH, abnormal myeloid cell parameters were associated with increased risk of myeloid malignancies (HR=3.7; CI=2.6–5.4; P<0.001 for elevated myeloid cell parameters, and HR=6.3; CI=4.2–9.6; P<0.001 for low myeloid cell parameters), and elevated lymphocyte count was associated with risk of CLL/SLL (HR=264.8; CI=151.3–463.6; P<0.001) (Extended Data Fig. 9). To integrate CHIP and mCA with CBC parameters, we stratified the UKB cohort based on CBC parameters, type and number of genetic alterations, and clone size (Methods). In both lineages, abnormal CBC increased the risk of malignancies even when no genetic alterations were detected (HR=3.2; CI=2.1–4.9; P<0.001 for myeloid malignancies, and HR=60.3; CI=24.6–148.0; P<0.001 for CLL/SLL); however, the risk was substantially higher in presence of genetic alterations (Fig. 3a–b). Individuals with abnormal myeloid cell parameters and multiple genetic abnormalities had the highest risk of developing myeloid malignancies (HR=124.6; CI=70.4–220.5; P<0.001) (Fig. 3a and Supplementary Fig. S5), consistent with previous studies34. In the lymphoid lineage, elevated lymphocyte counts powerfully amplified the risk of CLL/SLL, and the presence of L-CHIP or L-mCA further increased the risk of CLL/SLL (HR range, 595.8–767.0) (Fig. 3b and Supplementary Fig. S5). Integrating these data, we developed regression models to predict risk of developing myeloid malignancies and CLL or SLL (Methods). In the 10-fold cross-validation, the area under the receiver operating characteristic (ROC) curves (AUC) were 0.781 for myeloid malignancy prediction and 0.835 for CLL/SLL prediction (Fig. 3c–d and Supplementary Fig. S6).
Figure 3: CH and CBC parameters predict the risk of developing myeloid malignancies and CLL/SLL.
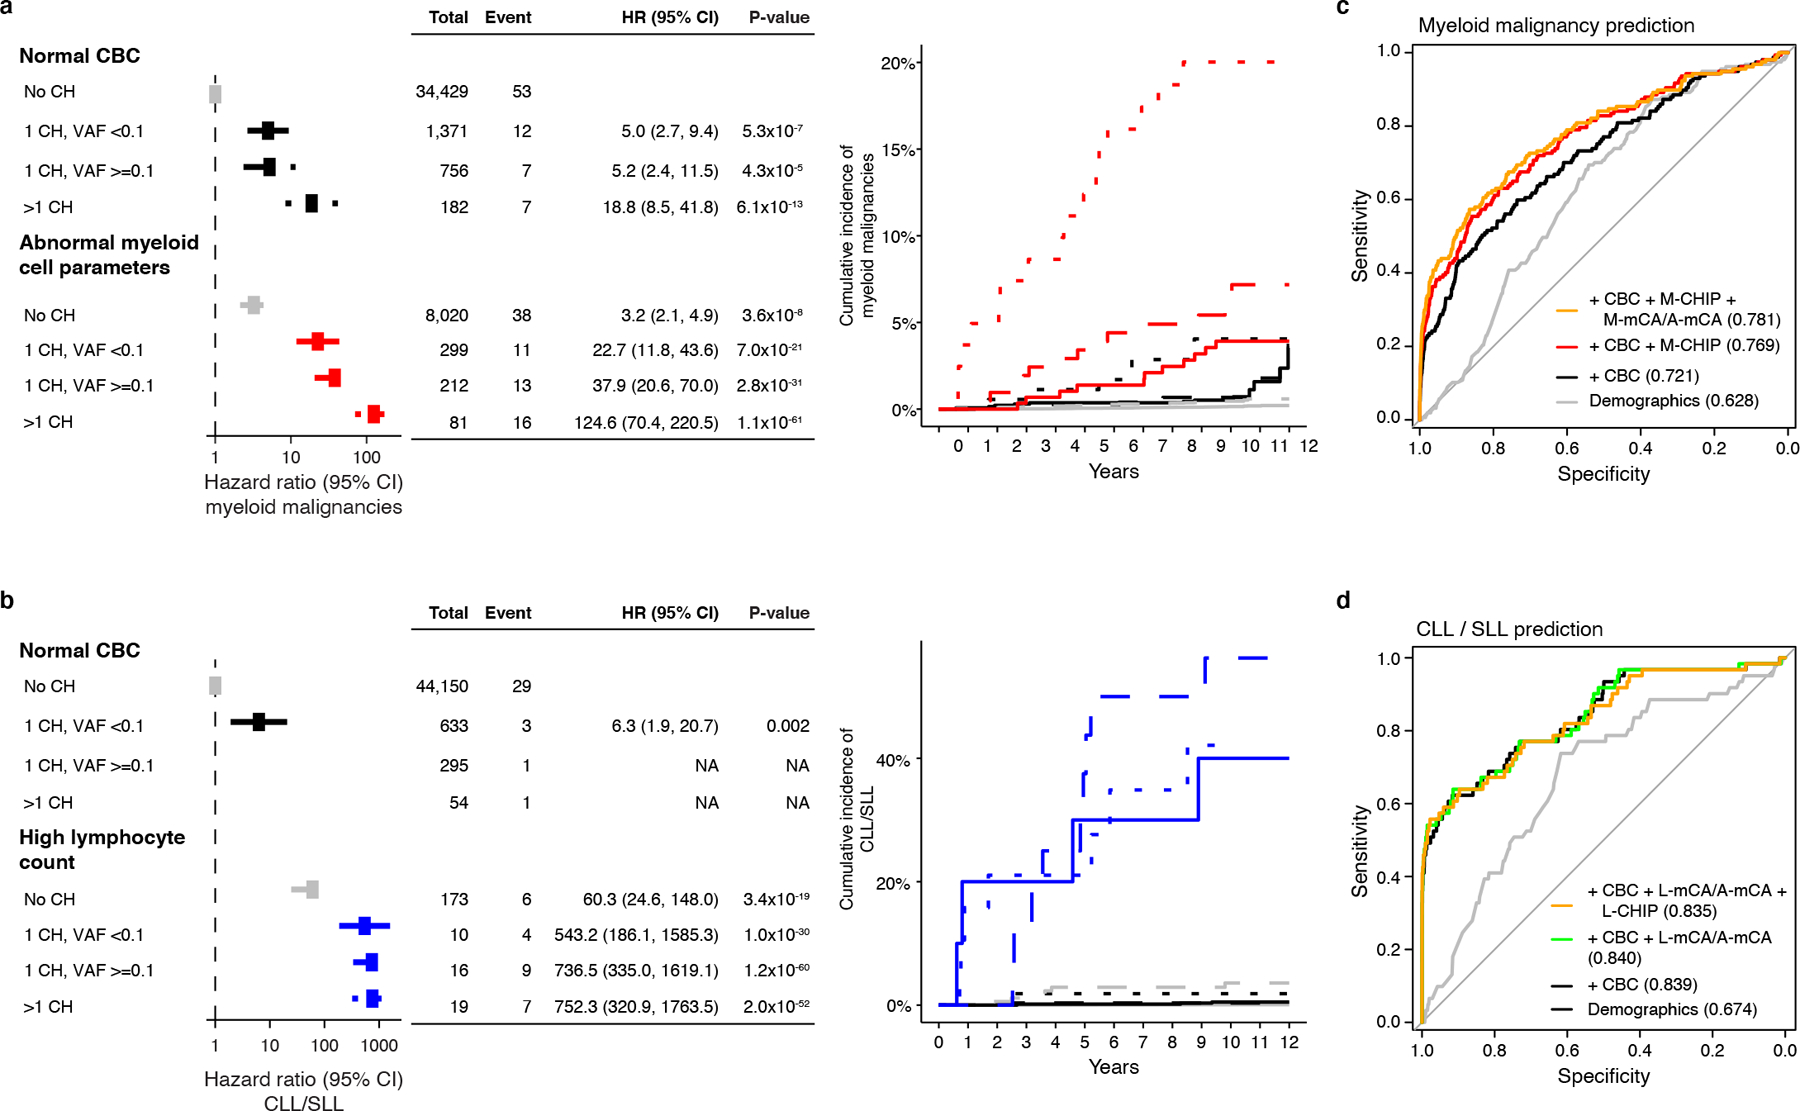
a) CH with myeloid drivers (M-CHIP, M-mCA, or A-mCA) and abnormal myeloid cell parameters increase risk of myeloid malignancies. b) CH with lymphoid drivers (L-CHIP, L-mCA, or A-mCA) and high lymphocyte count increase risk of CLL/SLL. Hazards associated with groups with <3 events were not computed. (a-b) Data are presented as hazard ratio and 95% confidence intervals, computed by Cox proportional hazards model adjusting for age, sex, smoking, genetic ethnic ancestry, and genetic principal components 1–5. c) Sensitivity and specificity curves for predicting the incidence of myeloid malignancies computed by 10-fold cross-validation. Individuals with a diagnosis of myeloid malignancy (n=157) and those that did not have a diagnosis of myeloid or lymphoid malignancies (n=44781) were used for training and testing. d) Sensitivity and specificity curves for predicting the incidence of CLL/SLL computed by 10-fold cross-validation. Individuals with a diagnosis of CLL or SLL (n=61) and those that did not have a diagnosis of myeloid or lymphoid malignancies (n=44781) were used for training and testing. (c-d) Baseline predictor included demographic characteristics (age, sex, smoking status, and genetic ethnic ancestry). CHIP (number of CHIP variants and maximum VAF), mCA (number of alterations and maximum cell fraction), and CBC were added as predictors together with demographic characteristics. The values inside the parentheses indicate the AUC. Since A-mCA were associated with risk of both myeloid and lymphoid malignancies, these are combined with M-mCA in the analysis of myeloid malignancies and with L-mCA in the analysis of lymphoid malignancies. HR, hazard ratio; CI, confidence interval; CLL, chronic lymphocytic leukemia; SLL, small lymphocytic lymphoma; CBC, complete blood count; VAF, variant allele fraction; AUC, area under the curve.
Association with mortality and coronary artery disease
CHIP has been associated with increased risk not only of hematologic malignancies but also of mortality and coronary artery disease (CAD)1,2,12,35. We examined the types of genetic lesions in the UKB and confirmed that large M-CHIP clones are associated with increased all-cause-mortality (HR=1.60; CI=1.29–1.98; P<0.001) and increased risk of CAD (HR=1.35; CI=1.09–1.66; P=0.005), but L-CHIP was not associated with either mortality (HR=1.16; CI=0.67–2.01; P=0.591) or CAD (HR=0.93; CI=0.54–1.61; P=0.80) (Extended Data Fig. 10). All mCA categories were associated with increased mortality (HR range, 1.23–1.58; P<0.001), but L-mCA was not associated with mortality unrelated to hematologic malignancies (HR=1.08; CI=0.94–1.23; P=0.27).
Discussion
In this study, we distinguished CHIP with lymphoid drivers versus myeloid drivers, and mCA with lymphoid drivers versus myeloid drivers. We demonstrated that lymphoid CHIP in apparently healthy individuals is associated with age and risk of lymphoid malignancies. By integrating CHIP and mCA in respective lineages with peripheral blood counts, we estimated the risk of developing myeloid and lymphoid malignancies. Our results show that specific genetic abnormalities detected in the peripheral blood, in combination with complete blood count parameters, powerfully predict the development of myeloid malignancies and CLL/SLL.
Our finding that myeloid and lymphoid CH vary in the risk not only of lineage-specific malignancies but also non-malignant phenotypes suggests that CH alterations may alter the biology of blood cells in a cell type-specific manner. L-CHIP was not associated with CAD, but pre-malignant somatic variants in the lymphoid lineage could conceivably impact the risk of clinical phenotypes in which the adaptive immune system plays an important role, such as autoimmunity15 and infections31. Furthermore, the extent to which somatic variants classified as myeloid versus lymphoid in this study are distributed beyond their respective cell-lineages, such as the influence of M-CHIP on the biology of lymphoid cells36, remains to be explored.
An important goal in the field of clonal hematopoiesis is the identification of individuals at the highest risk of developing specific hematologic malignancies. To that end, the genetic abnormalities identified in this study, which can easily be incorporated into next generation sequencing assays, together with readily available peripheral blood count data, may enable screening and monitoring of individuals at high risk of developing malignancies. The development of therapeutic interventions for individuals with high risk pre-malignant states may ultimately enable the delay or prevention of hematologic malignancies.
Methods
Study cohort
The UKB cohort consists of >500,000 participants aged 40–70 years recruited between 2006–2010. Biological specimens and health related information were collected at the time of recruitment and prospectively followed by linking the national health records17. In this study, we included unrelated participants, 400,452 with SNP-array data of whom 46,706 also had WES data37. The third-degree relatives identified using the Kinship-based INference for Genome-wide association studies (KING)38 were excluded. Among the related pairs, individuals with available WES, or older participants were selected. Individuals with a diagnosis of hematologic malignancy prior to or within six months of recruitment were excluded. Further, individuals with missing covariates used in this study were excluded. The analyses were conducted under the UKB application number 50834. The phenotypes were derived from the appearance of qualifying International Statistical Classification of Diseases and Related Health Problems (ICD) codes in the subject’s medical record. The follow-up occurred through March 2020 for inpatient diagnosis, cancer register, and death register. The ICD codes used to ascertain the phenotypes are listed in Supplementary Table S10.
In the MGBB cohort, we analyzed data from 20,530 individuals with SNP-array data and 8,677 individuals with WES39. Individuals with a diagnosis of hematologic malignancy prior to or within six months of DNA collection were excluded. The third-degree relatives identified using the Kinship-based INference for Genome-wide association studies (KING)38 were excluded. The phenotypes were derived based on the incident ICD9 and ICD10 codes which were verified by manual chart review.
Detection of CHIP from the whole exome sequences
Somatic variants in the WES were identified on each sample using the Mutect240. To limit germline variants and potential artifacts, we used Genome Aggregation Database (gnomAD)41 as a germline reference and a panel-of-normal (PON) derived from WES of 100 youngest individuals in the cohort, aged 40 years in the UKB and aged 21 years or younger in the MGBB. Variants were excluded if the sequencing depth at variant site was <20, number of reads supporting variant allele was <3, variant allele fraction (VAF) was <0.02, or gnomAD allele frequency was ≥0.001. We required at least 1 read in both forward and reverse direction supporting the reference and variant alleles. Variants with observed frequency >1% in the analyzed cohort, or VAF≥0.35 were excluded unless previously reported to be somatic and involved in hematologic malignancies. Insertions and deletions in homopolymer regions were included only if the number of reads supporting alternate allele was ≥10 and VAF ≥0.1. The remaining variants were manually curated to filter out potential artifacts.
To identify M-CHIP, somatic variants in 56 genes known to drive CHIP and myeloid malignancies were identified11,12,42 (Supplementary Table S1). To identify L-CHIP, we queried 235 genes recurrently mutated in mature lymphoid neoplasms and absent in the M-CHIP gene set. These genes were selected based on reported mutational frequency at diagnosis and contribution to disease pathogenesis, molecular classification, and clinical risk stratification within prevalent lymphoma subtypes, including CLL18,19,43, DLBCL20,21,44, follicular lymphoma22,23,45, mantle cell lymphoma24,25,46, marginal zone lymphoma26, Hodgkin lymphoma27,28,47,48, and peripheral T-cell lymphoma29,30,49–51. A complete list of publications used to curate the L-CHIP genes are listed in Supplementary Table S11. Pathogenic variants in lymphoid driver genes were curated from the cBioPortal52 (Supplementary Table S1). Additionally, somatic variants altering the canonical protein sequences encoded by the queried genes were included as putative markers of CH. To reduce artifacts and germline variants, restrictive thresholds were applied for the putative markers (number of reads supporting variant allele ≥5, number of reads in forward and reverse direction ≥2, VAF ≤0.2). Together, all pathogenic variants and putative markers in lymphoid driver genes are referred to as L-CHIP.
The average depth of sequencing exceeds 20x at 95.2% of the sites in the UKB WES and 85% of the sites in the MGBB WES. In the UKB cohort, we estimated the depth of sequencing per gene based on randomly sampled 2,000 WES. Read depth at each position included in the target intervals were computed using Samtools (v1.7)53. For each sample, average sequencing depth per gene was estimated by averaging the depth across the targeted regions of the gene. Finally, the 25th, 50th (median), and 75th percentiles of the average depth per gene were computed across all 2,000 samples (Supplementary Table S12).
Identification of myeloid and lymphoid mCAs
The mCAs identified from the SNP-array data available as returned data ‘Return 3094’ were obtained from the UKB4,5. In the MGBB, the mCAs were identified using the MoCha algorithm (https://github.com/freeseek/mocha) and were obtained from the authors31. The mCAs were annotated based on the estimated break-points and relevance to hematologic malignancies using the cBioPortal for cancer genomics52 and the atlas of genetics and cytogenetics in oncology and haematology54 (Supplementary Table S5). Next, the mCAs detected in myeloid and lymphoid malignancies diagnosed before recruitment or within six months of recruitment were used to identify myeloid and lymphoid driver mCA (Supplementary Table S4). Rare mCAs present in less than three individuals diagnosed with malignancies were not analyzed. The frequencies of mCAs in myeloid and lymphoid malignancies were adjusted for the total number of individuals with myeloid (157) and lymphoid (348) malignancies. The log ratio (LR) of the adjusted frequencies in myeloid malignancies to the adjusted frequencies in lymphoid malignancies were computed for each mCA. The mCAs with LR ≥ 1 (more common in myeloid malignancies) were classified as M-mCA (myeloid), those with LR ≤ −1 (more common in lymphoid malignancies) were classified as L-mCA (lymphoid), and those with LR between −1 and 1 were classified as A-mCA (ambiguous). In addition, individuals carrying both M-mCA and L-mCA were grouped as A-mCA. In total, 1,523 individuals with M-mCA, 3,345 with L-mCA, and 1,278 with A-mCA were identified. The remaining mCAs could not be classified into any of these groups. In total, 7,966 individuals carried unclassified mCAs which included the mCAs for which copy changes were unknown.
The mCAs identified in the MGBB were previously identified31. The myeloid and lymphoid driver mCAs were identified based on the LR scores derived from the UKB dataset. In total, we identified 158 individuals with M-mCA, 349 with L-mCA, 131 with A-mCA, and 574 with unclassified mCAs (Supplementary Table S7).
Stratification by blood count parameters
The UKB participants were stratified into five categories based on the complete blood count (CBC) parameters measured at recruitment. The categories were
High myeloid cell parameters: individuals with thrombocytosis (platelet count >397.1×10⁹ cells/liter), polycythemia (red blood cell count >5.5×10¹² cells/liter), or elevated neutrophil count (>7.06×10⁹ cells/liter).
Low myeloid cell parameters: individuals with thrombocytopenia (platelet count <169.06×10⁹ cell/liter), anemia (red blood cell count <3.96×10¹² cell/liter), or neutropenia (neutrophil count <1.47×10⁹ cells/liter).
Lymphocytosis: individuals with elevated lymphocyte counts (>4.25×10⁹ cells/liter).
Lymphopenia: individuals with low lymphocyte counts (<0.65×10⁹ cells/liter).
Normal CBC: individuals who did not qualify in any of the above groups.
The range of normal CBC parameters were derived from the UKB hematology data companion document available at https://biobank.ndph.ox.ac.uk/showcase/showcase/docs/haematology.pdf.
Prediction of myeloid malignancies and CLL/SLL
By integrating CHIP, mCA, and CBC, regression models were trained to predict the risk of myeloid malignancies and CLL/SLL. The baseline model consisted of demographic information (age, sex, smoking status, and ethnic ancestry derived from the genotypes). Different combinations of CHIP, mCA, and CBC were added to the baseline model to estimate predictive power of these features. For CHIP, two variables were used – number of CHIP variants and the maximum VAF of the CHIP variants. For mCA, the number of mCAs (M-mCA + A-mCA for myeloid malignancy prediction and L-mCA + A-mCA for CLL/SLL prediction) and the maximum cell fraction were used. Five variables representing the CBC parameters were used – lymphocyte count, neutrophil count, red blood cell count, platelet count, and a categorical feature representing the stratification of CBC described above. The performance of the prediction models was estimated by 10-fold cross-validation approach.
Statistical analyses
All statistical analyses were performed using the R version 3.4.4 (R Foundation for Statistical Computing, Vienna, Austria)55 and the figures were generated with ggplot2 package in R56. The associations between CH and hematologic malignancies were fitted using Cox proportional hazard model. All models were adjusted for age (represented as deciles), sex (male or female), ever smoking status (yes or no), genetic ethnic ancestry (Caucasian or others), and genetic principal components (PC1–5). Additional covariates (body mass index, hypertension, and type 2 diabetes mellitus) were included in the Cox model for association analysis with CAD. The samples were followed-up from the time of recruitment. Since a fraction of samples for WES were selected based on available magnetic resonance imaging (MRI) data37, the follow-up start time for mortality analysis was adjusted to the time of MRI (if available), to eliminate immortal time bias57. The subjects who did not experience events were censored at the end of follow-up. For modelling hematologic malignancies and CAD, the subjects who died prior to the end of follow-up but did not experience events of interest, were censored at death. The association between CH and CBC parameters were performed by linear regression stratified by sex and adjusting for age, ever smoking status, genetic ethnic ancestry, and genetic principal components 1–5. Prior to linear regression, the CBC parameters were quantile normalized. The associations with p-value <0.05 were considered statistically significant.
Data Availability
The source data are available to the approved researchers through the UK Biobank and Mass General Brigham Biobank. The data generated in this study, including the somatic variants and chromosomal alterations, are available as Supplementary Materials which will be submitted to the respective biobanks to enable linking with individual-level data and sharing with other approved researchers. Usage of these data will be covered by the data use agreements with the respective biobanks and no additional restrictions apply. Individual-level MGBB data are available from https://personalizedmedicine.partners.org/Biobank/Default.aspx, but restrictions apply to the availability of these data, which were used under institutional review board (IRB) approval for the current study, and so are not publicly available. Individual-level UK Biobank data are available for approved researchers from https://www.ukbiobank.ac.uk. The present article includes all other data generated or analyzed during this study. Additional databases used in this study are: Genome Aggregation Database (gnomAD, https://gnomad.broadinstitute.org), cBioPortal for cancer genomics (https://www.cbioportal.org), the atlas of genetics and cytogenetics in oncology and haematology (http://atlasgeneticsoncology.org).
Code Availability
The workflow to identify somatic variants from alignment bam files are available in WDL format in github (https://github.com/gatk-workflows/gatk4-somatic-snvs-indels). Custom codes were used to process and analyze the data and generate figures which are available upon request from the authors or in GitHub (https://github.com/abhisheknrl/myeloid_lymphoid_CH).
Extended Data
Extended Data Fig. 1. Expanded CH clones confer higher risk of malignancies.
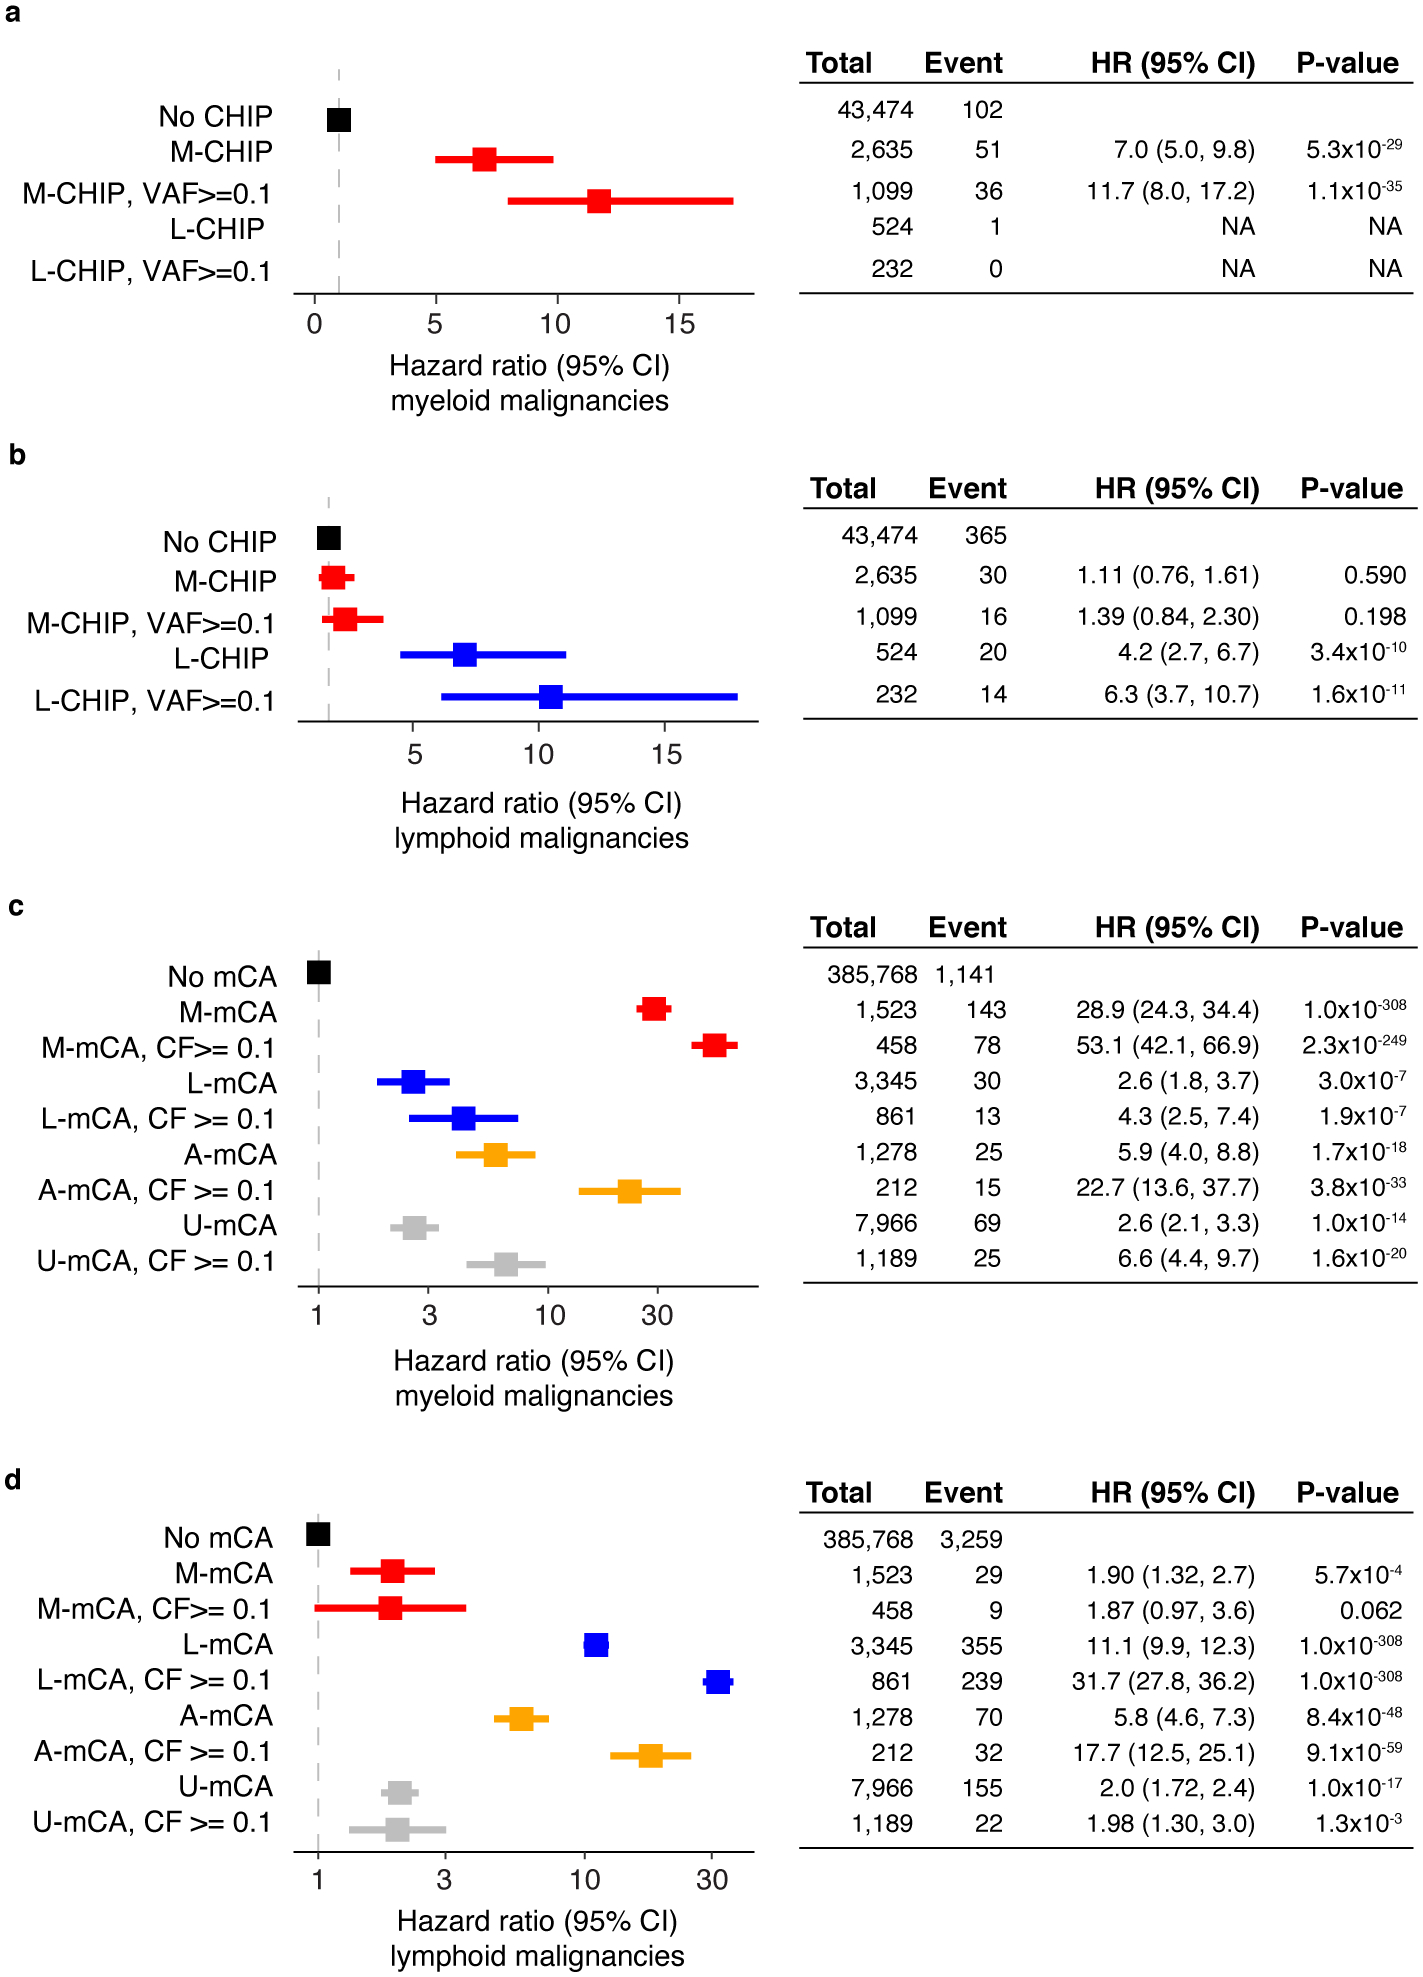
a-b) M-CHIP and L-CHIP are associated with incident myeloid and lymphoid malignancies, respectively. Hazards associated with L-CHIP for developing myeloid malignancies could not be computed due to small number of events. c-d) The mCAs increase risk of myeloid and lymphoid malignancies, respectively. The M-mCA and L-mCA are associated with the highest risk of malignancies in the respective lineages. In all cases, expanded CH clones had higher risk of developing malignancies. (a-d) Data are presented as hazard ratio and 95% confidence intervals, computed by using Cox proportional hazards model adjusting for age, sex, smoking, genetic ethnic ancestry, and genetic principal components 1–5. HR, hazard ratio; CI, confidence interval; VAF, variant allele fraction; CF, cell fraction; U-mCA, unclassified mCA.
Extended Data Fig. 2. Association of between the types of mCA and hematologic malignancies.
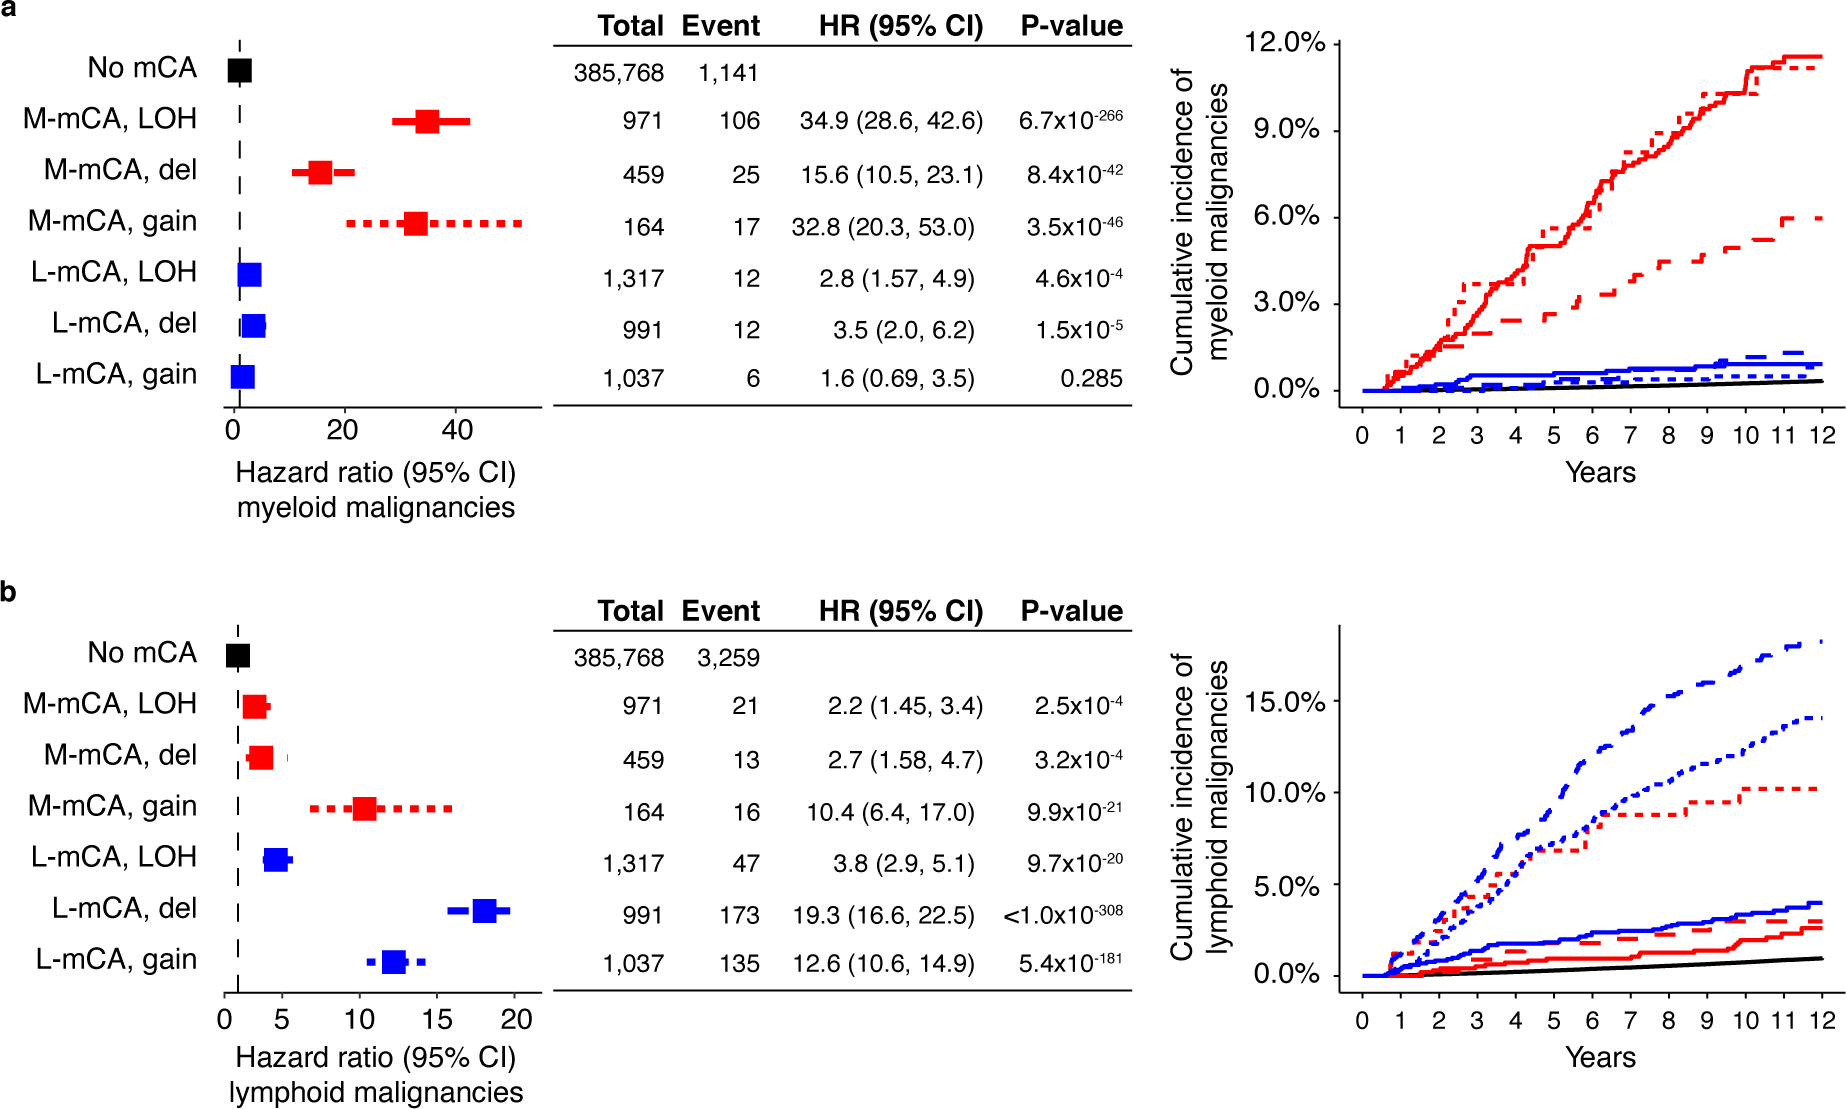
All three categories of mCAs copy loss, copy gain, and copy neutral loss-of-heterozygosity are associated with the risk of a) myeloid malignancies, and b) lymphoid malignancies. (a-b) Data are presented as hazard ratio and 95% confidence intervals, computed by Cox proportional hazards model adjusting for age, sex, smoking, genetic ethnic ancestry, and genetic principal components 1–5. LOH, loss-of-heterozygosity; del, copy loss (deletion); gain, copy gain; HR, hazard ratio; CI, confidence interval.
Extended Data Fig. 3. Association between CH and sub-types of myeloid and lymphoid malignancies.
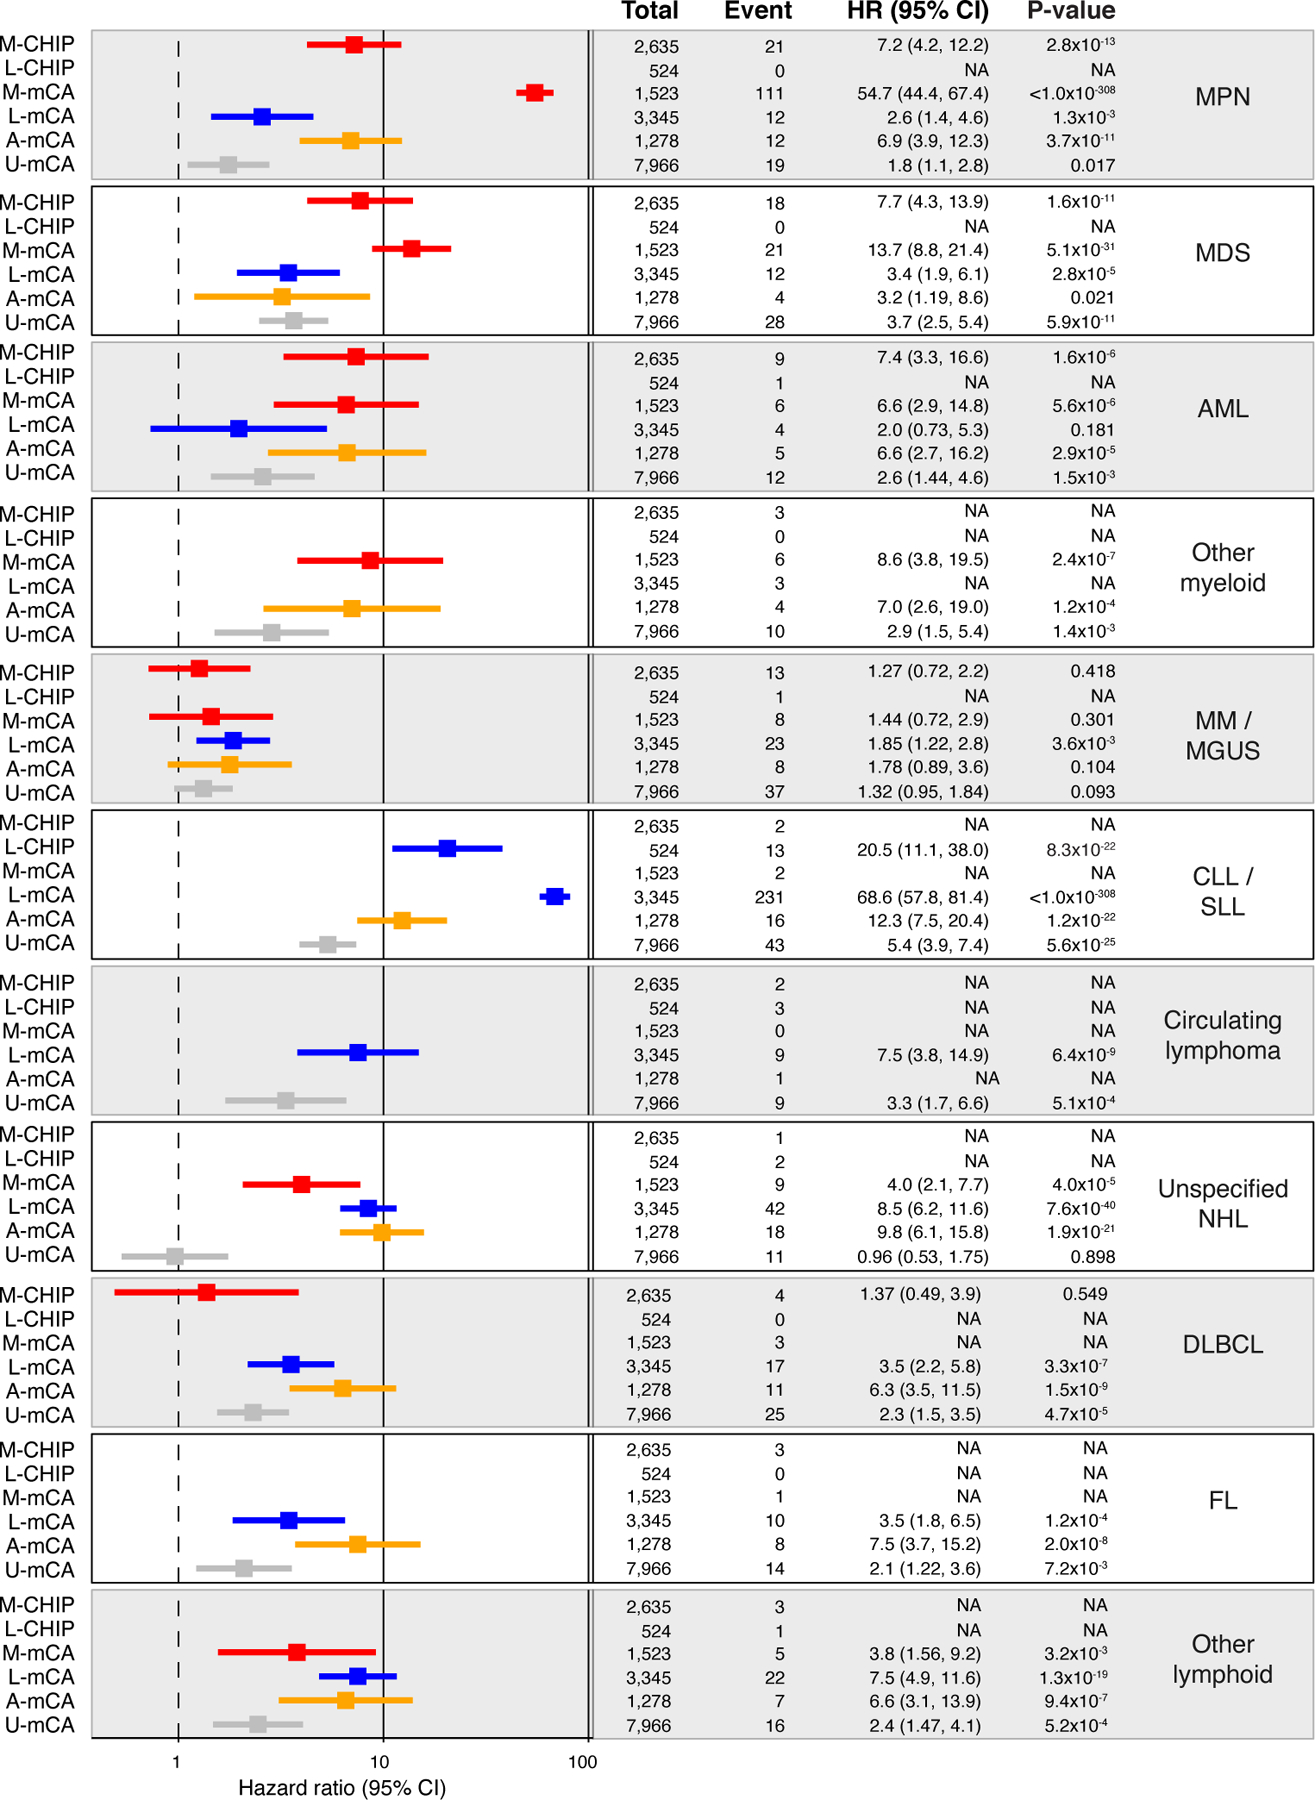
Data are presented as hazard ratio and 95% confidence intervals, computed by Cox proportional hazards model adjusting for age, sex, smoking, genetic ethnic ancestry, and genetic principal components 1–5. Groups with less than <4 events were excluded from the Cox model. MDS, myelodysplastic syndrome; AML, acute myeloid leukemia; MPN, myeloproliferative neoplasms; CLL, chronic lymphocytic leukemia; SLL, small lymphocytic lymphoma; MM, multiple myeloma; MGUS, monoclonal gammopathy of undetermined significance; NHL, non-Hodgkin’s lymphoma; DLBCL, diffuse large B-cell lymphoma; FL, follicular lymphoma; WM, Waldenstrom’s macroglobulinaemia; HL, Hodgkin’s lymphoma; U-mCA, unclassified mCAs.
Extended Data Fig. 4. Myeloid and lymphoid CHIP and mCAs identified in the MGBB cohort.
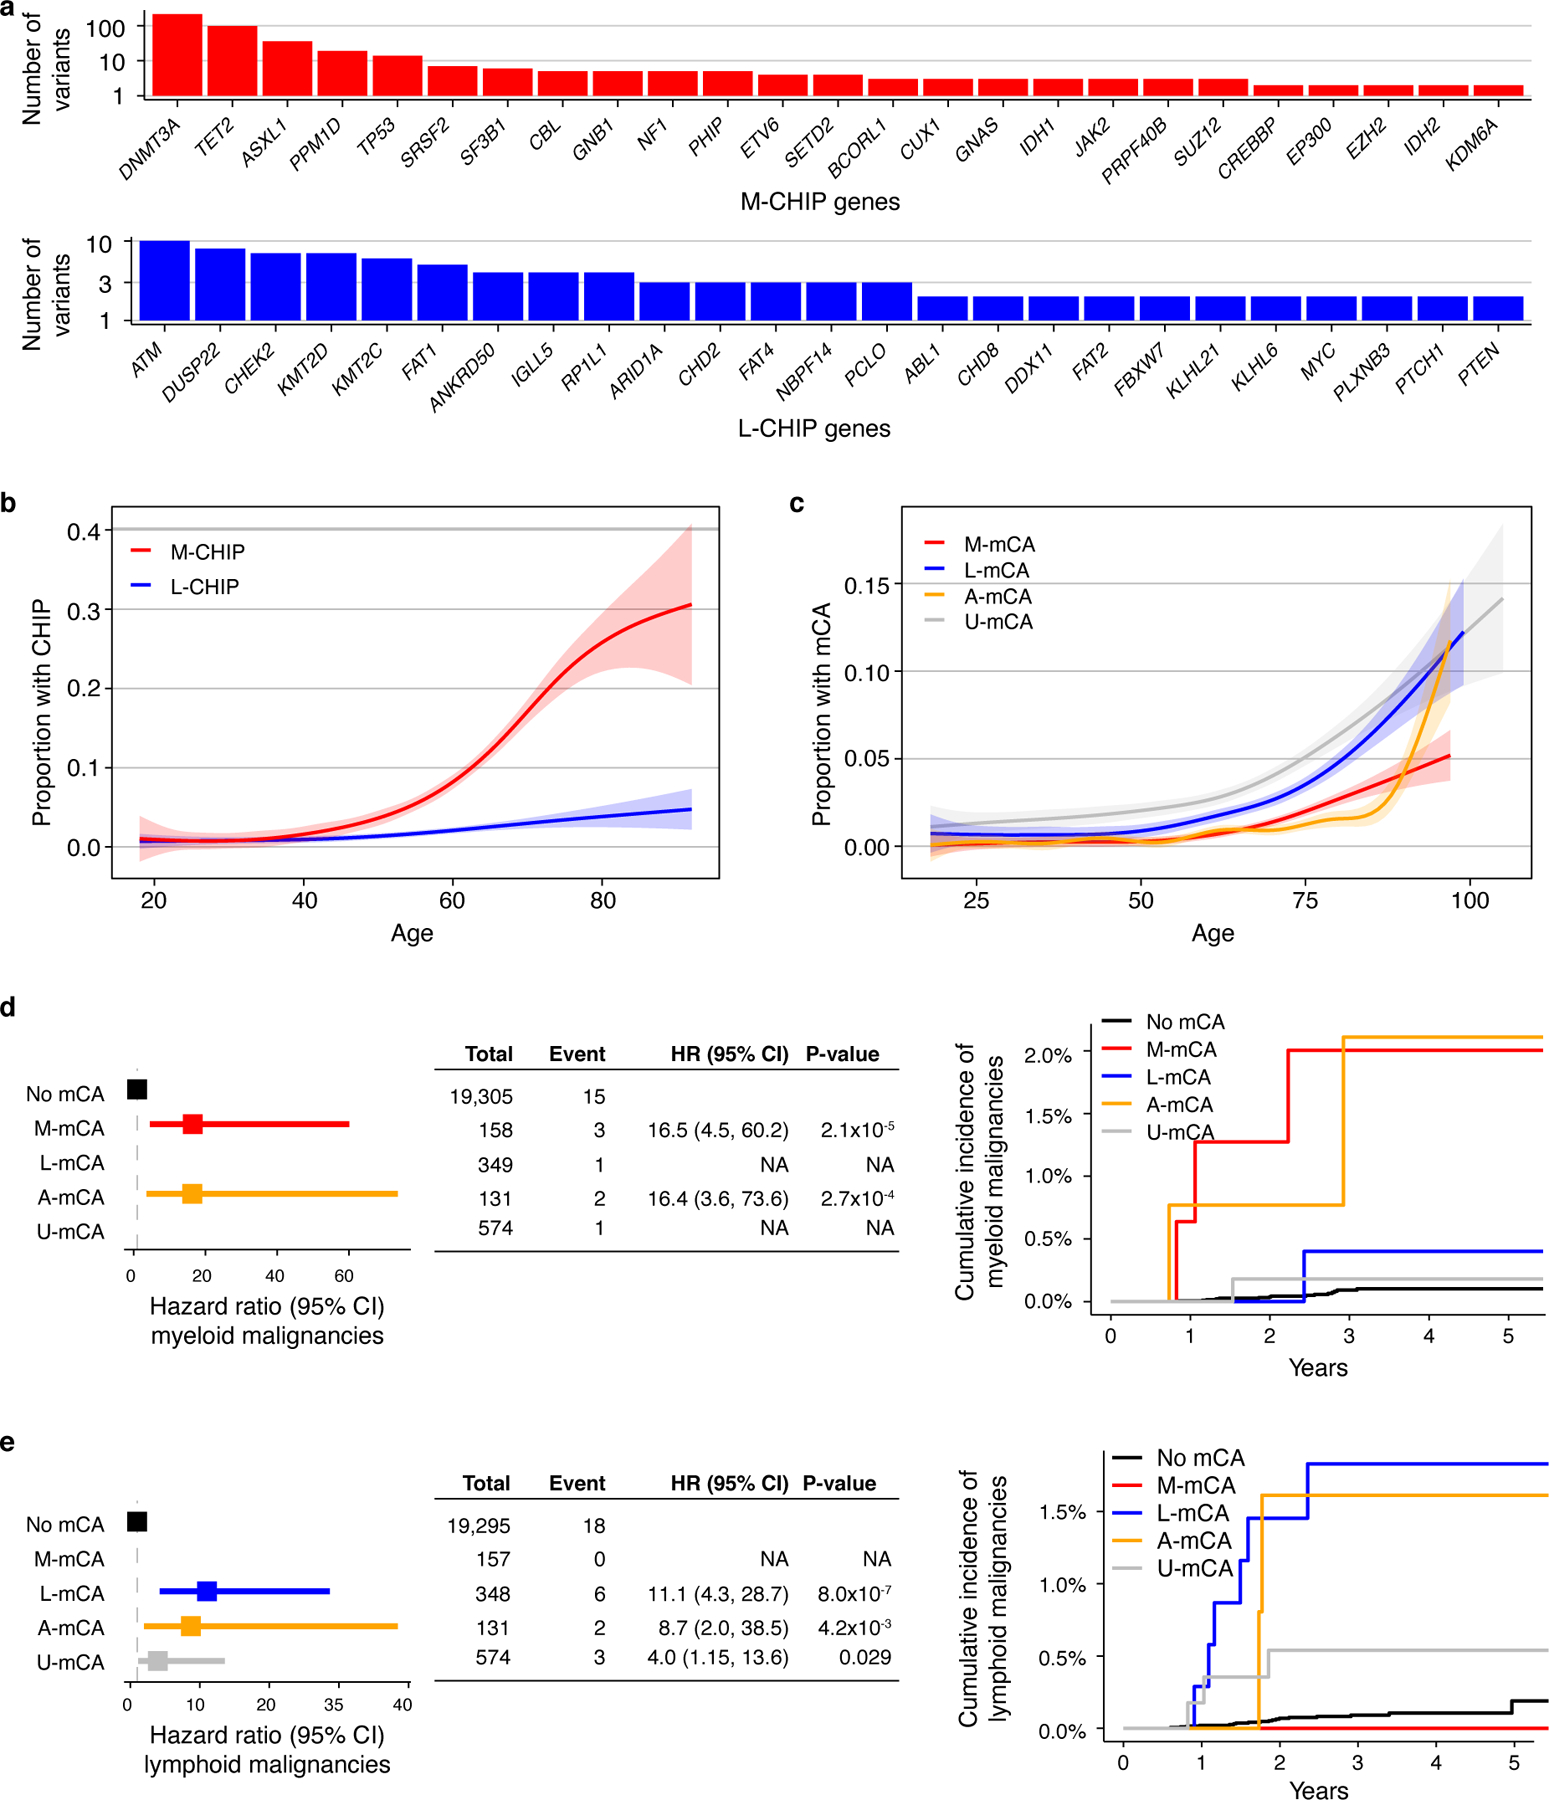
a) Top 25 myeloid and lymphoid driver genes mutated in MGBB cohort. b) Prevalence of M-CHIP and L-CHIP increase with age. c) Prevalence of M-mCA, L-mCA, and U-mCA increase with age. A-mCA were excluded because of small sample size. (b-c) Data is fit with the general additive model using cubic regression splines and the shaded bands indicate the estimated 95% confidence interval. d-e) M-mCA and L-mCA increase risk of myeloid and lymphoid malignancies, respectively. The incidence curves are un-adjusted for covariates. Data are presented as hazard ratio and 95% confidence intervals, computed by Cox proportional hazards model adjusting for age, sex, and genetic principal components 1–5. Incident multiple myeloma (MM) and monoclonal gammopathy of undetermined significance (MGUS) cases were excluded since those were only weakly associated with L-mCA in the UKB cohort. Groups with <2 events were excluded in the Cox model. M-CHIP, CHIP with myeloid driver, L-CHIP, CHIP with lymphoid driver; M-mCA, mCA with myeloid driver; L-mCA, mCA with lymphoid driver; A-mCA, mCA with ambiguous driver; U-mCA, unclassified mCAs; HR, hazard ratio; CI, confidence interval.
Extended Data Fig. 5. Co-occurrence of CHIP and mCAs.
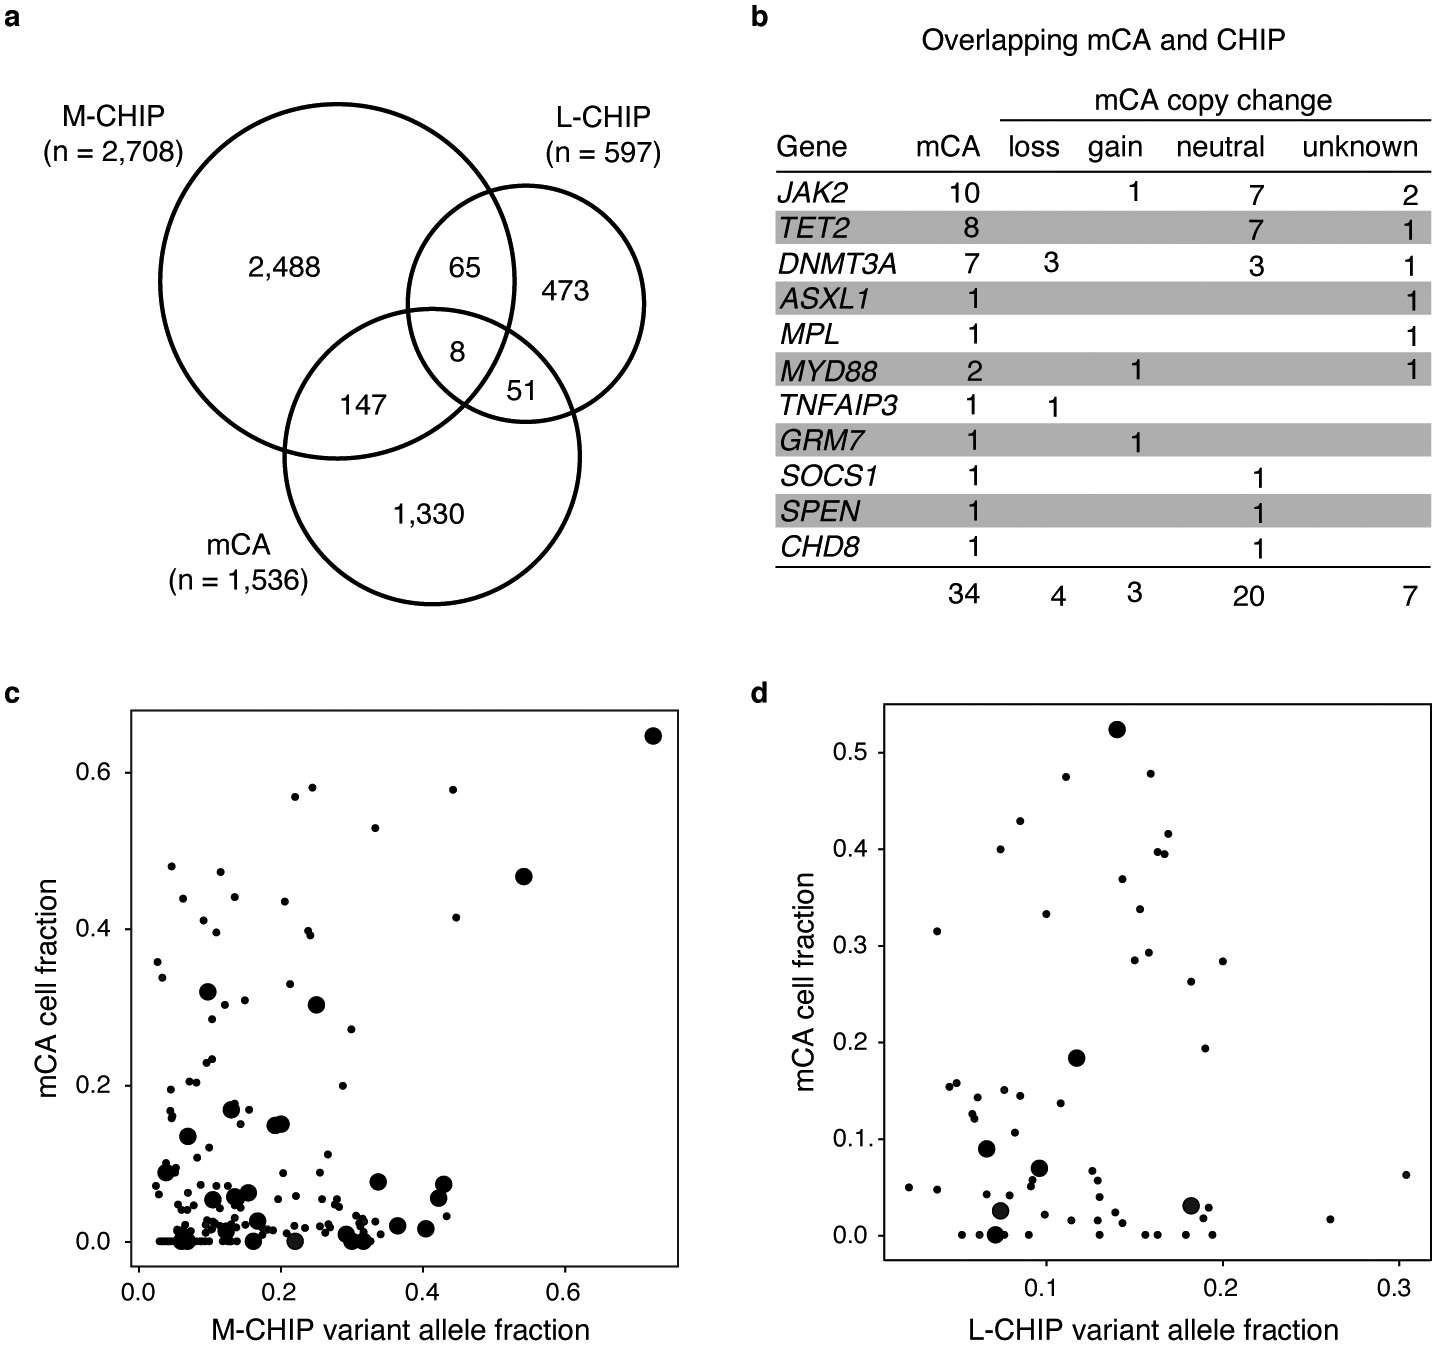
a) Number of individuals with M-CHIP, L-CHIP, and mCAs. b) Genomic loci harboring CHIP variants and overlapping mCAs, leading to bi-allelic genetic alterations. Copy-neutral loss-of-heterozygosity at JAK2, TET2, and DNMT3A account for most of the overlapping CHIP and mCA alterations. c-d) Correlation between variant allele fraction of CHIP variants and cell fraction of mCAs. Overlapping CHIP and mCAs are marked by larger dots.
Extended Data Fig. 6. Co-occurrence of CHIP and mCA amplify risk of malignancies.
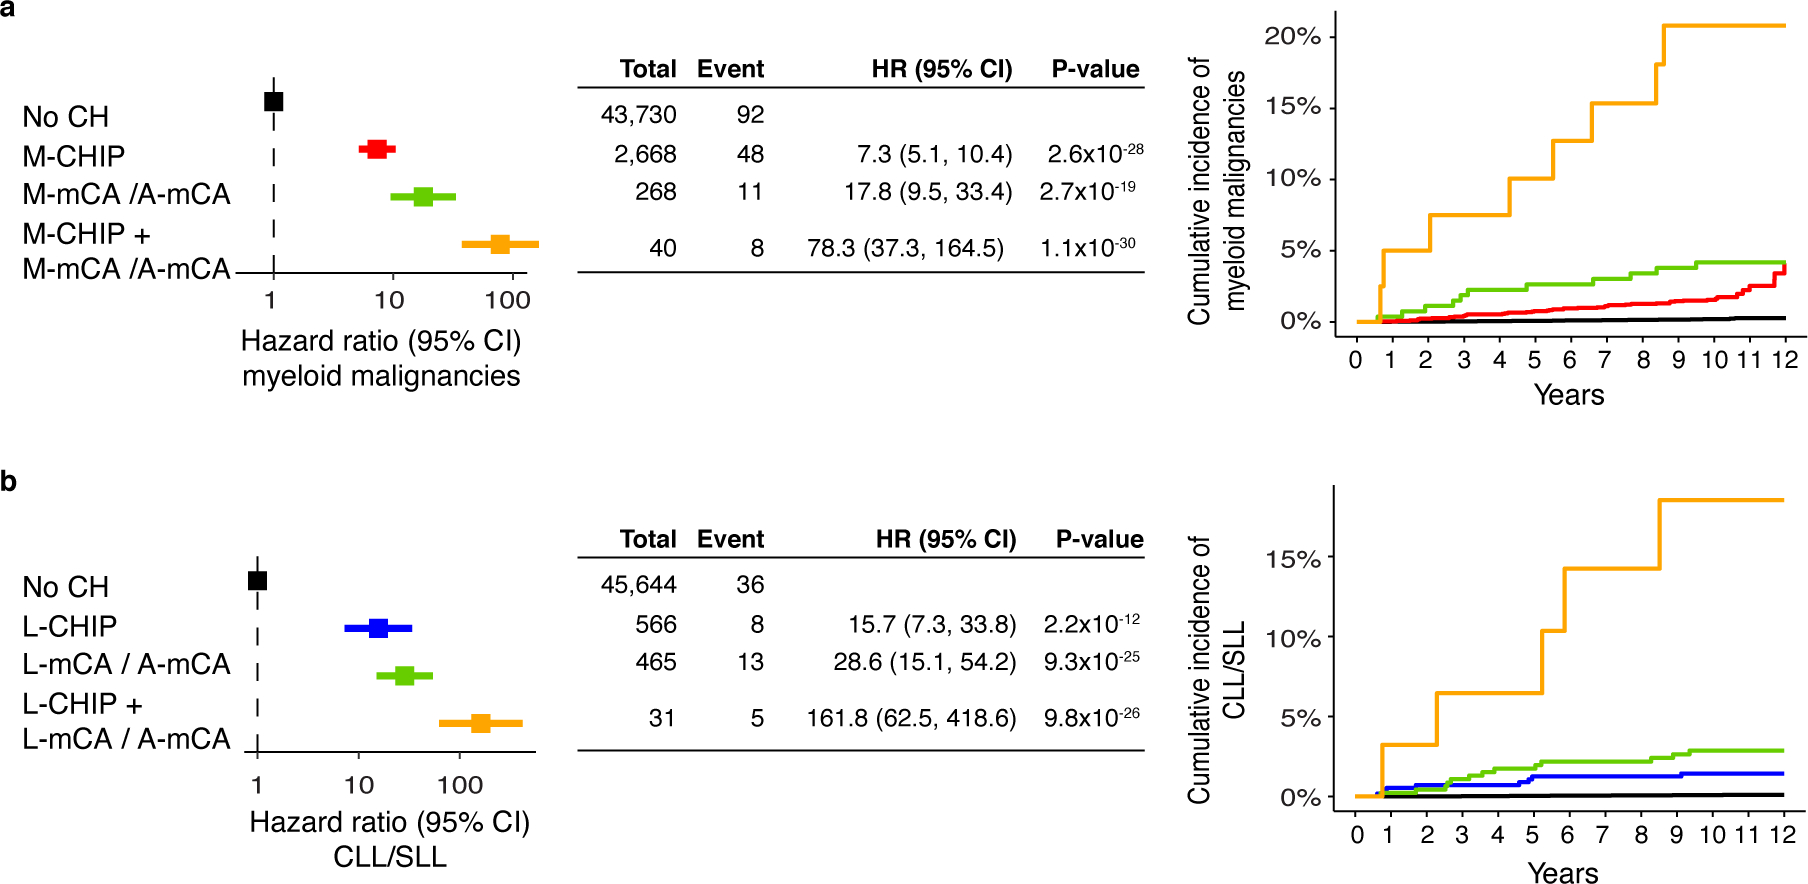
a) Risk of myeloid malignancies due to M-CHIP and M-mCA/A-mCA. b) Risk of lymphoid malignancies due to L-CHIP and L-mCA/A-mCA. (a-b) Since A-mCA were associated with risk of both myeloid and lymphoid malignancies, these are combined with M-mCA in the analysis of myeloid malignancies and with L-mCA in the analysis of lymphoid malignancies. Data are presented as hazard ratio and 95% confidence intervals, computed by using Cox proportional hazards model adjusting for age, sex, smoking, genetic ethnic ancestry, and genetic principal components 1–5. HR, hazard ratio; CI, confidence interval.
Extended Data Fig. 7. Multiple CH events bring higher risk of developing malignancies.
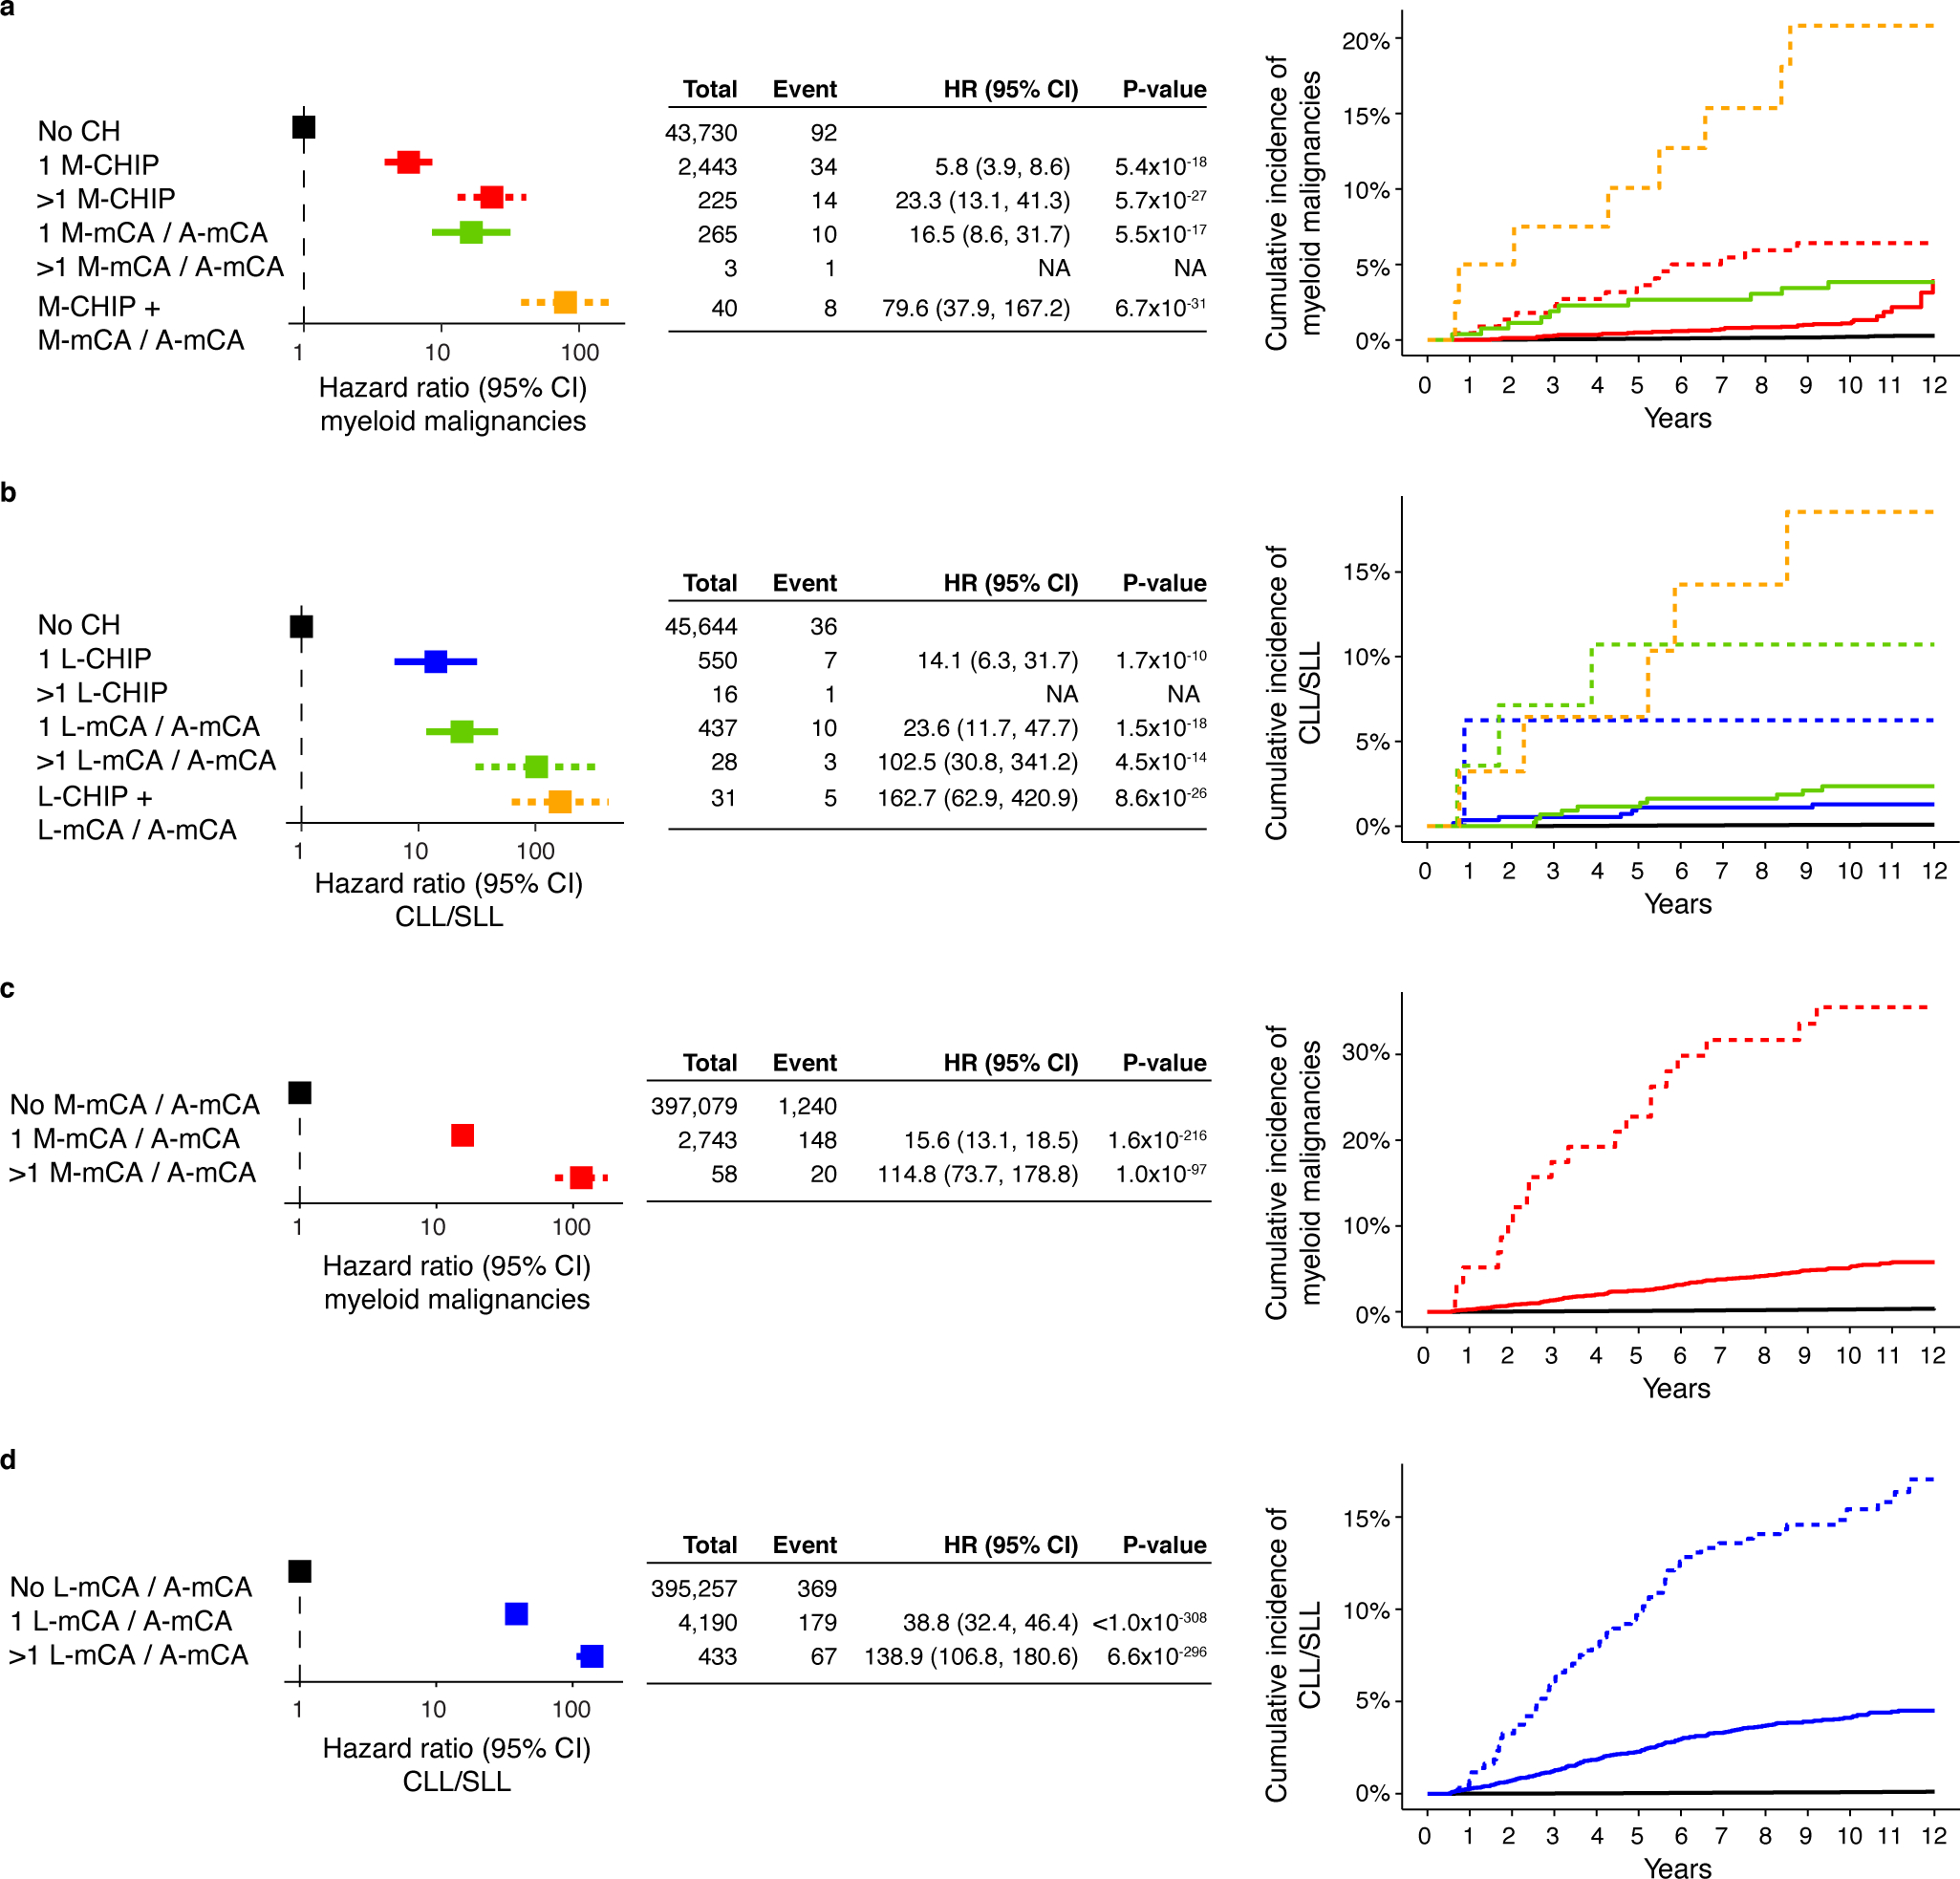
a-b) Multiple CH amplify risk of myeloid and lymphoid malignancies irrespective of the type of alterations. The analysis was performed among individuals with both WES and SNP-array data. Dashed curves indicate groups with multiple CH events. c-d) Multiple mCAs amplify risk of myeloid and lymphoid malignancies. (a-d) Since A-mCA were associated with risk of both myeloid and lymphoid malignancies, these are combined with M-mCA in the analysis of myeloid malignancies and with L-mCA in the analysis of lymphoid malignancies. Data are presented as hazard ratio and 95% confidence intervals, computed by using Cox proportional hazards model adjusting for age, sex, smoking, genetic ethnic ancestry, and genetic principal components 1–5. Individuals with >1 M-mCA/A-mCA and >1 L-CHIP were excluded in the multivariable Cox proportional hazard model due to small sample size and <3 events. HR, hazard ratio; CI, confidence interval.
Extended Data Fig. 8. Enrichment of blood cell indices among CH cases.
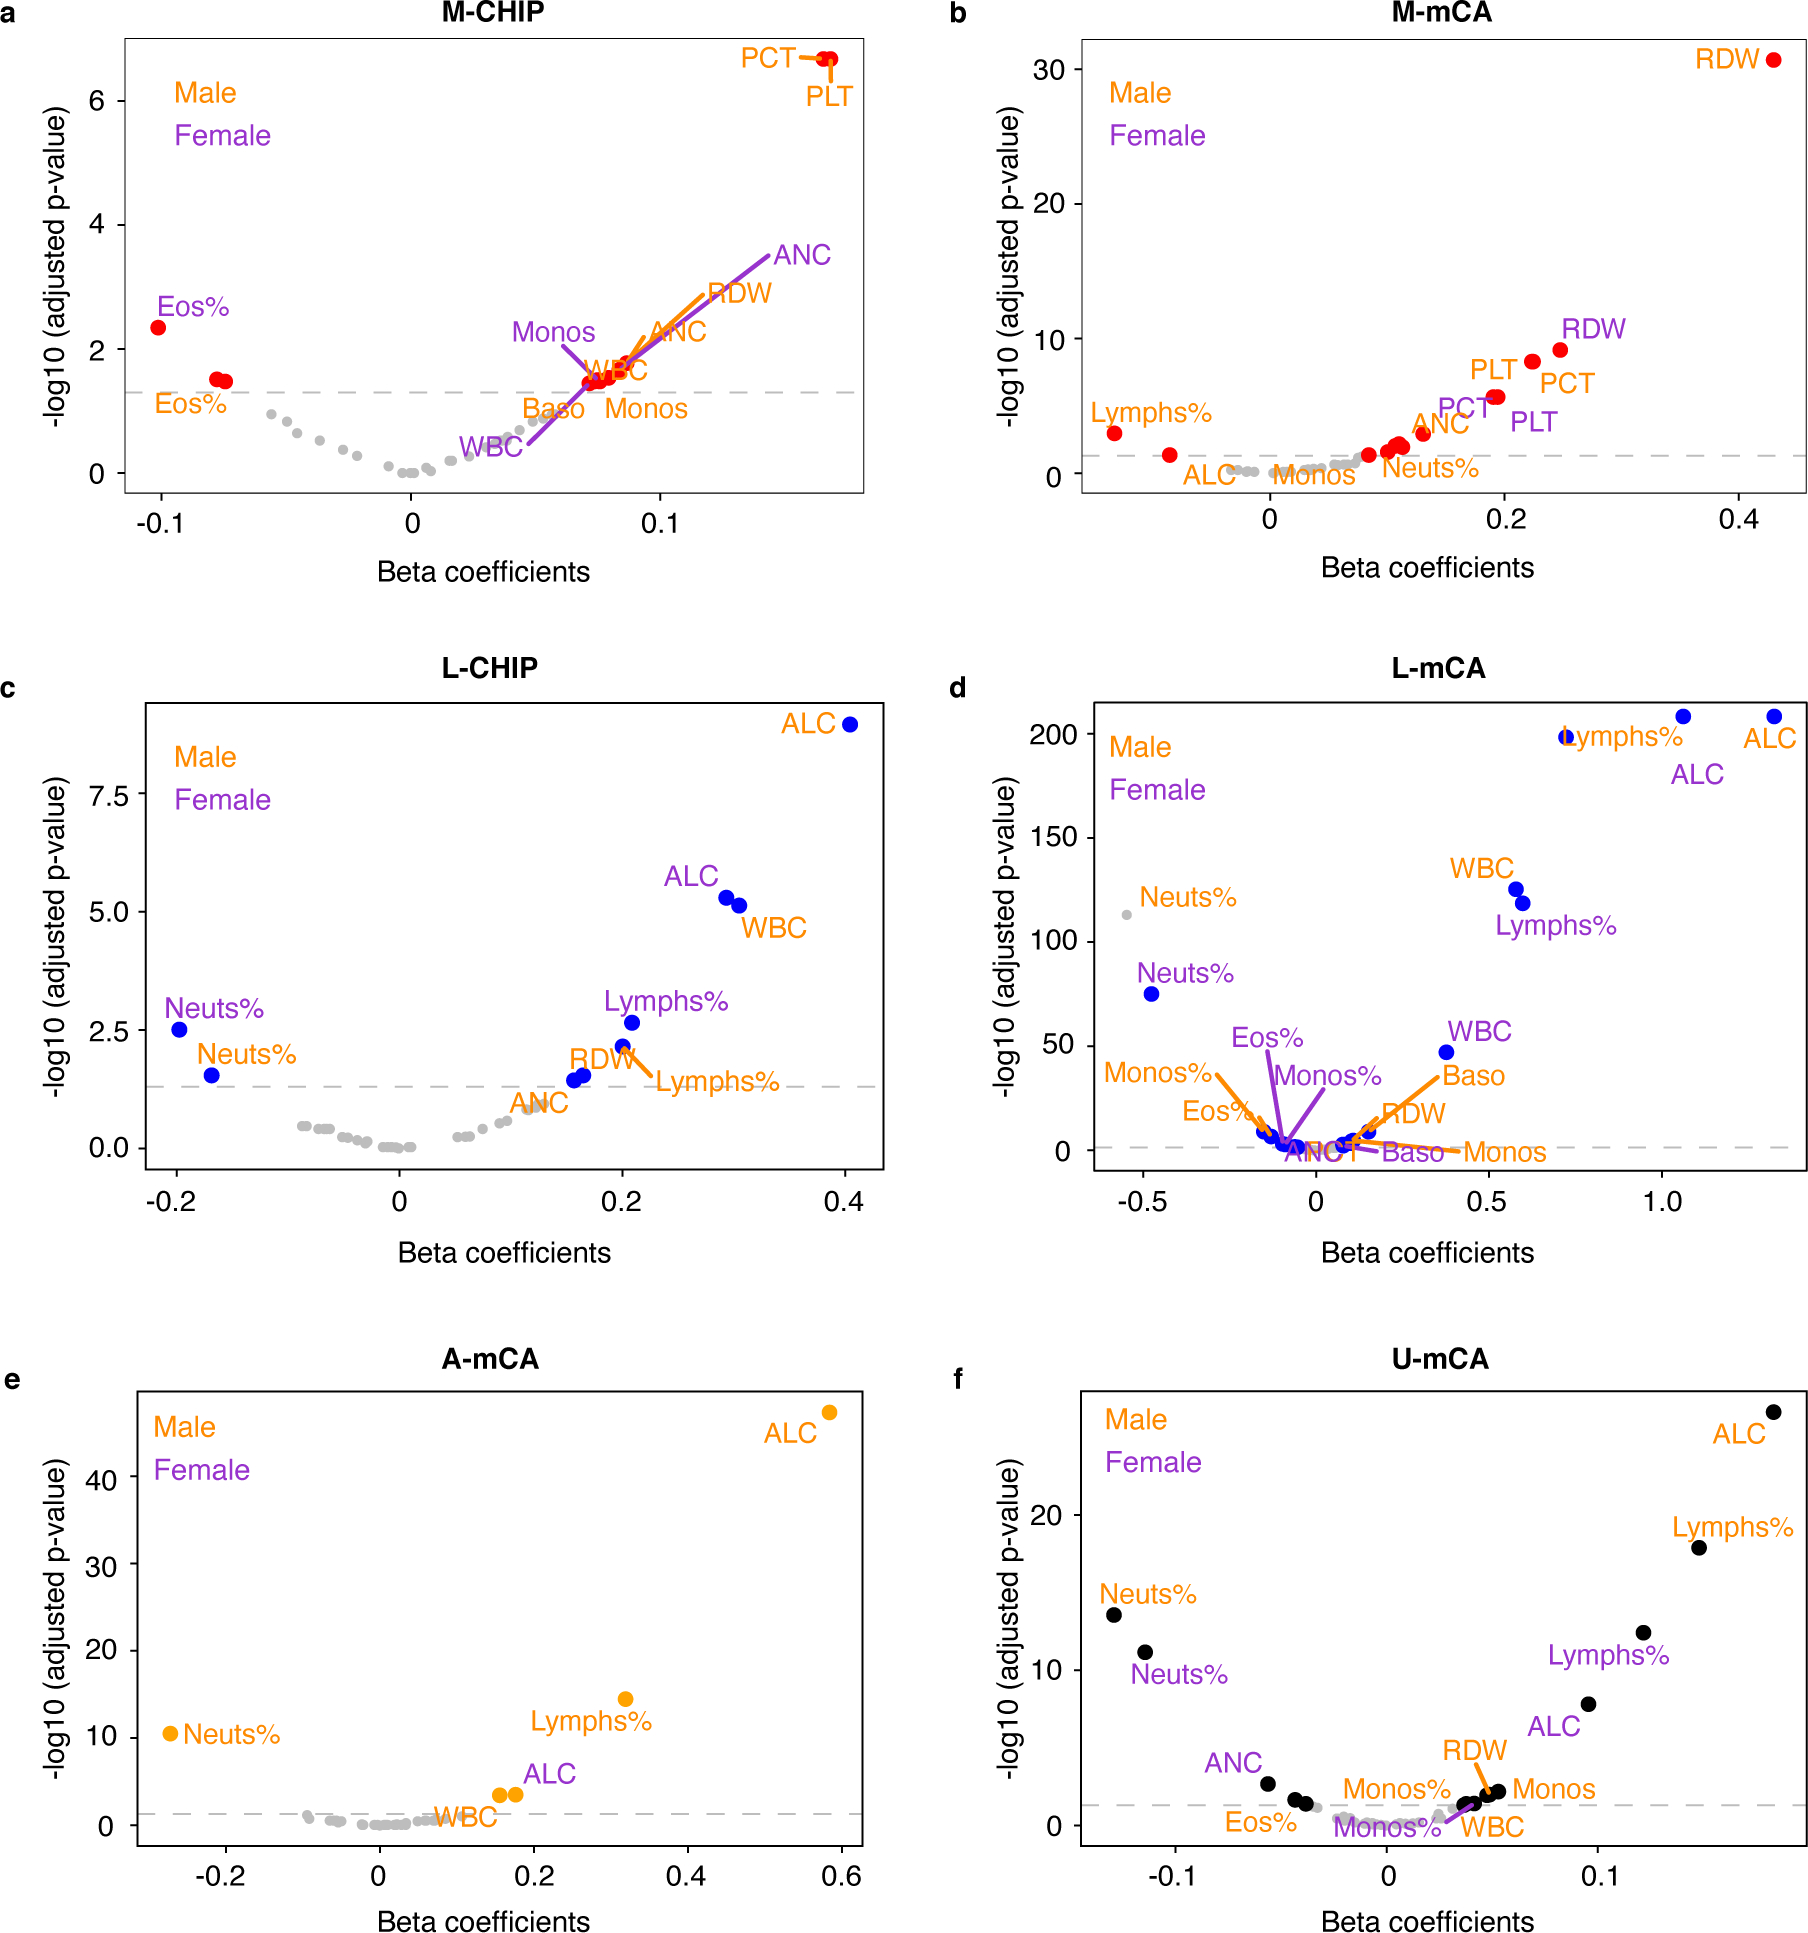
a) M-CHIP b) M-mCA c) L-CHIP d) L-mCA e) A-mCA f) unclassified mCAs (U-mCA). The associations between CH and normalized blood cell indices included in complete blood count and differentials were tested by using linear regression. The associations were tested separately in males and females and adjusted for age, ever smoking status, genetic ethnic ancestry, and genetic principal components. The dashed horizontal line indicates the significance threshold (adjusted p-value = 0.05). PCT, platelet crit; PLT, platelet count; ANC, absolute neutrophil count; Neuts%, neutrophil percentage; RDW, red blood cell distribution width; Monos, monocyte count; Monos%, monocyte percentage; Baso, basophil count; WBC, white blood cell count; Eos%, eosinophil percentage; ALC, absolute lymphocyte count; Lymphs%, lymphocyte percentage.
Extended Data Fig. 9. Abnormal CBC parameters increase risk of myeloid and lymphoid malignancies.
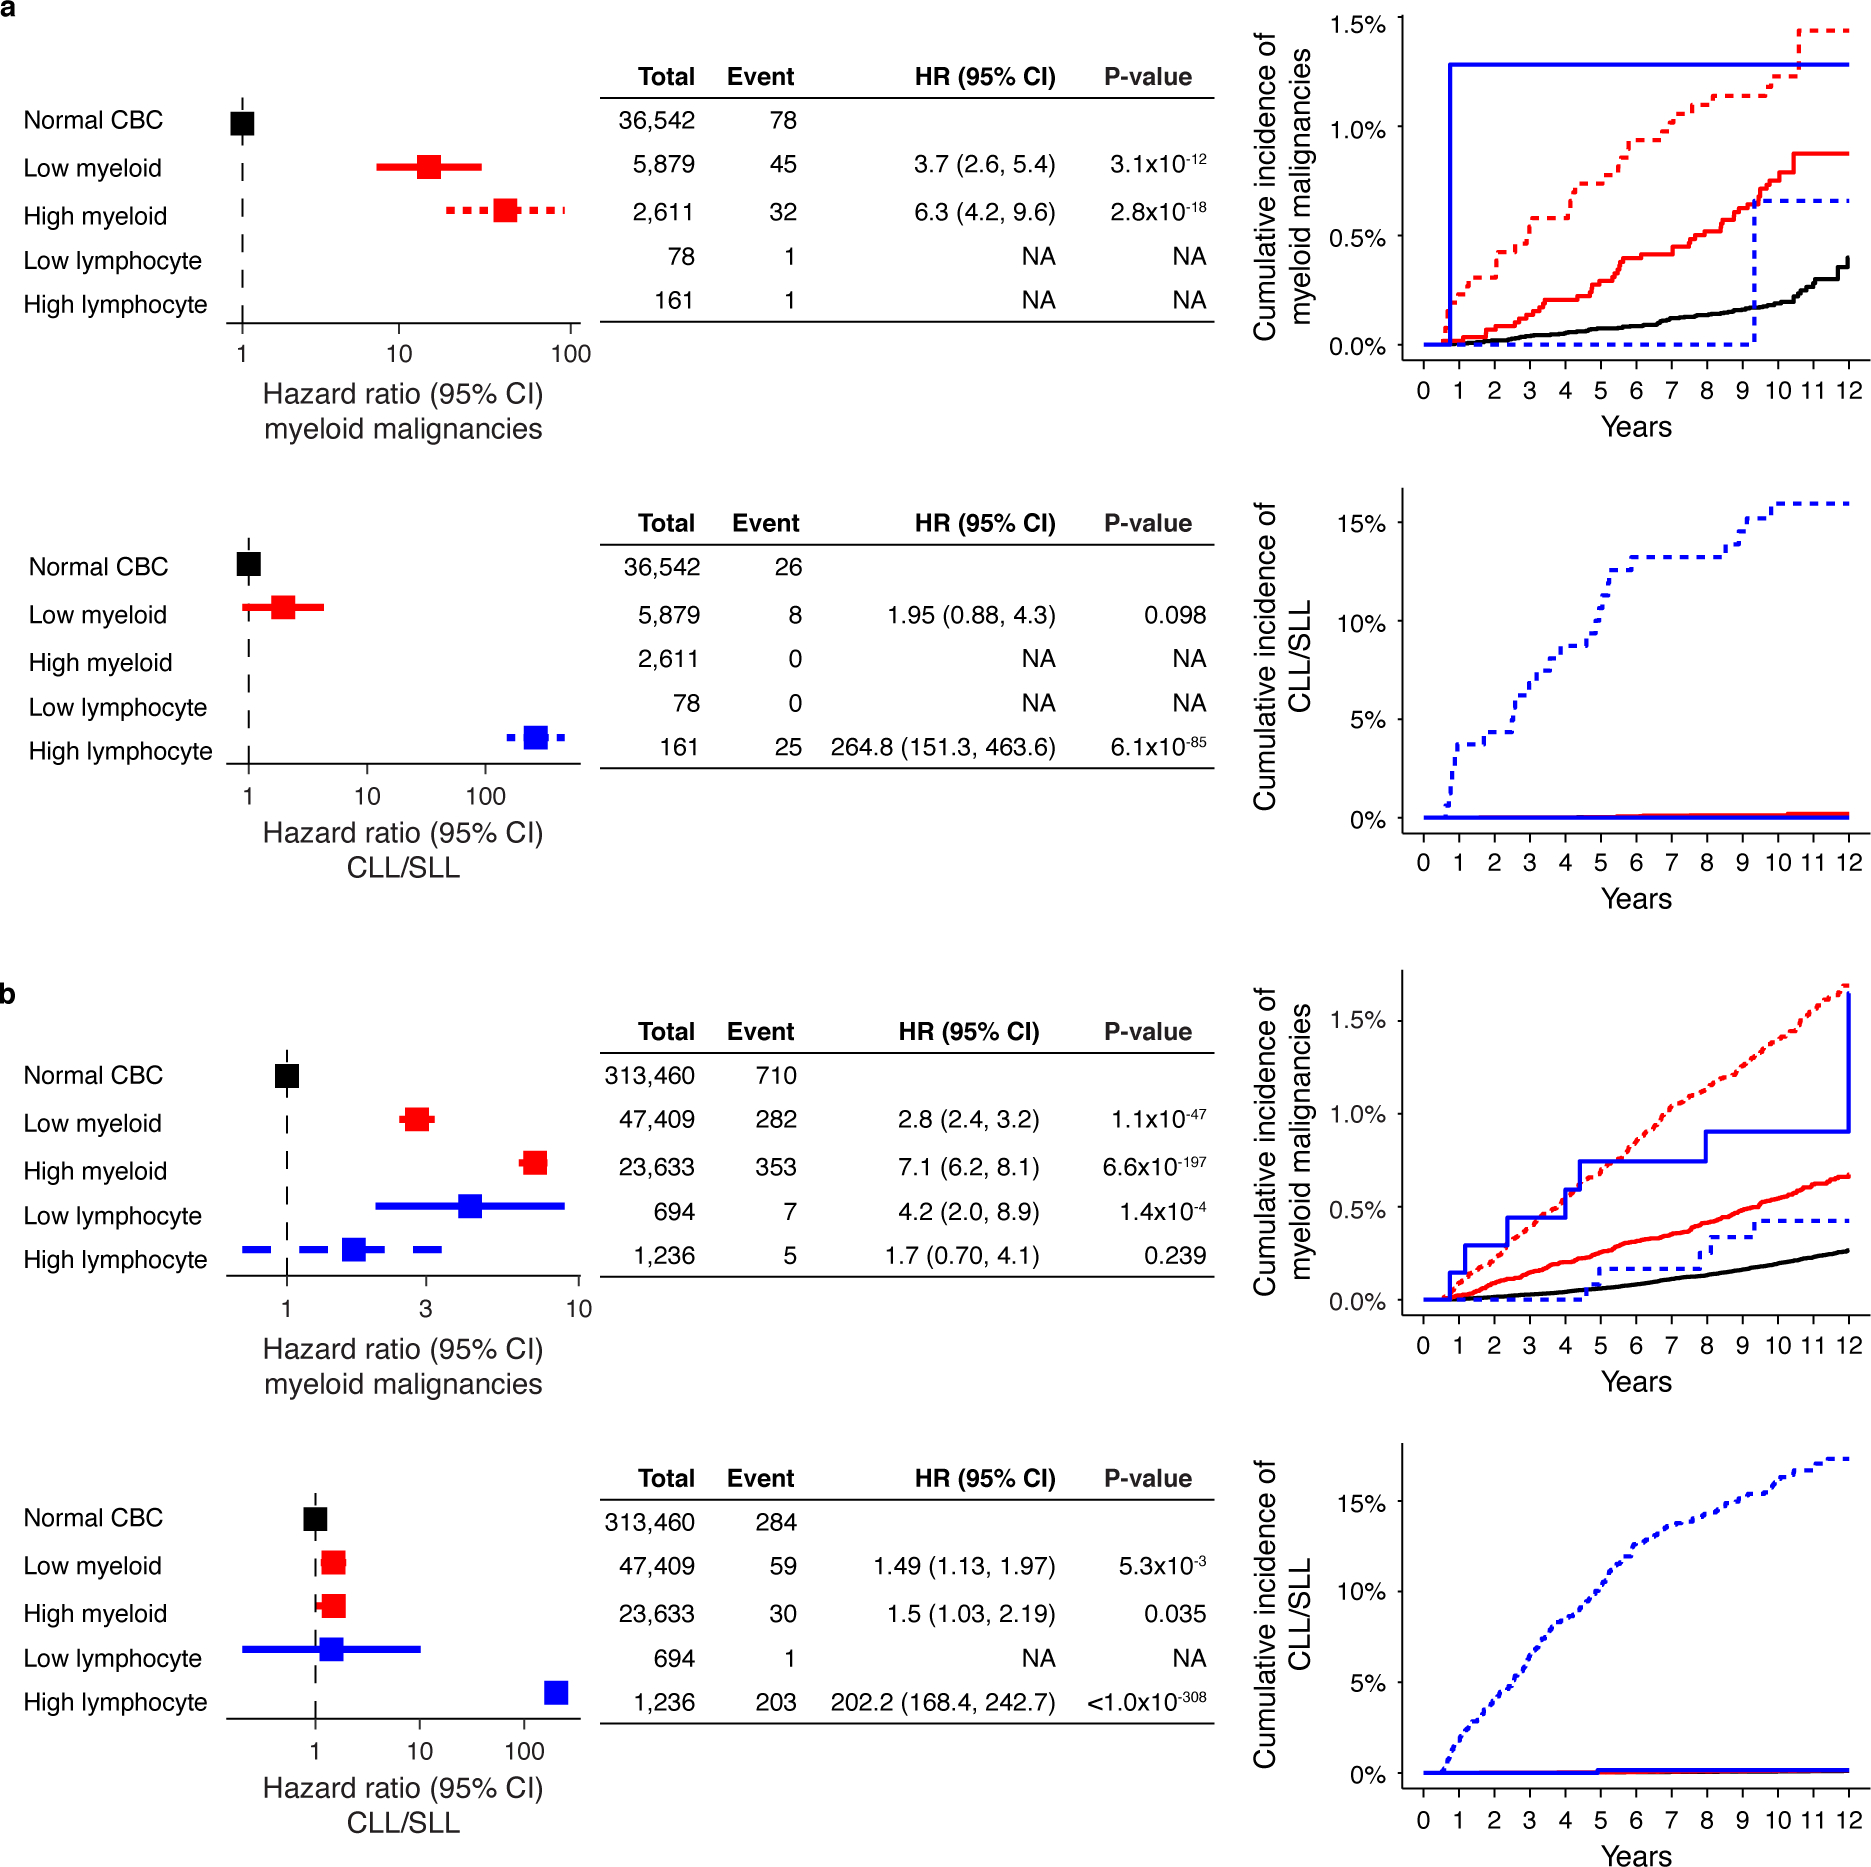
Both high and low myeloid cell parameters (neutrophil count, platelet count, or red blood cell count) are associated with increased risk of myeloid malignancies and high lymphocyte count is associated with increased risk of CLL/SLL in a) the WES cohort and b) the SNP-array cohort. (a-b) Data are presented as hazard ratio and 95% confidence intervals, computed by using Cox proportional hazards model adjusting for age, sex, smoking, genetic ethnic ancestry, and genetic principal components 1–5. Groups with small sample size and <3 events were excluded in the multivariable Cox proportional hazard model. CBC, complete blood count; High myeloid; high myeloid cell parameters, Low myeloid, low myeloid cell parameters; CLL, chronic lymphocytic leukemia, SLL, small lymphocytic lymphoma; HR, hazard ratio; CI, confidence interval.
Extended Data Fig. 10. Risk of mortality and coronary artery disease among CH cases.
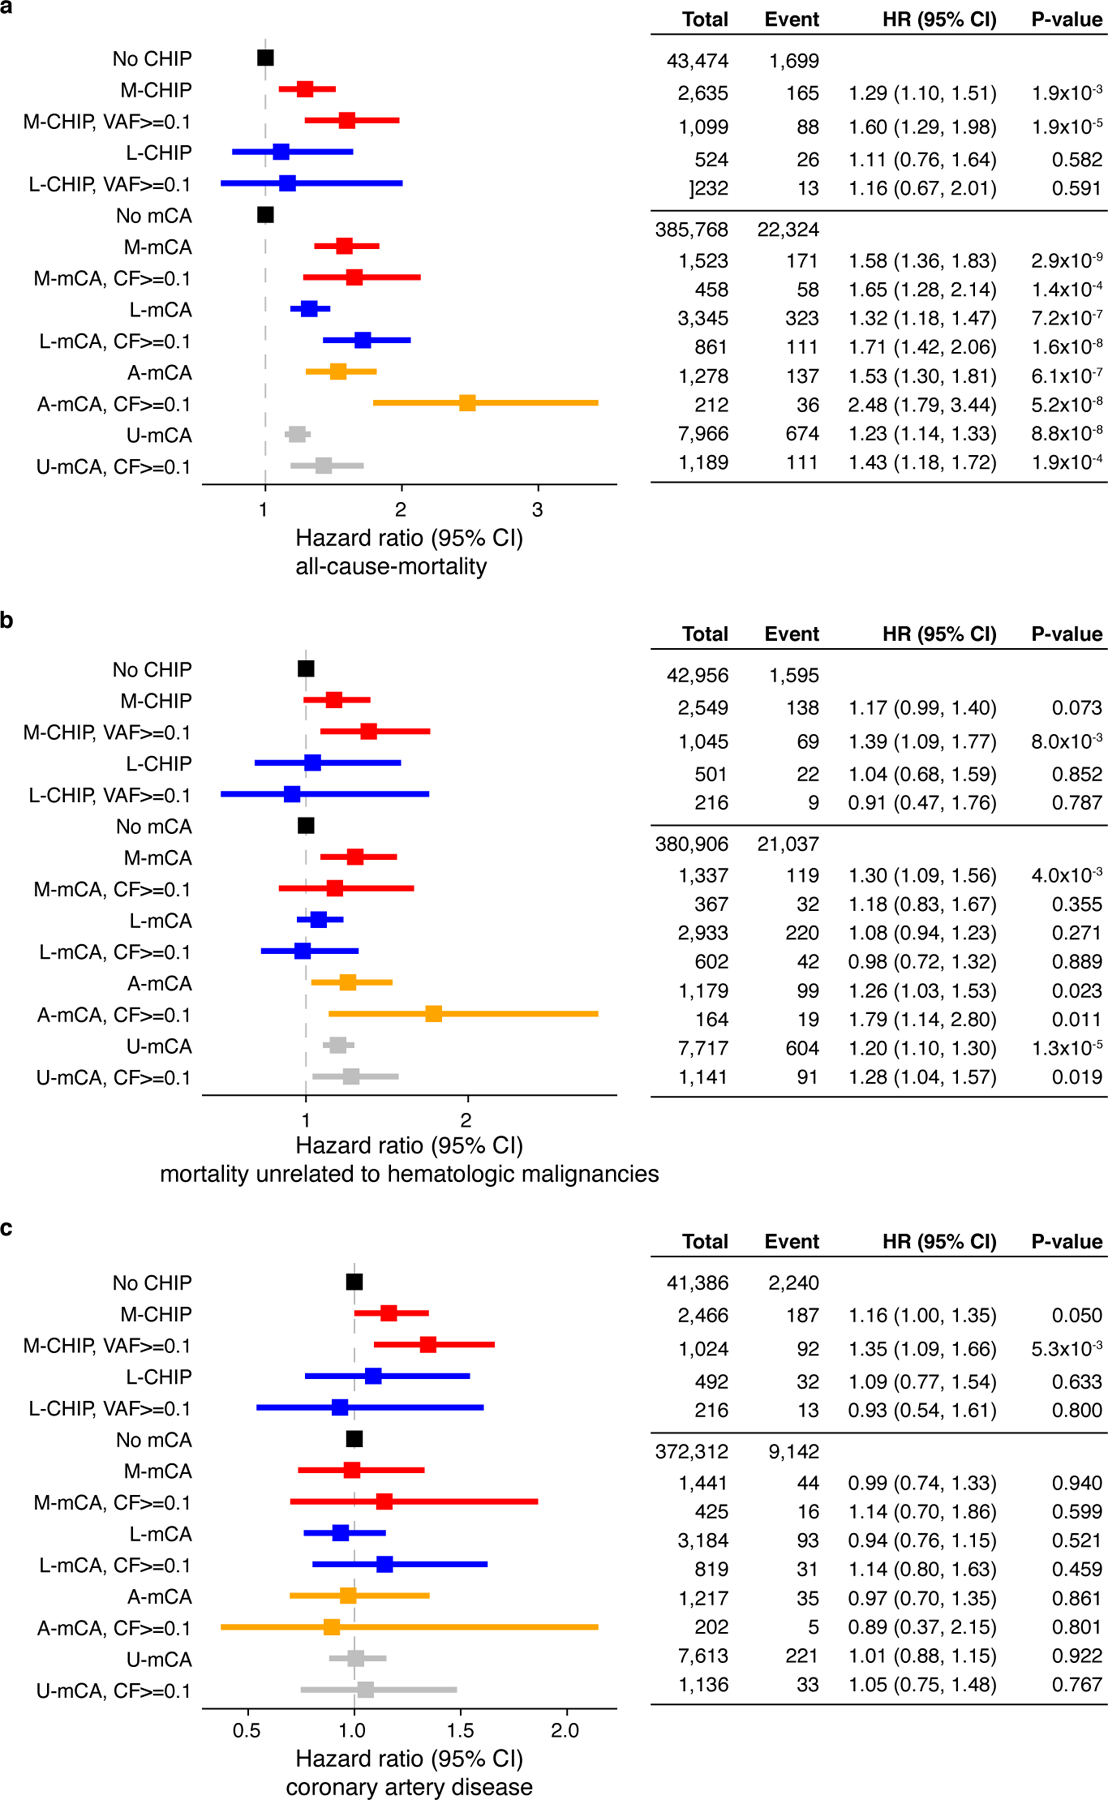
a) M-CHIP and all classes of mCAs were associated with increased risk of all-cause-mortality but L-CHIP did not increase the risk of mortality. b) Only M-CHIP, A-mCA and U-mCA were associated with mortality unrelated to hematologic malignancies. c) M-CHIP is associated with increased risk of coronary artery disease. No other CH categories were associated with risk of coronary artery disease. (a-c) Data are presented as hazard ratio and 95% confidence intervals, computed by using Cox proportional hazards model adjusting for age, sex, smoking, genetic ethnic ancestry, and genetic principal components 1–5. HR, hazard ratio; CI, confidence interval; VAF, variant allele fraction; CF, cell fraction.
Supplementary Material
Acknowledgements
This work was supported by the NIH (R01HL082945, P01CA108631, P50CA206963 and R35CA253125), the Howard Hughes Medical Institute and the Fondation Leducq to BLE. AN was supported by funds from Knut and Alice Wallenberg Foundation (KAW2017.0436). PN is supported by grants from the National Heart, Lung, and Blood Institute (R01HL142711, R01HL148050, R01HL151283, R01HL148565), Fondation Leducq (TNE-18CVD04), and Massachusetts General Hospital (Hassenfeld Research Scholar). MCH is supported by the National Heart, Lung, and Blood Institute (T32HL094301-07). GKG is supported by Damon Runyon Cancer Research Foundation. MA received research support for this work from the Deutsche Forschungsgemeinschaft (DFG, AG252/1-1). KP is supported by the National Heart, Lung, and Blood Institute (T32HL007208-43).
Footnotes
Competing Interests
BLE has received research funding from Celgene, Deerfield, and Novartis and consulting fees from GRAIL. He serves on the scientific advisory boards for Skyhawk Therapeutics, Exo Therapeutics, and Neomorph Therapeutics, none of which are directly related to the content of this paper. PN reports grant support from Amgen, Apple, AstraZeneca, Boston Scientific, and Novartis, personal fees from Apple, AstraZeneca, Blackstone Life Sciences, Genentech, and Novartis, and spousal employment at Vertex, all unrelated to the present work. GKG reports affiliation to Moderna Therapeutics which is unrelated to the present work. MA received consulting fees from German Accelerator Life Sciences and he is co-founder of iuvando Health and holds equity, all unrelated to the present work. All other authors declare no competing interests.
References
- 1.Jaiswal S, et al. Age-related clonal hematopoiesis associated with adverse outcomes. N Engl J Med 371, 2488–2498 (2014). [DOI] [PMC free article] [PubMed] [Google Scholar]
- 2.Genovese G, et al. Clonal hematopoiesis and blood-cancer risk inferred from blood DNA sequence. N Engl J Med 371, 2477–2487 (2014). [DOI] [PMC free article] [PubMed] [Google Scholar]
- 3.Xie M, et al. Age-related mutations associated with clonal hematopoietic expansion and malignancies. Nat Med 20, 1472–1478 (2014). [DOI] [PMC free article] [PubMed] [Google Scholar]
- 4.Loh PR, et al. Insights into clonal haematopoiesis from 8,342 mosaic chromosomal alterations. Nature 559, 350–355 (2018). [DOI] [PMC free article] [PubMed] [Google Scholar]
- 5.Loh PR, Genovese G & McCarroll SA Monogenic and polygenic inheritance become instruments for clonal selection. Nature 584, 136–141 (2020). [DOI] [PMC free article] [PubMed] [Google Scholar]
- 6.Steensma DP, et al. Clonal hematopoiesis of indeterminate potential and its distinction from myelodysplastic syndromes. Blood 126, 9–16 (2015). [DOI] [PMC free article] [PubMed] [Google Scholar]
- 7.Jaiswal S & Ebert BL Clonal hematopoiesis in human aging and disease. Science 366(2019). [DOI] [PMC free article] [PubMed] [Google Scholar]
- 8.Mitchell SR, Gopakumar J & Jaiswal S Insights into clonal hematopoiesis and its relation to cancer risk. Curr Opin Genet Dev 66, 63–69 (2021). [DOI] [PMC free article] [PubMed] [Google Scholar]
- 9.Abelson S, et al. Prediction of acute myeloid leukaemia risk in healthy individuals. Nature 559, 400–404 (2018). [DOI] [PMC free article] [PubMed] [Google Scholar]
- 10.Desai P, et al. Somatic mutations precede acute myeloid leukemia years before diagnosis. Nat Med 24, 1015–1023 (2018). [DOI] [PMC free article] [PubMed] [Google Scholar]
- 11.Bick AG, et al. Inherited causes of clonal haematopoiesis in 97,691 whole genomes. Nature 586, 763–768 (2020). [DOI] [PMC free article] [PubMed] [Google Scholar]
- 12.Jaiswal S, et al. Clonal hematopoiesis and risk of atherosclerotic cardiovascular disease. N Engl J Med 377, 111–121 (2017). [DOI] [PMC free article] [PubMed] [Google Scholar]
- 13.Agathangelidis A, et al. Highly similar genomic landscapes in monoclonal B-cell lymphocytosis and ultra-stable chronic lymphocytic leukemia with low frequency of driver mutations. Haematologica 103, 865–873 (2018). [DOI] [PMC free article] [PubMed] [Google Scholar]
- 14.Condoluci A & Rossi D Age-related clonal hematopoiesis and monoclonal B-cell lymphocytosis/chronic lymphocytic leukemia: a new association? Haematologica 103, 751–752 (2018). [DOI] [PMC free article] [PubMed] [Google Scholar]
- 15.Singh M, et al. Lymphoma driver mutations in the pathogenic evolution of an iconic human autoantibody. Cell 180, 878–894 e819 (2020). [DOI] [PubMed] [Google Scholar]
- 16.Weigert O, et al. Molecular ontogeny of donor-derived follicular lymphomas occurring after hematopoietic cell transplantation. Cancer Discov 2, 47–55 (2012). [DOI] [PMC free article] [PubMed] [Google Scholar]
- 17.Bycroft C, et al. The UK Biobank resource with deep phenotyping and genomic data. Nature 562, 203–209 (2018). [DOI] [PMC free article] [PubMed] [Google Scholar]
- 18.Landau DA, et al. Mutations driving CLL and their evolution in progression and relapse. Nature 526, 525–530 (2015). [DOI] [PMC free article] [PubMed] [Google Scholar]
- 19.Puente XS, et al. Non-coding recurrent mutations in chronic lymphocytic leukaemia. Nature 526, 519–524 (2015). [DOI] [PubMed] [Google Scholar]
- 20.Chapuy B, et al. Molecular subtypes of diffuse large B cell lymphoma are associated with distinct pathogenic mechanisms and outcomes. Nat Med 24, 679–690 (2018). [DOI] [PMC free article] [PubMed] [Google Scholar]
- 21.Schmitz R, et al. Genetics and Pathogenesis of Diffuse Large B-Cell Lymphoma. N Engl J Med 378, 1396–1407 (2018). [DOI] [PMC free article] [PubMed] [Google Scholar]
- 22.Pastore A, et al. Integration of gene mutations in risk prognostication for patients receiving first-line immunochemotherapy for follicular lymphoma: a retrospective analysis of a prospective clinical trial and validation in a population-based registry. Lancet Oncol 16, 1111–1122 (2015). [DOI] [PubMed] [Google Scholar]
- 23.Okosun J, et al. Integrated genomic analysis identifies recurrent mutations and evolution patterns driving the initiation and progression of follicular lymphoma. Nat Genet 46, 176–181 (2014). [DOI] [PMC free article] [PubMed] [Google Scholar]
- 24.Bea S, et al. Landscape of somatic mutations and clonal evolution in mantle cell lymphoma. Proc Natl Acad Sci U S A 110, 18250–18255 (2013). [DOI] [PMC free article] [PubMed] [Google Scholar]
- 25.Zhang J, et al. The genomic landscape of mantle cell lymphoma is related to the epigenetically determined chromatin state of normal B cells. Blood 123, 2988–2996 (2014). [DOI] [PMC free article] [PubMed] [Google Scholar]
- 26.Piris MA, Onaindia A & Mollejo M Splenic marginal zone lymphoma. Best Pract Res Clin Haematol 30, 56–64 (2017). [DOI] [PubMed] [Google Scholar]
- 27.Reichel J, et al. Flow sorting and exome sequencing reveal the oncogenome of primary Hodgkin and Reed-Sternberg cells. Blood 125, 1061–1072 (2015). [DOI] [PubMed] [Google Scholar]
- 28.Wienand K, et al. Genomic analyses of flow-sorted Hodgkin Reed-Sternberg cells reveal complementary mechanisms of immune evasion. Blood Adv 3, 4065–4080 (2019). [DOI] [PMC free article] [PubMed] [Google Scholar]
- 29.Sandell RF, Boddicker RL & Feldman AL Genetic Landscape and Classification of Peripheral T Cell Lymphomas. Curr Oncol Rep 19, 28 (2017). [DOI] [PMC free article] [PubMed] [Google Scholar]
- 30.Pizzi M, Margolskee E & Inghirami G Pathogenesis of Peripheral T Cell Lymphoma. Annu Rev Pathol 13, 293–320 (2018). [DOI] [PubMed] [Google Scholar]
- 31.Zekavat SM, et al. Hematopoietic mosaic chromosomal alterations increase the risk for diverse types of infection. Nature Medicine (2021). [DOI] [PMC free article] [PubMed] [Google Scholar]
- 32.Gao T, et al. Interplay between chromosomal alterations and gene mutations shapes the evolutionary trajectory of clonal hematopoiesis. Nat Commun 12, 338 (2021). [DOI] [PMC free article] [PubMed] [Google Scholar]
- 33.Rawstron AC, et al. Monoclonal B-cell lymphocytosis and chronic lymphocytic leukemia. N Engl J Med 359, 575–583 (2008). [DOI] [PubMed] [Google Scholar]
- 34.Malcovati L, et al. Clinical significance of somatic mutation in unexplained blood cytopenia. Blood 129, 3371–3378 (2017). [DOI] [PMC free article] [PubMed] [Google Scholar]
- 35.Fuster JJ, et al. Clonal hematopoiesis associated with TET2 deficiency accelerates atherosclerosis development in mice. Science 355, 842–847 (2017). [DOI] [PMC free article] [PubMed] [Google Scholar]
- 36.Thol F, et al. Acute myeloid leukemia derived from lympho-myeloid clonal hematopoiesis. Leukemia 31, 1286–1295 (2017). [DOI] [PMC free article] [PubMed] [Google Scholar]
Methods References
- 37.Van Hout CV, et al. Exome sequencing and characterization of 49,960 individuals in the UK Biobank. Nature 586, 749–756 (2020). [DOI] [PMC free article] [PubMed] [Google Scholar]
- 38.Manichaikul A, et al. Robust relationship inference in genome-wide association studies. Bioinformatics 26, 2867–2873 (2010). [DOI] [PMC free article] [PubMed] [Google Scholar]
- 39.Smoller JW, et al. An eMERGE Clinical Center at Partners Personalized Medicine. J Pers Med 6(2016). [DOI] [PMC free article] [PubMed] [Google Scholar]
- 40.Benjamin D, et al. Calling somatic SNVs and indels with Mutect2. bioRxiv (2019). [Google Scholar]
- 41.Karczewski KJ, et al. The mutational constraint spectrum quantified from variation in 141,456 humans. Nature 581, 434–443 (2020). [DOI] [PMC free article] [PubMed] [Google Scholar]
- 42.Gibson CJ, et al. Clonal hematopoiesis associated with adverse outcomes after autologous stem-cell transplantation for lymphoma. J Clin Oncol 35, 1598–1605 (2017). [DOI] [PMC free article] [PubMed] [Google Scholar]
- 43.Wang L, et al. Integrated single-cell genetic and transcriptional analysis suggests novel drivers of chronic lymphocytic leukemia. Genome Res 27, 1300–1311 (2017). [DOI] [PMC free article] [PubMed] [Google Scholar]
- 44.Reddy A, et al. Genetic and Functional Drivers of Diffuse Large B Cell Lymphoma. Cell 171, 481–494 e415 (2017). [DOI] [PMC free article] [PubMed] [Google Scholar]
- 45.Green MR, et al. Hierarchy in somatic mutations arising during genomic evolution and progression of follicular lymphoma. Blood 121, 1604–1611 (2013). [DOI] [PMC free article] [PubMed] [Google Scholar]
- 46.Royo C, et al. The complex landscape of genetic alterations in mantle cell lymphoma. Semin Cancer Biol 21, 322–334 (2011). [DOI] [PubMed] [Google Scholar]
- 47.Spina V, et al. Circulating tumor DNA reveals genetics, clonal evolution, and residual disease in classical Hodgkin lymphoma. Blood 131, 2413–2425 (2018). [DOI] [PubMed] [Google Scholar]
- 48.Tiacci E, et al. Pervasive mutations of JAK-STAT pathway genes in classical Hodgkin lymphoma. Blood 131, 2454–2465 (2018). [DOI] [PMC free article] [PubMed] [Google Scholar]
- 49.Odejide O, et al. A targeted mutational landscape of angioimmunoblastic T-cell lymphoma. Blood 123, 1293–1296 (2014). [DOI] [PMC free article] [PubMed] [Google Scholar]
- 50.da Silva Almeida AC, et al. The mutational landscape of cutaneous T cell lymphoma and Sezary syndrome. Nat Genet 47, 1465–1470 (2015). [DOI] [PMC free article] [PubMed] [Google Scholar]
- 51.Kataoka K, et al. Integrated molecular analysis of adult T cell leukemia/lymphoma. Nat Genet 47, 1304–1315 (2015). [DOI] [PubMed] [Google Scholar]
- 52.Cerami E, et al. The cBio cancer genomics portal: an open platform for exploring multidimensional cancer genomics data. Cancer Discov 2, 401–404 (2012). [DOI] [PMC free article] [PubMed] [Google Scholar]
- 53.Li H, et al. The Sequence Alignment/Map format and SAMtools. Bioinformatics 25, 2078–2079 (2009). [DOI] [PMC free article] [PubMed] [Google Scholar]
- 54.Huret JL, et al. Atlas of genetics and cytogenetics in oncology and haematology in 2013. Nucleic Acids Res 41, D920–924 (2013). [DOI] [PMC free article] [PubMed] [Google Scholar]
- 55.R Core Team. R: A language and environment for statistical computing. (R Foundation for Statistical Computing, Vienna, Austria, 2019). [Google Scholar]
- 56.Wickham H ggplot2: Elegant Graphics for Data Analysis, (Springer-Verlag; New York, 2016). [Google Scholar]
- 57.Suissa S Immortal time bias in pharmaco-epidemiology. Am J Epidemiol 167, 492–499 (2008). [DOI] [PubMed] [Google Scholar]
Associated Data
This section collects any data citations, data availability statements, or supplementary materials included in this article.
Supplementary Materials
Data Availability Statement
The source data are available to the approved researchers through the UK Biobank and Mass General Brigham Biobank. The data generated in this study, including the somatic variants and chromosomal alterations, are available as Supplementary Materials which will be submitted to the respective biobanks to enable linking with individual-level data and sharing with other approved researchers. Usage of these data will be covered by the data use agreements with the respective biobanks and no additional restrictions apply. Individual-level MGBB data are available from https://personalizedmedicine.partners.org/Biobank/Default.aspx, but restrictions apply to the availability of these data, which were used under institutional review board (IRB) approval for the current study, and so are not publicly available. Individual-level UK Biobank data are available for approved researchers from https://www.ukbiobank.ac.uk. The present article includes all other data generated or analyzed during this study. Additional databases used in this study are: Genome Aggregation Database (gnomAD, https://gnomad.broadinstitute.org), cBioPortal for cancer genomics (https://www.cbioportal.org), the atlas of genetics and cytogenetics in oncology and haematology (http://atlasgeneticsoncology.org).


