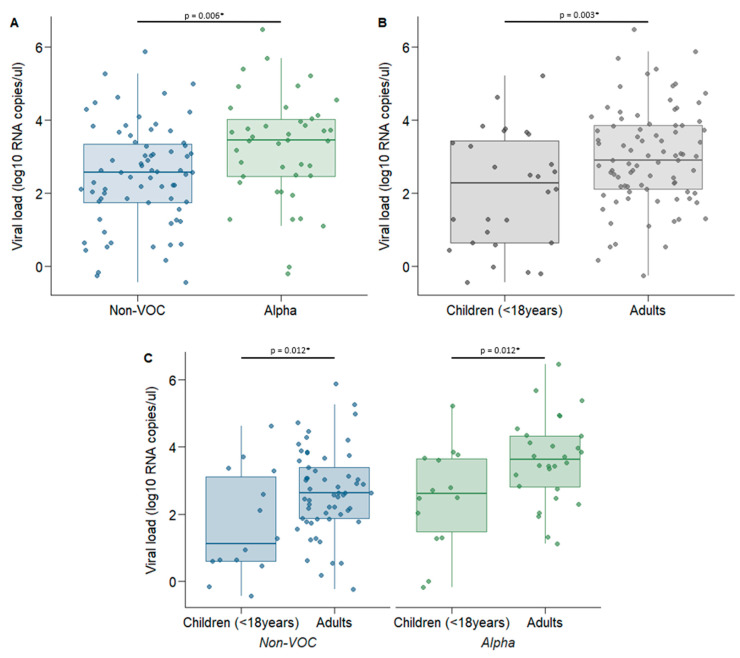
Figure 3.
Comparison of viral load (log10 RNA copies/µL eluate) measured by ddPCR for genetic variant and age groups The saliva sample with the lowest Ct value for each participant was selected for quantification of viral load using ddPCR. (A) Comparison of viral load between non-VOC (n = 71) and Alpha viruses (n = 42), (B) Comparison of viral load between children (n = 28) and adults (n = 85) for all genetic variants combined, (C) Comparison of viral load for genetic variants and age groups: non-VOC; children (n = 14) versus adults (n = 57), and Alpha variant; children (n = 14) versus adults (n = 28). * p < 0.05. p-Values were estimated using a mixed-effects linear regression.

