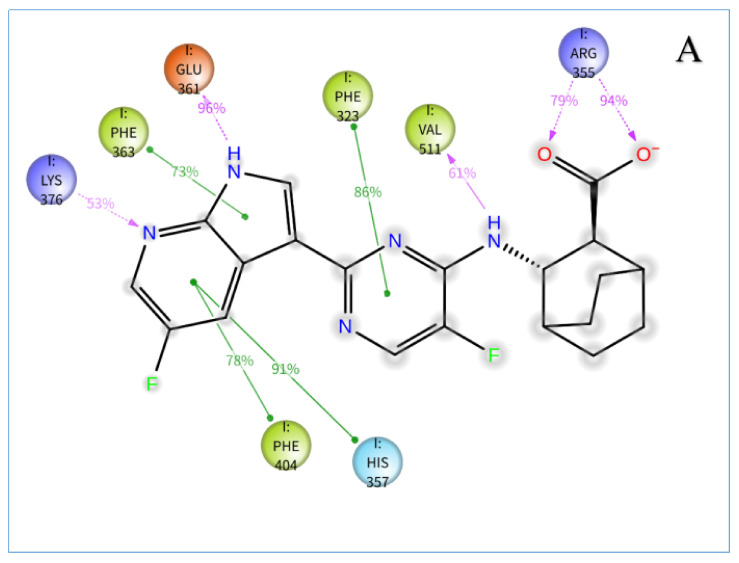
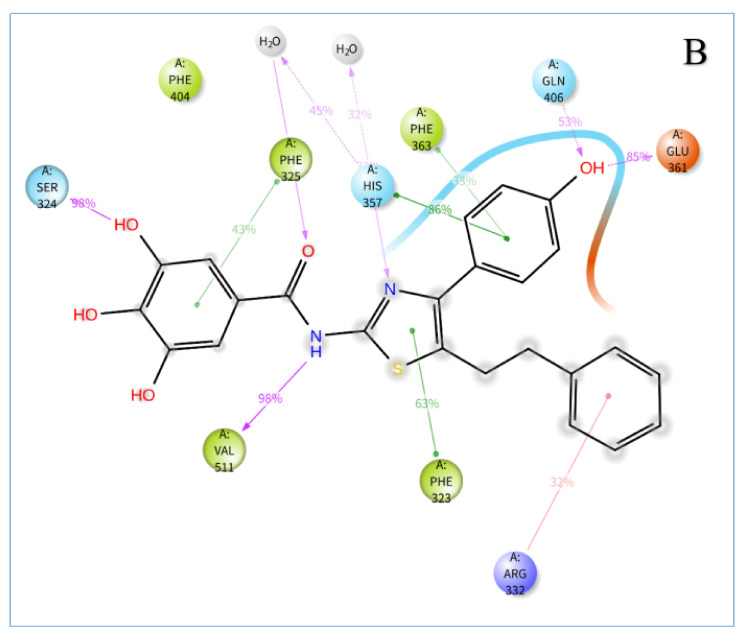
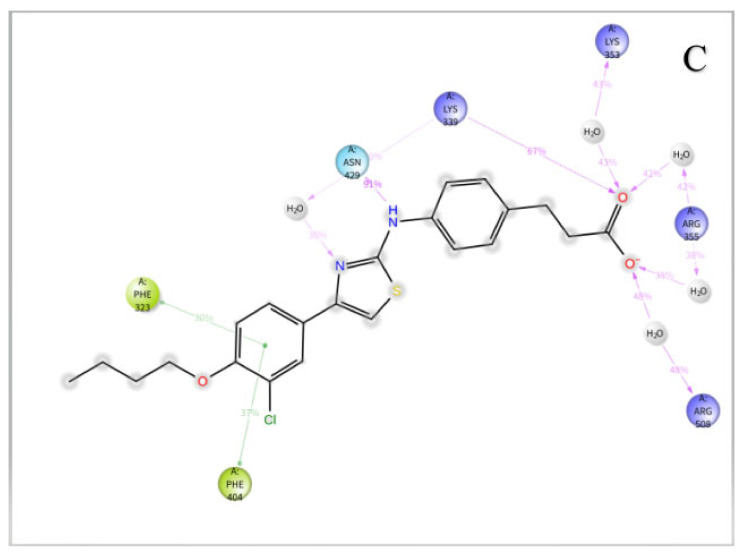
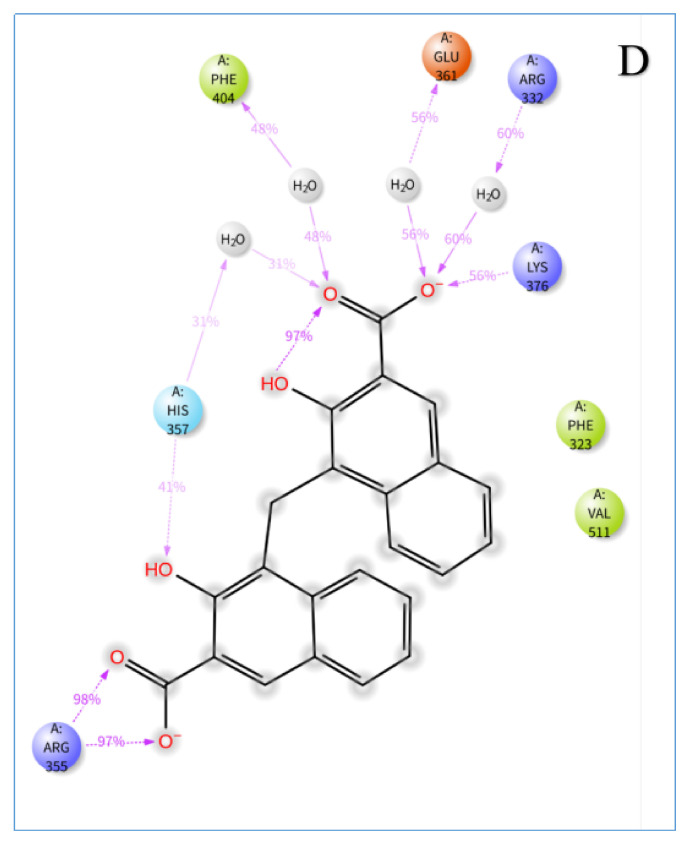
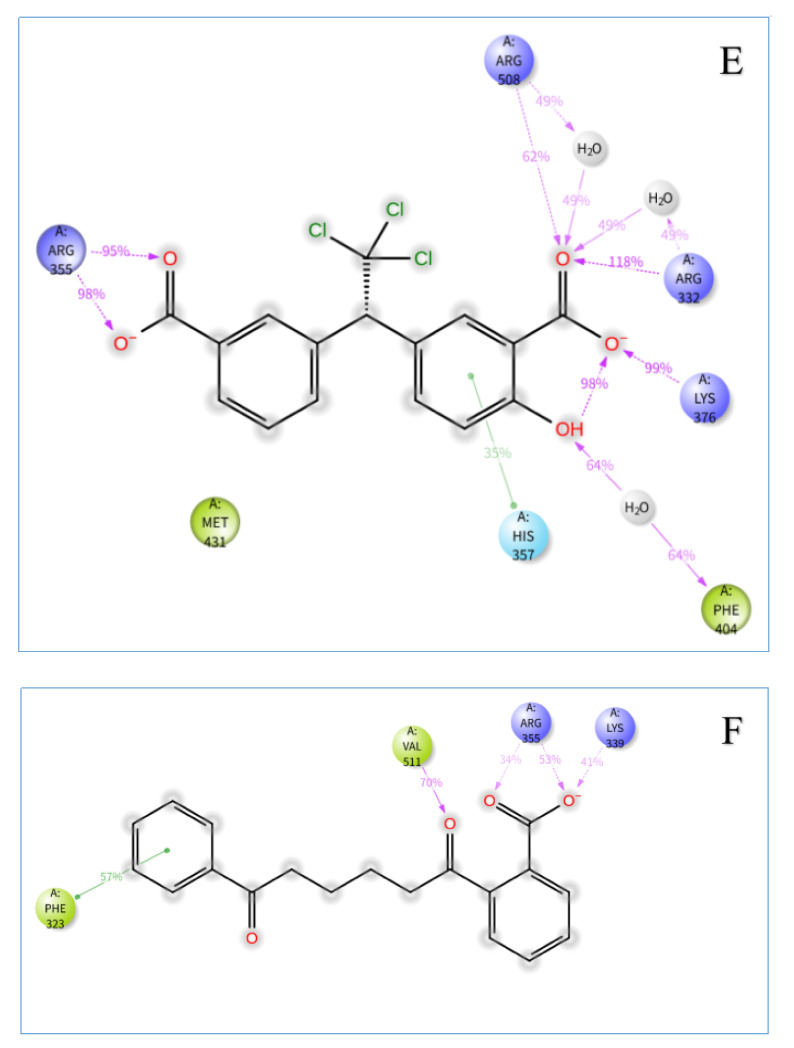
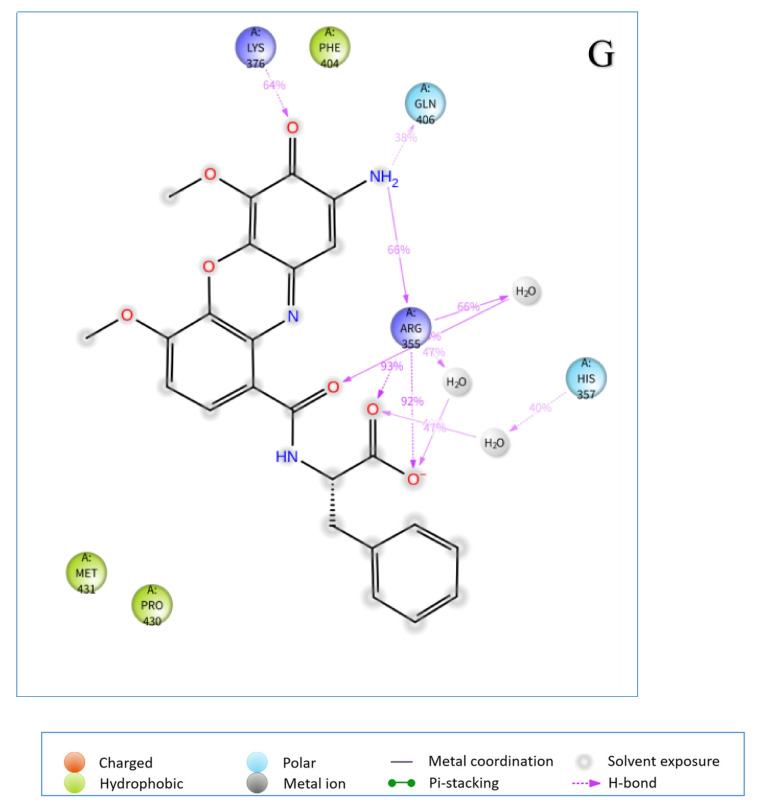
Figure 4.
2D summary of interaction analysis results of PB2-ligand complexes. The interaction pairs that occurred during more than 30% of the simulation time are included. Shown are interactions between (A) VX-787 and PB2; (B) Str1614 and PB2; (C) Str1916 and PB2; (D) Str3107 and PB2; (E): Str5776 and PB2; (F) Str6318 and PB2; and (G) Str7374 and PB2.

