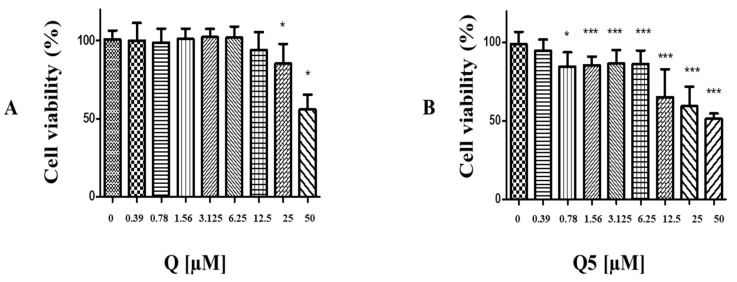
Figure 4.
Analysis of cytotoxic activity by MTT test in C6 cells exposed to Q and Q5 compound at concentrations of 50 µM and 7 1:2 dilutions. (A) C6 after 72 h of exposure to quercetin. (B) C6 after 72 h of exposure to quercetin pentaacetate (Q5). Cells under control conditions were treated with 0.05% DMSO—a vehicle for drug dilution. The results expressed as a percentage in relation to the control, taken as 100% (* p < 0.05; *** p < 0.001). The different patterns of the column chart represent different concentrations of quercetin (Q) in (A), and quercetin pentaacetate (Q5) in (B).

