Human atlastin GTPases are assumed to catalyze ER membrane fusion, but their fusion activity has not previously been reconstituted. Crosby et al. show that purified atlastin1 and atlastin2 are capable of fusion catalysis and that each is negatively regulated by a variable C-terminal extension.
Abstract
ER network formation depends on membrane fusion by the atlastin (ATL) GTPase. In humans, three paralogs are differentially expressed with divergent N- and C-terminal extensions, but their respective roles remain unknown. This is partly because, unlike Drosophila ATL, the fusion activity of human ATLs has not been reconstituted. Here, we report successful reconstitution of fusion activity by the human ATLs. Unexpectedly, the major splice isoforms of ATL1 and ATL2 are each autoinhibited, albeit to differing degrees. For the more strongly inhibited ATL2, autoinhibition mapped to a C-terminal α-helix is predicted to be continuous with an amphipathic helix required for fusion. Charge reversal of residues in the inhibitory domain strongly activated its fusion activity, and overexpression of this disinhibited version caused ER collapse. Neurons express an ATL2 splice isoform whose sequence differs in the inhibitory domain, and this form showed full fusion activity. These findings reveal autoinhibition and alternate splicing as regulators of atlastin-mediated ER fusion.
Introduction
The atlastin (ATL) GTPase was first identified as the causative gene at the SPG3A locus of the motor neurological disease hereditary spastic paraplegia (HSP; Zhao et al., 2001). Patients with mutations in the neuronally enriched ATL1 paralog exhibit progressive weakness and spasticity in the lower extremities (Fink, 2006) that is associated with the selective degeneration of the longest axons in the corticospinal tract (Deluca et al., 2004; Blackstone, 2012). Of the >20 identified HSP-linked gene products to date, several including ATL1 are ER localized, suggesting that ER functions contribute to maintaining the longest axons in the nervous system (Blackstone, 2012).
The most defined role for ATLs is in the homotypic membrane fusion reactions that link up the sheets and tubules of the ER network (Lee and Chen, 1988). First, overexpression of GTPase-defective ATL1 disease variants in HeLa cells, which do not express ATL1 but rely on the more ubiquitously expressed ATL2/3 paralogs, perturbs ER network morphology (Rismanchi et al., 2008). Second, depletion of endogenous ATL2/3 from HeLa or COS-7 cells disrupts ER network morphology (Hu et al., 2009; Hu et al., 2015), and this is rescued by the introduction of ATL1 or ATL2 (Morin-Leisk et al., 2011; Ulengin et al., 2015; Hu et al., 2015). Third, Drosophila melanogaster ATL (DATL), 50–60% identical to ATL1 and ATL2, not only substitutes for ATL2/3 in HeLa or COS-7 cells (Faust et al., 2015; Wu et al., 2015) but also is sufficient to catalyze the fusion of synthetic membrane vesicles when purified from Escherichia coli (Orso et al., 2009).
Biochemical and biophysical studies, relying largely on the truncated soluble domain of ATL1 and full-length DATL, have provided a detailed mechanistic view of the ATL fusion mechanism (McNew et al., 2013; Hu and Rapoport, 2016). Structurally, the N-terminal cytoplasmic GTPase domain (G domain), which is dynamin-related and undergoes nucleotide-dependent homodimerization (Byrnes and Sondermann, 2011; Bian et al., 2011), is linked through a short flexible linker to a fully folded three-helical bundle (3HB). The 3HB is followed in sequence by two closely spaced transmembrane (TM) helices that anchor ATL in the membrane but that may not span the entire bilayer (Betancourt-Solis et al., 2018) and a juxta-membrane amphipathic helix in the cytoplasmic tail (Liu et al., 2012; Faust et al., 2015). In brief, the model starts with GDP-bound ATLs in opposing membranes, with the 3HBs packed against the G domains and pointed away from the dimerization interface (Bian et al., 2011; Byrnes and Sondermann, 2011). Upon nucleotide exchange, GTP-induced conformational changes within the G domain heads expel the 3HBs, freeing the heads to engage with one another in trans (Byrnes et al., 2013). G domain dimerization, which serves to initiate the fusion reaction cycle by tethering opposing membranes to one another, is followed closely by a rigid body rotation of the 3HBs toward the G domain dimer interface and formation of a conformationally shifted, low-energy crossed-over dimer whose 3HBs are now in close parallel alignment and contact the G domains of the other subunit (Bian et al., 2011; Byrnes and Sondermann, 2011; Byrnes et al., 2013). Crossover formation, accompanied by insertion of the juxta-membrane tail amphipathic helix partway into the membrane to provide a bilayer destabilizing force, enables lipid mixing and fusion (Liu et al., 2012; Faust et al., 2015; Chernomordik and Kozlov, 2008). Finally, hydrolysis of GTP, likely triggered by G domain dimerization (Gasper et al., 2009), drives crossover dimer disassembly and resets the fusion machinery for subsequent reactions (Winsor et al., 2018).
While much has been learned of the fusion mechanism, whether ATLs might be regulated to control ER network formation, and under what conditions, remains unclear. Several ER proteins are reported to bind ATL1 (Evans et al., 2006; Hu et al., 2009; Park et al., 2010; Chang et al., 2013; Yamamoto et al., 2014; Wisesa et al., 2019), but how these interactions impact the presumed fusion activity of ATL1 is unknown. Further, the three ATL paralogs, each expressed in a tissue-specific manner, diverge from one another in their N- and C-terminal extensions, but the functional significance of the divergence is unknown. Each paralog is additionally alternatively spliced to generate five potential ATL2, two ATL1, and two ATL3 isoforms, all of which differ primarily in the N- and C-termini, but again the functional significance of all this diversity is unknown. These knowledge gaps are due in part to the lack of demonstrable in vitro fusion activity for any ATL protein other than DATL. When purified from E. coli, ATL1 lacks fusion activity even though it has measurable GTPase activity (Wu et al., 2015; Betancourt-Solis et al., 2018). This is perplexing, because the more distantly related ATL-like GTPases Saccharomyces Sey1 and Arabidopsis RHD3 are each capable of catalyzing fusion in vitro (Anwar et al., 2012; Zhang et al., 2013; Ueda et al., 2016). Additionally, the truncated, soluble domain of ATL1 is similar to DATL in terms of its structure and steady-state rate of GTP hydrolysis (Wu et al., 2015), as well as pre–steady-state rates of GTP-dependent crossover dimerization, GTP hydrolysis, and dimer disassembly (Winsor et al., 2018).
Here, we demonstrate that the canonical ATL1 (ATL1-1), purified from HEK293 cells adapted for growth in suspension (Fang et al., 2017), is capable of catalyzing membrane fusion in vitro. Fusion by ATL1 is comparable to that catalyzed by DATL from E. coli and depends on the requirements previously established for DATL. Moreover, the SPG3A disease variant R239C (Namekawa et al., 2006), the most common SPG3A mutation found in patients that curiously showed no observable fusion deficit when transplanted to DATL (Ulengin et al., 2015), causes markedly reduced fusion kinetics in the context of ATL1, consistent with an alteration in fusion being the cause of disease. Unexpectedly, the most common splice isoform of the ATL2 paralog (ATL2-1), deemed the canonical ATL2 isoform and expressed more broadly than ATL1 across multiple tissue types (Rismanchi et al., 2008), has little or no detectable fusion activity when purified in the same manner. However, when its C-terminal extension is removed, ATL2-1 not only catalyzes fusion but at a 10-fold more rapid rate than ATL1. Further analysis reveals that ATL1 is also negatively regulated by its C-terminal extension. These and additional findings reveal novel modes of ATL regulation and provide a foundation for understanding how ER network structure in humans may be fine-tuned by differential regulation of the ATL fusion machinery.
Results
ATL1 has in vitro fusion activity
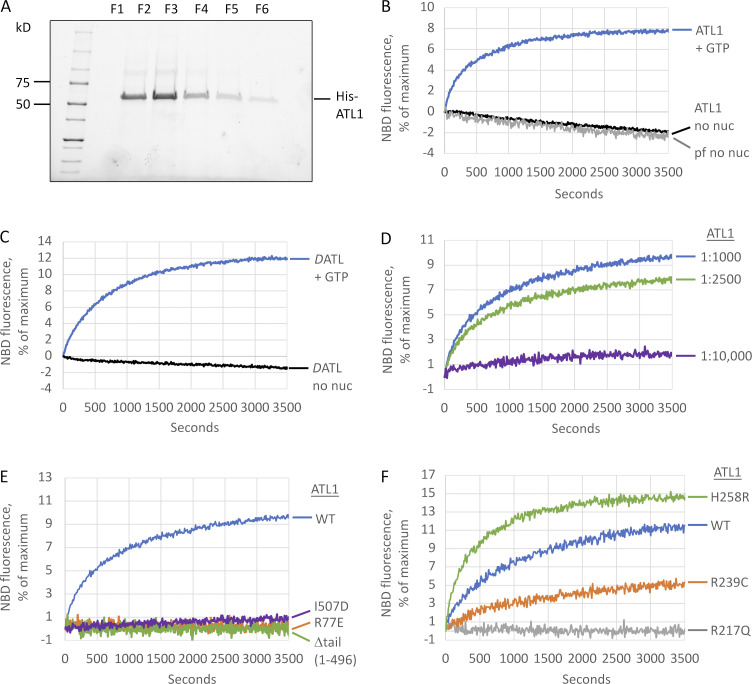
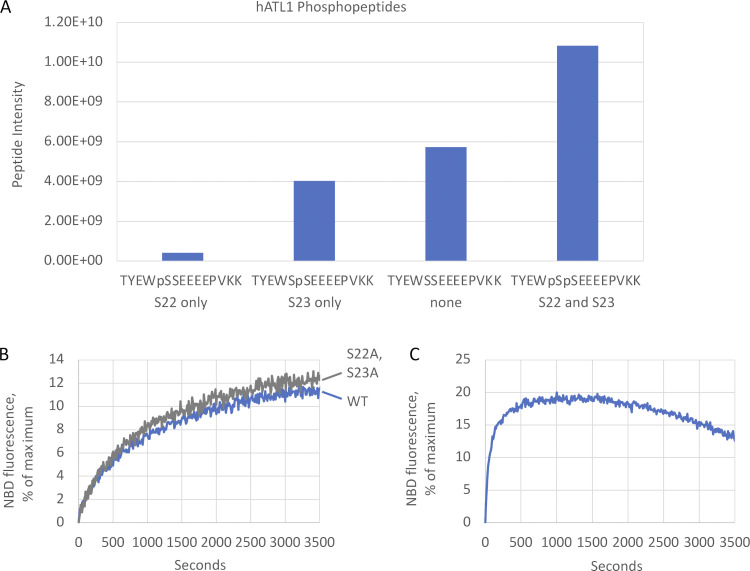
One plausible explanation for the previously observed lack of ATL1 fusion activity in vitro was that the human protein requires a posttranslational modification that is lacking when purified from bacteria; therefore, we turned to a HEK293-derived suspension cell line (Fang et al., 2017), which, upon transient transfection with His-tagged ATL1 and purification on Ni2+-NTA, yielded milligram quantities of highly pure protein (Fig. 1 A). To assay fusion, we used a lipid mixing assay established for DATL that monitors dequenching of fluorescently labeled lipids upon mixing and dilution with unlabeled lipids (Orso et al., 2009). When incorporated into labeled and unlabeled vesicles at a protein-to-lipid ratio of 1:1,000, ATL1 catalyzed lipid mixing in a GTP-dependent manner (Fig. 1 B) at a rate comparable to that of DATL purified from E. coli (Fig. 1 C). Mass spectrometric analysis detected S22 and S23 of ATL1 as heavily phosphorylated (Fig. S1 A); however, fusion activity could not be attributed to phosphorylation at those sites, as alanine substitution of both had no effect (Fig. S1 B). Notably, even DATL was more active when purified from HEK cells (Fig. S1 C). As previously reported for DATL (Liu et al., 2015), ATL1 lipid mixing activity was robust at 1:2,500 but mostly absent at 1:10,000 (Fig. 1 D). For both ATL1 and DATL, a slow rate of photobleaching independent of ATL or GTP was observed and subtracted from all subsequent analyses.
Figure 1.
Human ATL1 has fusion activity. (A) His-tagged ATL1 fractions eluted from a Ni+2 column and resolved on SDS-PAGE. AH, amphipathic helix. (B) ATL1 was reconstituted into donor and acceptor vesicles (1:2 donor/acceptor), and fusion was monitored during the dequenching of NBD-labeled lipid present in the donor vesicles over time at 37°C after addition of 2 mM GTP or buffer (no nuc). Loss of NBD fluorescence without GTP was attributed to photobleaching, because it mimicked NBD loss from protein-free liposomes (pf no nuc). (C) Lipid mixing by DATL from E. coli with or without GTP performed as in B. (D) ATL1 lipid mixing after reconstitution at varying protein/lipid ratios. (E) Lipid mixing by WT, R77E, Δtail ATL1(1–496), and I507D showing a requirement for GTP binding, the amphipathic helix, and the nonpolar face of the amphipathic helix. (F) Comparison of ATL1 HSP mutant variants H258R, R239C, and R217Q to WT. All lipid mixing was performed at a 1:1,000 protein/lipid ratio unless otherwise stated. The data are the average of at least two independent traces.
Figure S1.
Phosphorylation does not account for ATL1 fusion activity. (A) Intensity of singly and doubly phosphorylated TYEWSSEEEEPVKK peptides and the unmodified counterpart. (B) Lipid mixing by WT ATL1 and phosphomutant S22A, S23A. (C) Lipid mixing by DATL purified from HEK cells is faster than by DATL purified from E. coli. All lipid mixing was performed at a 1:1,000 protein/lipid ratio, and the data are the average of at least two individual traces.
Fusion catalysis by DATL depends on GTP binding and G-domain dimerization and crossover (Orso et al., 2009; Bian et al., 2011; Saini et al., 2014; Liu et al., 2015; Winsor et al., 2017), as well as a juxta-membrane amphipathic helix in the cytoplasmic tail (Liu et al., 2012; Faust et al., 2015). Fusion by ATL1 had the same requirements as DATL. An R77E mutation abolished lipid mixing (Fig. 1 E); R77 is critical not only because it mediates a transient G domain–to–G domain contact during crossover dimer formation (Bian et al., 2011; Byrnes and Sondermann, 2011) but also because it is essential for neutralizing the negatively charged transition state intermediate of GTP hydrolysis (Byrnes et al., 2013). Also, little or no fusion signal was observed with either a truncation removing the entire ATL1 tail harboring the required amphipathic helix (Δtail ATL1(1–496)) or with a single nonpolar to charged (I507D) amino acid substitution designed to disrupt the nonpolar face of the ATL1 amphipathic helix (Liu et al., 2012; Fig. 1 E).
A common SPG3A ATL1 disease variant has altered fusion activity
ATL1/SPG3A was originally identified by genetic linkage analysis of three independent kindreds (autosomal dominant HSP-P, -T, and -S), each presenting with an early onset autosomal dominant form of HSP (Zhao et al., 2001). Since then, >30 additional mutations, mostly missense mutations in the GTPase domain of ATL1, have been identified (Guelly et al., 2011). Certain SPG3A mutations such as R217Q are expected to perturb fusion, as they abrogate both GTP-dependent dimerization and GTP hydrolysis, even when assayed in the context of the truncated ATL1 soluble domain (Byrnes and Sondermann, 2011). Other SPG3A mutations have only minor effects (Byrnes and Sondermann, 2011). We previously attempted to address whether these more modest mutations impact fusion, but by necessity, we used DATL as a proxy for ATL1, as fusion had not yet been reconstituted for the latter (Ulengin et al., 2015). In that study, we observed no obvious fusion deficit for R239C (R214C in DATL), and higher-than-normal fusion activity was observed for H258R (S233R in DATL). This was surprising because R239C and H258R are both G domain substitutions and correspond to the original HSP-S and -T kindreds, respectively. Moreover, R239C is the most common SPG3A mutation, reported 10 times more frequently than the others and in unrelated families (Namekawa et al., 2006). Firm conclusions could not be drawn from our earlier study, however, as we could not exclude the possibility that the same mutations would have different consequences in the context of ATL1 (Ulengin et al., 2015).
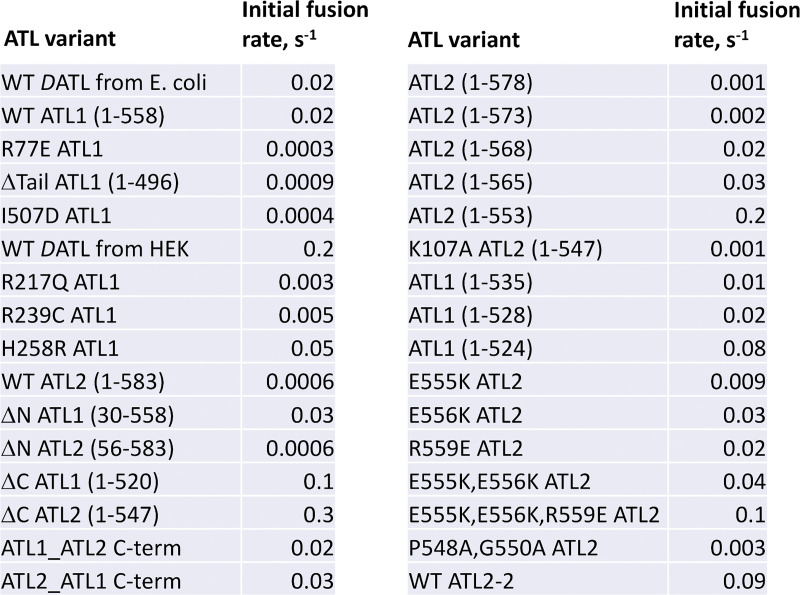
With the reconstitution of ATL1 fusion activity in hand, we reassessed the effects of R239C and H258R. To start, we first confirmed that the dimerization-defective R217Q variant lacked any detectable activity as expected (Fig. 1 F). In contrast, both R239C and H258R were fusion active; however, their fusion rates differed from those of the parent protein (Fig. 1 F). To compare fusion rates, we incorporated each at the same 1:1,000 protein/lipid ratio and measured the initial slope of the dequenching curve (typically within the first 30–60 s). Using this approach, the observed fusion rate for WT ATL1 was 0.02% of maximal dequenching per second, or 0.02/s, the same as DATL purified from E. coli, whereas R239C had a reduced rate of 0.005/s (see Fig. S2 for the fusion rates of all variants tested in this study). Thus, this most common SPG3A mutation in fact impairs ATL1 fusion activity, underscoring the importance of studying disease variants in the context of the parent protein. Interestingly, H258R, which caused an increase in fusion rate in the context of DATL (Ulengin et al., 2015), did so again with ATL1 (Fig. 1 F), more than doubling the rate from 0.02 to 0.05/s. How an increase in fusion rate causes disease remains to be understood, but the higher rate of the H258R variant hinted that the activity of the parent protein can be further stimulated (see below).
Figure S2.
Comparison of fusion rates for all ATL variants in this study. Initial lipid mixing rates (as the percentage of maximum lipid mixing possible per second) observed for all ATL variants in this study.
ATL1 and ATL2 fusion activity is each inhibited by its own C-terminal extension
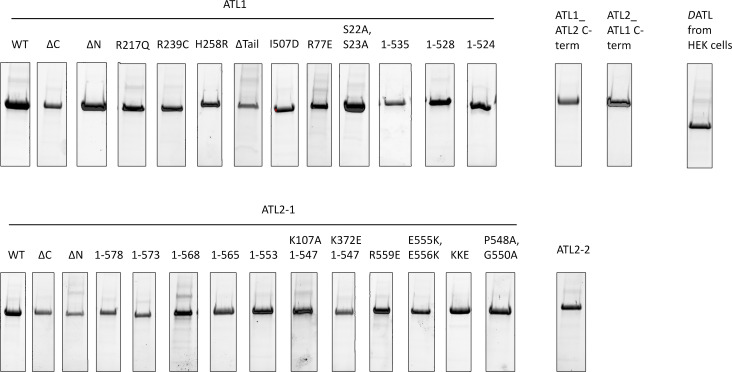
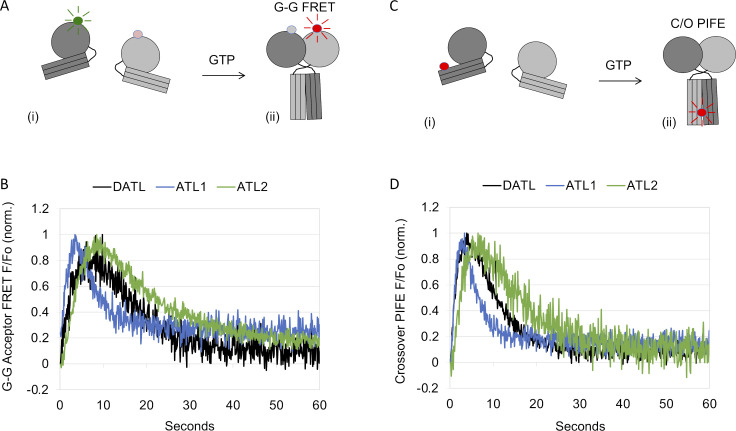
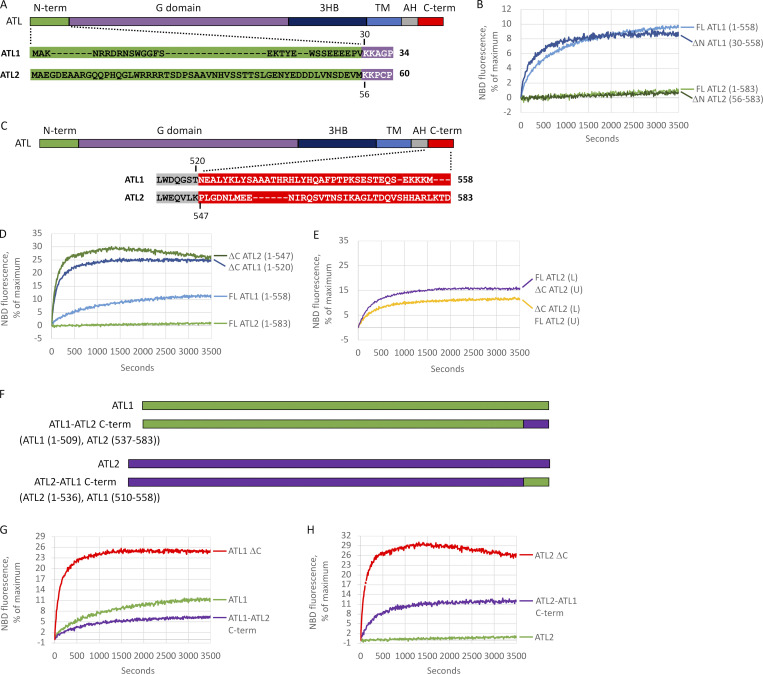
Having reconstituted the lipid mixing activity of ATL1, we expanded our analysis to the more ubiquitously expressed ATL2. Its yield and purity from HEK cells were comparable to ATL1 (Fig. S3), but surprisingly, we observed negligible lipid mixing activity from ATL2. This was unexpected, because most cell types express ATL2/3 rather than ATL1 (Rismanchi et al., 2008). Further, the ATL2 soluble domain dimerizes and hydrolyzes GTP similarly to ATL1 and DATL (Morin-Leisk et al., 2011) and showed similar single-turnover kinetics of crossover dimerization and disassembly (Fig. S4). Notably, ATL1 and ATL2 are well conserved throughout the G domain, 3HB, and amphipathic helix but have variable length and poorly conserved N- and C-terminal extensions (Fig. 2, A and C). To test for potential autoinhibition by the N-terminus, the entire extension (Fig. 2 A; residues highlighted in green) was deleted from either ATL2 or ATL1. N-terminal truncation had no effect on ATL2 (Fig. 2 B), although it slightly increased the ATL1 fusion rate, from 0.02 to 0.03/s. Our attention next turned to the also poorly conserved C-terminal extension (Fig. 2 C; residues highlighted in red). Again, we truncated the extensions of either ATL2 or ATL1 while attempting to preserve the integrity of the required amphipathic helix of each (Liu et al., 2012; Faust et al., 2015). Remarkably, C-terminal truncation activated ATL2 (Fig. 2 D), increasing its initial fusion rate by 500-fold, from 0.0006 to 0.3/s. C-terminal truncation of only one of the donor/acceptor pair was sufficient to stimulate ATL2 fusion (Fig. 2 E), with in an intermediate fusion rate of 0.03 or 0.04/s, depending on whether ΔC ATL2 was in the donor or acceptor liposomes, respectively. C-terminal truncation also increased the fusion rate of ATL1 (Fig. 2 D), from 0.02 to 0.1/s. These data suggested that the variable C-terminal extensions of both ATLs have an inhibitory role, with the C-terminus of ATL2 being a more potent inhibitor of fusion. To confirm this, we swapped the two C-terminal extensions (Fig. 2 F). ATL1 with the ATL2 C-terminal extension had a lower initial fusion rate than ATL1 (Fig. 2 G), while ATL2 with the ATL1 C-terminal extension had a higher rate than ATL2, though the rate was still less than when the C-terminal extension was deleted (Fig. 2 H). Thus, the C-terminal extensions were somewhat interchangeable, but the C terminus of ATL2 was a more potent inhibitor than that of ATL1.
Figure S3.
ATL1 and ATL2 protein purity. Peak Ni2+-NTA fractions of all His-tagged ATL1 and ATL2 variant proteins in this study are shown after resolving on SDS-PAGE and staining with SYPRO ruby.
Figure S4.
cyt-ATL2 has single turnover kinetics of dimerization and crossover formation similar to those of cyt-ATL1 and cyt-DATL. (A) Schematic of FRET as cyt-ATL monomers labeled with a FRET donor and acceptor on the G domain (i) undergo G domain dimerization (G-G FRET; ii). (B) Comparison of G-G acceptor FRET for cyt-ATL2, cyt-ATL1, and cyt-DATL after GTP addition under stopped flow. norm., normalized. (C) Schematic of Cy3 fluorescence enhancement as Cy3-labeled cyt-ATL2, cyt-ATL1, and cyt-DATL (i) undergo dimer formation and crossover (C/O PIFE; ii). (D) Comparison of crossover PIFE for cyt-ATL2, cyt-ATL1, and cyt-DATL after GTP addition under stopped flow. All reactions contained 15 µM cyt-ATL and 7.5 µM GTP (final) and were at 25°C. All traces are the average of three to five individual traces and normalized (initial value = 0; maximum value = 1).
Figure 2.
ATL1 and ATL2 are autoinhibited by a variable C-terminal extension. (A) Alignment of ATL1 and ATL2 N-terminal extensions. (B) Lipid mixing by full-length (FL) ATL1, ΔN ATL1(30–558), FL ATL2, and ΔN ATL2(56–583). (C) Alignment of ATL1 and ATL2 C-terminal extensions. (D) Lipid mixing by FL ATL1, ΔC ATL1(1–520), FL ATL2, and ΔC ATL2(1–547). (E) Lipid mixing between FL and DC ATL2 in trans. DC ATL2 in labeled liposomes (L) were mixed with FL ATL2 in unlabeled liposomes (UL) at a 1:2 ratio or vice versa. (F) Schematic of ATL1/2 chimeras. (G) Lipid mixing by ATL1 WT, ΔC ATL1, and ATL1-ATL2 C-terminal chimera. (H) Lipid mixing by ATL2 WT, ΔC ATL2, and ATL2-ATL1 C-terminal chimera. All proteins were incorporated at a 1:1,000 protein/lipid ratio, and the data are the average of at least two independent traces.
Residues adjacent to the required amphipathic helix mediate autoinhibition of ATL2
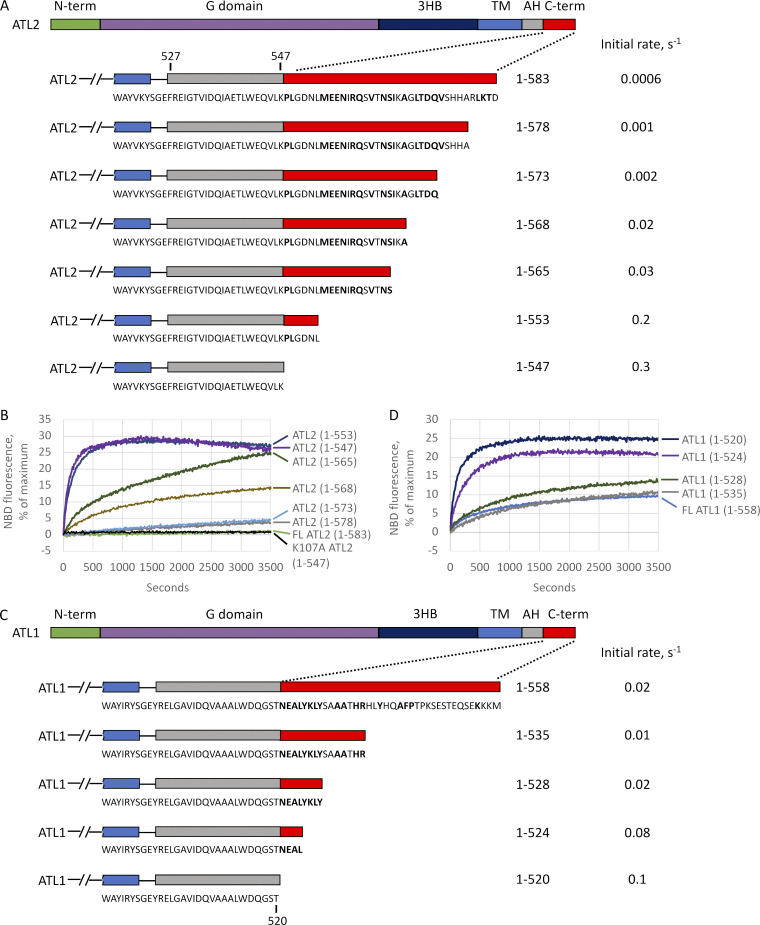
To begin determining the residues mediating autoinhibition, we started with serial truncations from the C terminus of ATL2. Though the extensions of canonical ATL1, ATL2, and ATL3 share no sequence similarity, each is moderately conserved across vertebrates (Fig. 3 A; conserved residues in bold). For ATL2, each small truncation up to the amphipathic helix had a measurable positive effect on the initial fusion rate (Fig. 3, A and B), suggesting an extended length of the C-terminal extension mediating the inhibition. Nonetheless certain stretches had a more profound effect than others when deleted. For instance, removal of AA569-573 and AA554-565 increased the observed fusion rate by 10- and 6-fold, respectively (compare ATL2(1–568) to ATL2(1–573); and ATL2(1–553) to ATL2(1–565)), whereas removal of other stretches had a more modest, 1.5- or 2-fold effect. Importantly, the 500-fold increase in initial fusion rate upon deletion of the entire C-terminal extension was blocked by the nucleotide-binding mutation K107A (Fig. 3 B), indicating that the fusion activity revealed by truncation was not off-target activity. Finally, we noticed that AA554-565 is very near the amphipathic helix required for fusion (see Fig. 7 A).
Figure 3.
Mapping the ATL2 C-terminal inhibitory domain. (A) Schematic of serial truncations of the ATL2 C-terminal extension. C-terminal residues identical in D. rerio ATL2 are in bold. Initial fusion rates were calculated from the data shown in B. AH, amphipathic helix. (B) Lipid mixing by the ATL2 truncations shown in A. (C) Schematic of serial truncations of the ATL1 C-terminal extension. C-terminal residues identical in D. rerio ATL1 in bold. Fusion rates were calculated from the data shown in D. (D) Lipid mixing by the ATL1 truncations shown in C. All proteins were incorporated at a 1:1,000 protein/lipid ratio, and the data are the average of at least two independent traces.
Figure 7.
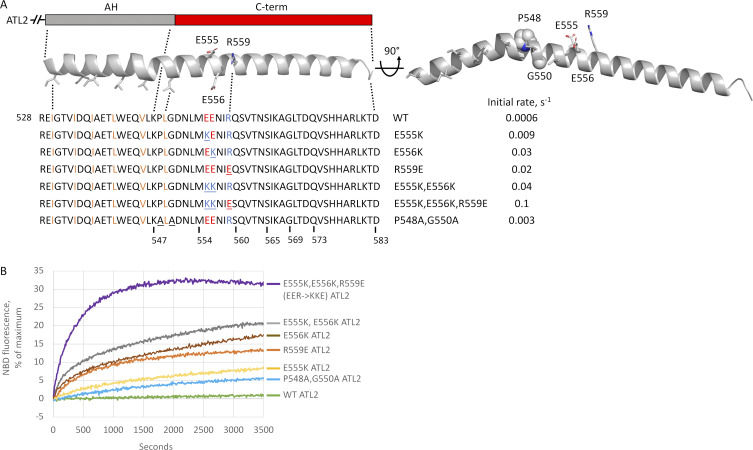
Charge reversal in predicted C-terminal α-helix activates ATL2. (A) AlphaFold structure prediction (Jumper et al., 2021) of the ATL2 tail rendered in cartoon form in PyMOL. Nonpolar residues of the amphipathic helix shown as sticks and highlighted in orange. Inhibitory domain residues selected for charge reversal also shown as sticks and highlighted in red (acidic) or blue (basic). Charge reversal variants tested in B and initial fusion rates for each variant are indicated, and residues substituted in each variant are underlined. Also shown is a rotated view of the helix to highlight the slight bend in the helix predicted by AlphaFold, residues P548 and G550 that may mediate the bend highlighted as spheres, and the P548A/G550A variant designed as a possible test of the role of the predicted helical bend. AH, amphipathic helix. (B) Lipid mixing by each of the indicated variants in A. All proteins were incorporated at a 1:1,000 protein/lipid ratio, and the data are the average of at least two independent traces.
Residues adjacent to the required amphipathic helix of ATL1 also mediate autoinhibition
A similar set of serial truncations revealed a more localized inhibitory domain in ATL1 (Fig. 3, C and D). Deletion of ≤30 amino acids from the C-terminal end caused little or no change in fusion rate. However, the removal of AA521-528 increased the fusion rate fivefold. While ATL1 and ATL2 share no sequence similarity in this region of the C terminus, the location of the ATL1 inhibitory domain was also adjacent to the required amphipathic helix (Fig. 3 C).
The autoinhibitory ATL2 C-terminal extension impairs membrane tethering
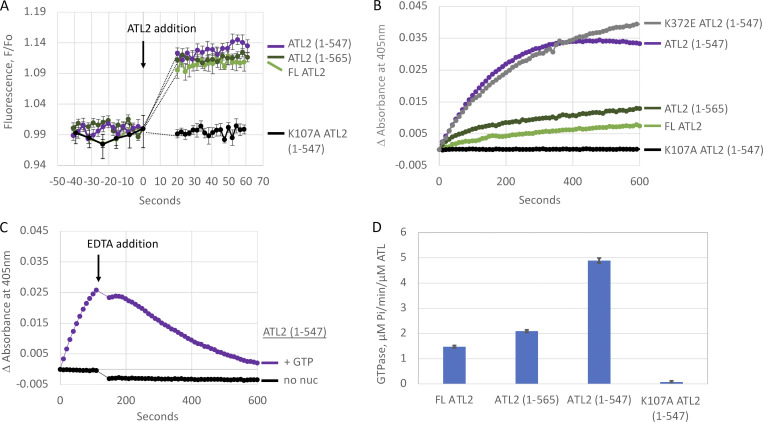
To determine the step at which fusion is autoinhibited, we focused on the more strongly autoinhibited ATL2 paralog. First, we assayed GTP binding using N-methylanthraniloyl (mant)-labeled GTP, a fluorescent GTP analogue that undergoes fluorescence enhancement upon protein binding (Moore et al., 1993). Binding was indistinguishable for full-length ATL2 and two strongly activating truncations, ATL2(1–565) and ATL2(1–547), at least within the time resolution of the assay (Fig. 4 A). As expected, the nucleotide-binding mutant variant K107A(1–547) showed no GTP binding.
Figure 4.
ATL2 C-terminus impairs G domain–mediated tethering and GTP hydrolysis, but not GTP binding. (A) Mant-GTP binding by FL ATL2, ATL2(1–565), ATL2(1–547), and K107A ATL2(1–547). Baseline fluorescence was established for 40 s followed by addition of ATL2 with the first reading after 20 s, an average of ≥5 individual traces (±SEM). (B) Tethering monitored as the change in 405-nm absorbance after the addition of 2 mM GTP. (C) Reversibility of GTP-dependent tethering by ATL2(1–547). 120 s after the initial addition of buffer or GTP as in B, EDTA was added to 18 mM. (D) Steady-state GTPase activity. Average (±SEM) of at least three independent measurements. All assays used ATL2 proteins incorporated at a 1:1,000 protein/lipid ratio.
According to current models, the next step in the fusion reaction cycle is G domain–mediated trans dimerization (McNew et al., 2013; Hu and Rapoport, 2016), which manifests as an increase in 405-nm absorbance due to an increase in light scattering when 100–300-nm vesicles bind one another in an ATL- and GTP-dependent manner to produce larger tethered vesicle clusters (Liu et al., 2015). Using this assay, we observed that tethering was not abolished but was markedly suppressed by the C terminus, as evidenced by the small signal observed for full-length ATL2 (Fig. 4 B). Partial truncation of the C terminus (1–565) increased the initial tethering rate by twofold, and complete removal of the C terminus (1–547) increased it fivefold. The increased tethering upon complete C-terminal removal was reversed by subsequent addition of EDTA (Fig. 4 C), previously shown to dissociate tethered vesicles (Orso et al., 2009; Saini et al., 2014; Liu et al., 2015), and tethering was blocked altogether by the K107A nucleotide-binding mutation, indicating a strict dependence of tethering on nucleotide binding (Fig. 5 B). The tethering increase, however, did not depend on forming the crossover conformation, as the K372E mutation we showed previously to disrupt ATL2 crossover (Morin-Leisk et al., 2011) did not alter the robust tethering caused by the C-terminal truncation (Fig. 4 B). These data suggested that autoinhibition of ATL2 fusion activity by the C terminus occurs at least in part through impairment of G domain–mediated trans dimerization and tethering before crossover formation.
Figure 5.
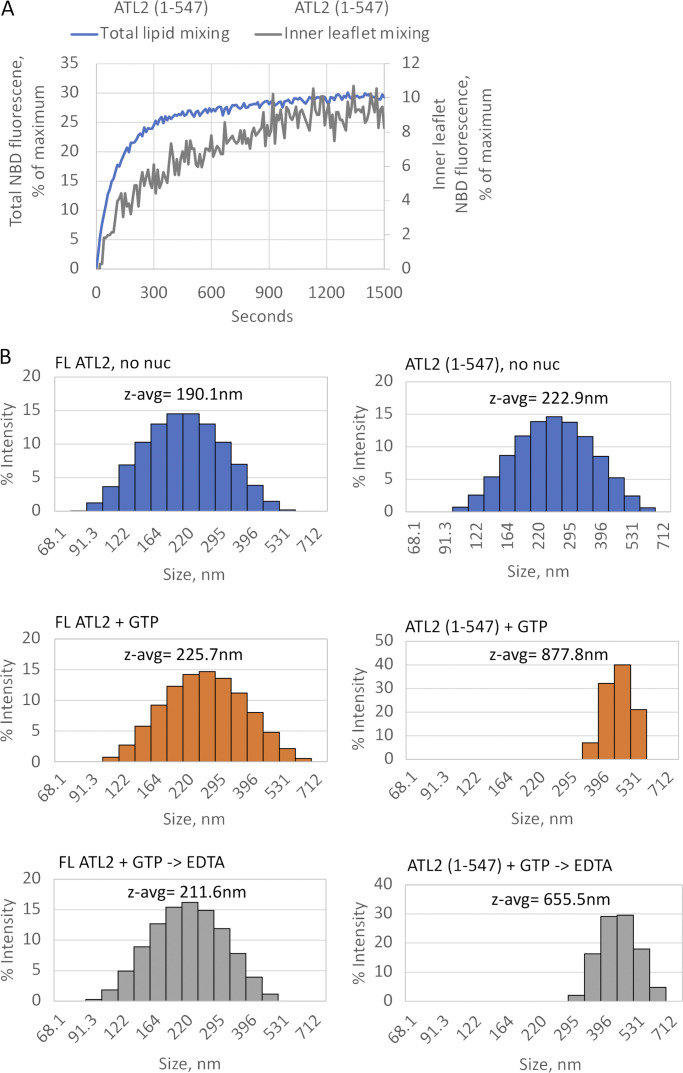
ATL2(1–547) catalyzes full fusion. (A) ATL2(1–547) catalyzes both outer and inner leaflet lipid mixing. Inner leaflet mixing was measured after first quenching NBD in the outer leaflet with the membrane-impermeable compound sodium dithionite. For reference, the data are plotted relative to total lipid mixing by the same variant. (B) Dynamic light scattering of FL ATL2 liposomes (left) or ATL2(1–547) liposomes (right) incubated at 37°C with buffer (upper panels, no nuc), 2 mM GTP for 10 min (middle panels), or 2 mM GTP for 10 min followed by 10-min EDTA treatment (18 mM final concentration).
Finally, we examined the effect of the ATL2 C terminus on GTP hydrolysis. Since GTP hydrolysis is most likely triggered by G domain dimerization (Winsor et al., 2018; Gasper et al., 2009), and the C terminus reduced but did not block tethering (Fig. 4 B), we predicted that the C terminus would also reduce, but not block, nucleotide hydrolysis. Indeed, full-length ATL2 had a modest steady-state rate of GTP hydrolysis, which was increased progressively by partial (1–565) and complete (1–547) removal of the C terminus, from 1.5 to 2.1 and 4.9 µM/min/µM ATL, respectively (Fig. 4 D). This suggested that the C terminus modestly suppresses GTPase activity, whereas its removal stimulates it. The K107A mutation that disrupts nucleotide binding blocked GTPase activity altogether, as expected (Fig. 4 D). The similar-magnitude effect of the C terminus on both tethering and GTP hydrolysis rates was consistent with autoinhibition of fusion occurring at least in part at the level of G-domain trans dimerization. Weakening of the G-domain dimer could impair the ability of the G domains to engage stably in trans, thereby weakening the tethered state and hindering forward progress to fusion. Similarly, GTP hydrolysis would be reduced but not blocked, causing disassembly and turnover of the weakly tethered state. Of note, these data did not rule out additional effects of the C terminus later in the fusion reaction cycle. While each C terminal truncation stimulated both tethering and GTP hydrolysis rates to a similar degree, each approximate doubling of tethering and GTP hydrolysis rates translated to an ∼10-fold increase in fusion rate. The basis for the disproportionately larger effect on the fusion rate is unclear but may be indicative of the C terminus separately regulating the transition from the tethered to the fused state.
Removal of C-terminal autoinhibition enables full fusion by ATL2
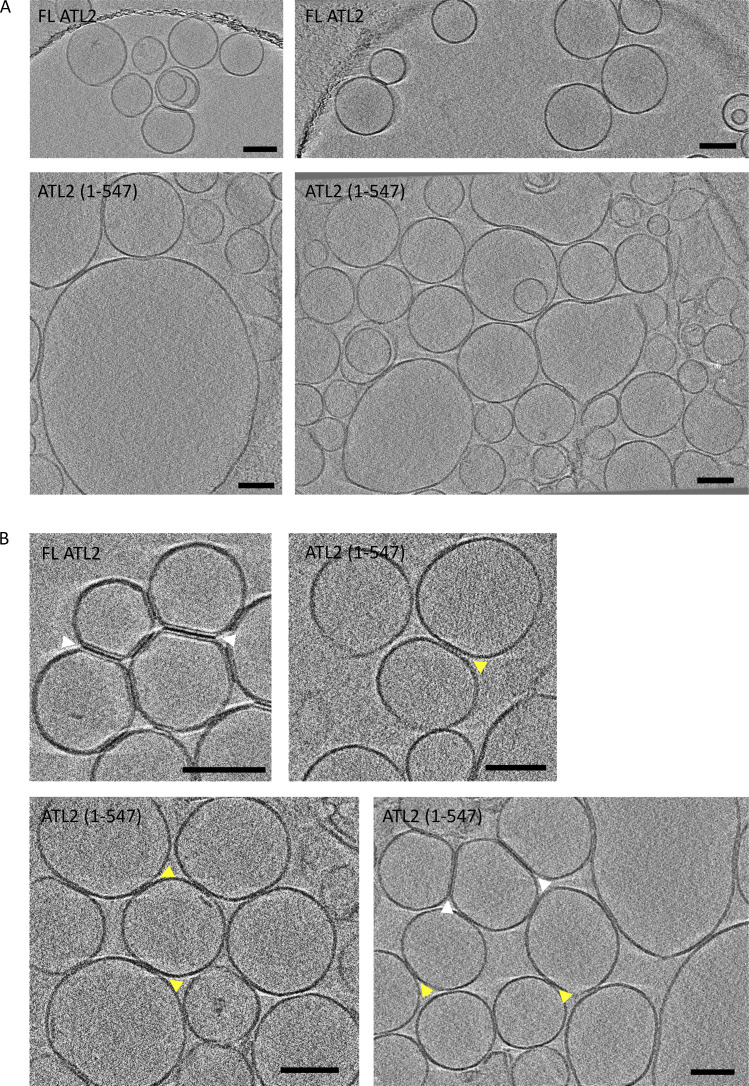
Three different measures indicated complete fusion catalysis by ATL2 upon relief of autoinhibition by C-terminal truncation. First, sodium dithionite reduction of outer leaflet NBD-labeled lipids to a nonfluorescent derivative (Meers et al., 2000) revealed inner leaflet mixing by ATL2(1–547) (Fig. 5 A). Second, dynamic light scattering analysis of ATL2(1–547) liposomes incubated with GTP, followed by dilution that leads to loss of the tethered state, revealed a substantial increase in vesicle size, from an average ∼200 to >600 nm in diameter (Fig. 5 B, compare upper right to middle right panel). EDTA treatment before dynamic light scattering analysis further confirmed that the size change was not due to residual tethers (Fig. 5 B, compare middle right to lower right panel). As expected, full-length ATL2, which showed only negligible lipid mixing (Fig. 2 B), showed no significant increase (Fig. 5 B, compare upper left to middle and lower left panel). The third measure of full fusion used cryo-EM tomography, which revealed a dramatic increase in the range of vesicle sizes generated by ATL2(1–547) relative to the full length even as early as 30 s after GTP addition (Fig. 6 A), again confirming fusion of both inner and outer leaflets by ATL2 upon removal of its C terminus. Finally, cryo-EM tomography revealed a qualitative difference in the appearance of putative tethers with and without C-terminal truncation (Fig. 6 B). Of the few vesicles that appeared tethered by full-length ATL2, “tight zippers” with a strong density at the tethered interface were the most common putative tether interface. In contrast, tight zippers were the minority in the large number of vesicles that appeared tethered by ATL2(1–547). Instead, putative attachment points between liposomes had a more diffuse appearance, possibly reflecting a less-ordered arrangement of ATL molecules at the tethered interface (Fig. 6 B).
Figure 6.
Cryo-ET analysis of tethering and fusion. FL ATL2 and ATL2(1–547) were reconstituted into liposomes, incubated with GTP for 30 s, and processed for cryo-EM. (A) FL ATL2 liposomes remained at the starting size of 100–300 nm, while ATL2(1–547) liposomes were substantially larger. (B) FL ATL2 liposomes were predominantly tethered by tight zippers (white arrows), whereas ATL2(1–547) liposomes appeared to be attached by both tight zippers (white arrows) and more diffuse zippers (yellow arrows). Scale bars, 100 nm.
Autoinhibition is disrupted by charge reversal of residues adjacent to the required amphipathic helix
To gain insight into a potential autoinhibitory mechanism, we further analyzed the more potent inhibitory C terminus of ATL2, focusing on the inhibitory residues closest to the amphipathic helix, AA548-565. As the structure of neither the TM domain nor the cytoplasmic tail had yet been determined, we took advantage of the protein structure prediction tool AlphaFold (Jumper et al., 2021; https://alphafold.ebi.ac.uk/). AlphaFold predicted that the cytoplasmic tail of ATL2 (aa 528–580), including both the amphipathic helix and the entire C-terminal extension, adopts a continuous α helical conformation (Fig. 7 A), albeit with a slight bend or kink, between the two elements (70–90% confidence score for helical continuity within aa 528-567; 50–70% for aa 568-580). Within the 554–565 stretch and essentially adjacent to the amphipathic helix, we noticed three charged residues, E555, E556, and R559, conserved between human and Danio rerio ATL2 (Fig. 3 A). In the AlphaFold prediction, E556 emanates from the nonpolar face of the amphipathic helix, whereas E555 and R559 emerge perpendicularly to it (Fig. 7 A). To test the role of these charged residues, either single, double, or triple charge reversals were produced. None of the charge reversals were predicted to compromise helical continuity by the JPred4 Protein Secondary Structure Prediction server, which provides secondary structure predictions based on the JNet algorithm (Cuff et al., 1998; https://www.compbio.dundee.ac.uk/jpred/). Individual charge reversals increased the fusion rate by >10-fold; the double charge reversal (E555K and E556K) increased it further; and the triple reversal (E555K, E556K, and R559E) increased the rate by >100-fold, to 0.1/s. The rate approached 0.3/s with truncation of the entire C-terminal extension (Fig. 7, A and B), with the threefold difference possibly attributable to residual autoinhibition for the triple charge reversal. Finally, we noticed that the predicted bend in the otherwise continuous tail α-helix coincided with the presence of a proline and a glycine residue; the former is known to cause helical bends, and the latter sometimes coincides with turns. Alanine substitution of these residues (P548A and G550A) had a measurable effect but did not block autoinhibition (Fig. 7, A and B).
Loss of ATL2 autoinhibition alters cellular ER morphology
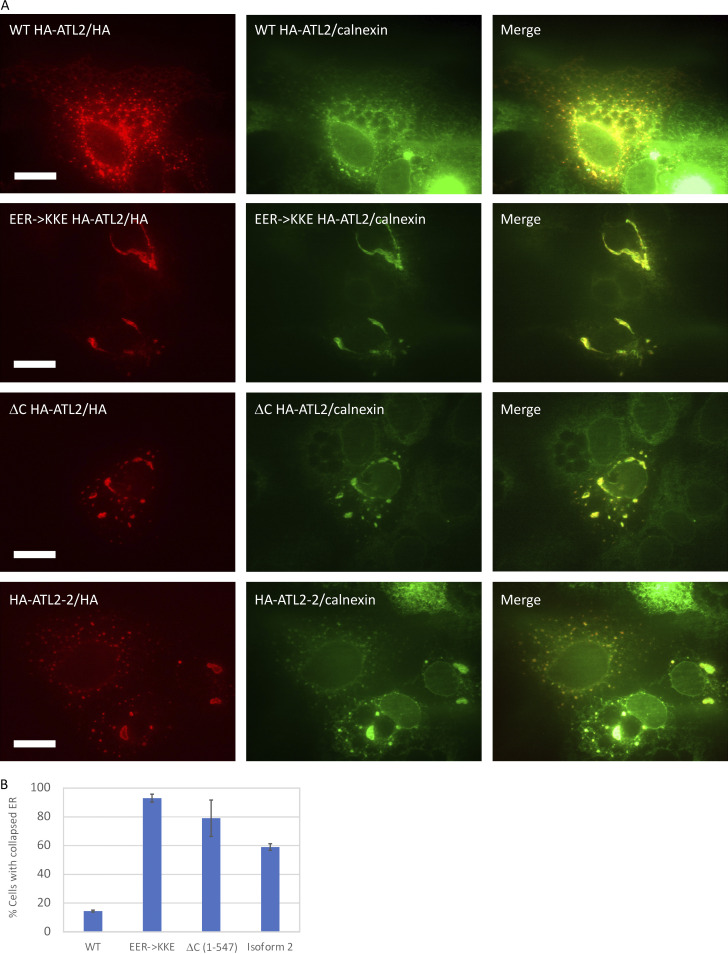
One concern was that fusion inhibition by the C-terminal charged cluster above (Fig. 7, A and B) was caused by nonspecific charge repulsion between the identified residues and the 0.15-mol-fraction negatively charged phosphatidylserine head groups used in our in vitro assay. Charge repulsion, which could prevent the insertion of the nearby amphipathic helix into the membrane, seemed unlikely to be the sole cause of inhibition because charge reversals in both directions (E->K and R->E) dampened autoinhibition (Fig. 7, A and B). Additionally, the C terminus suppressed tethering (Fig. 4 B), and tethering occurs independently of the amphipathic helix (Saini et al., 2014; Liu et al., 2015). Nonetheless, we wondered whether the loss of autoinhibition observed in the charge-reversal variants would be evident in the more physiological context of the ER in cells. As a test, we compared the triple charge-reversal variant E555K, E556K, and R559E to the WT with overexpression in COS-7 cells. WT ATL2 largely colocalized with the ER marker calnexin and had an extended ER distribution with puncta that may be attributable to high-level expression (Fig. 8 A). Remarkably, >80% of cells overexpressing the triple charge-reversal variant (EER->KKE) had a profoundly abnormal distribution of both ATL2 and calnexin, indicative of a loss and collapse of the ER network into a few large structures near the nucleus (Fig. 8 A; quantified in Fig. 8 B). In contrast, >80% of cells overexpressing WT ATL2 had the expected extensive ER network distribution of ATL2 accompanied by puncta. As anticipated, overexpression of ATL2 lacking its entire C-terminal extension (1–547) also led to ER collapse, although the morphology was somewhat distinct from that caused by the triple charge-reversal variant (Fig. 8, A and B). Thus, the C-terminal autoinhibition observed in vitro appears to function in cells and may be important for ER network homeostasis.
Figure 8.
Overexpression of ATL2 C-terminal charge-reversal variants collapses the ER. (A) COS-7 cells overexpressing WT HA-ATL2, EER->KKE (E555K, E556K, R559E) HA-ATL2, DC HA-ATL2(1–547), or HA-ATL2 isoform 2 (see Fig. 9), fixed and costained with antibodies against HA or calnexin. Scale bar, 10 µm. (B) Quantification of cells with collapsed ER, average (± SD), >200 cells per experiment, n = 3.
A neuronally expressed, alternatively spliced ATL2 variant lacks autoinhibition
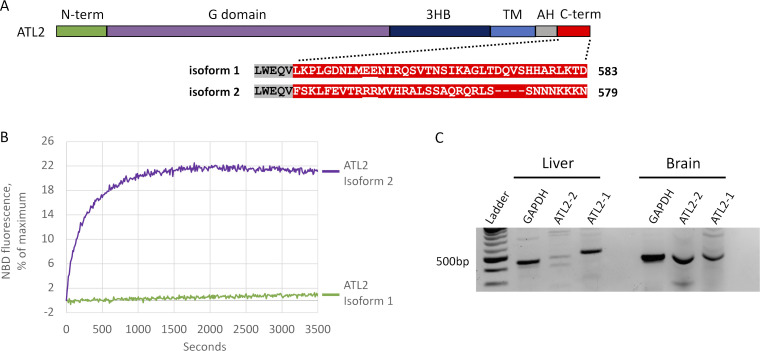
The strong autoinhibition of the canonical ATL2 paralog was unexpected, because most cell types likely depend on it for ER network structure maintenance. Intriguingly, five distinct ATL2 splice variants are documented, and one, ATL2-2, differs from the canonical ATL2-1 solely in the C-terminal extension (Fig. 9 A) and has been reported to be expressed preferentially in neuronal tissues (Tapial et al., 2017). The amino acid sequence of the ATL2-2 C-terminal extension has two noticeable positively charged arginine residues in precisely the same position as E555 and E556 in ATL2-1, whose replacement with positively charged lysine residues greatly reduced autoinhibition (Fig. 7, A and B). This similarity predicted that ATL2-2 might lack strong autoinhibition. Remarkably, this isoform had an observed initial fusion rate of 0.09/s, approaching that of ATL2-1 lacking its entire C terminus (Fig. 9 B). It also caused ER collapse on overexpression in COS-7 cells (Fig. 8, A and B). To confirm its expression in neurons, we performed RT-PCR on whole RNA extract from the liver and brain using isoform-specific primers. While ATL2-1 was easily detected in both the liver and brain as reported (Tapial et al., 2017), ATL2-2 was detected only in the brain (Fig. 9 C). This finding revealed an additional unexpected tissue-specific mode of ATL fusion activity regulation.
Figure 9.
The neuronal ATL2-2 splice variant lacks C-terminal autoinhibition. (A) Alignment of C-terminal extensions of ATL2-1 and ATL2-2. Isoform 2 contains arginine residues (underlined) in the identical location as glutamic acid residues (E555 and E556) of isoform 1 (Fig. 6). AH, amphipathic helix. (B) Lipid mixing performed after reconstitution of each isoform at 1:1,000 protein/lipid ratio. The data are the average of at least two individual traces. (C) RT-PCR from total RNA showing ATL2-1 and ATL2-2 expression in human liver and brain.
Discussion
Our results demonstrate that the human ATLs by themselves are sufficient for lipid mixing in vitro. Thus, other factors are unnecessary to account for ER membrane fusion, per se (Wu et al., 2015; Betancourt-Solis et al., 2018). On the other hand, we also show that the fusion activity of the human ATLs is inactivated, albeit to differing degrees, by a C-terminal autoinhibitory domain. Because even the more tightly repressed canonical ATL2-1 is capable of maintaining normal ER network morphology in cells (Morin-Leisk et al., 2011; Hu et al., 2015), it seems reasonable to assume the existence of a factor that serves to derepress ATL2-1 fusion activity, thereby promoting ER fusion indirectly. Notably, autoinhibitory mechanisms, and mechanisms that provide relief of autoinhibition, are also features of viral and SNARE fusion proteins (Skehel and Wiley, 2000; MacDonald et al., 2010). Autoinhibition could provide a means of suppressing unwanted fusion and tightly controlling the onset of rapid lipid mixing between ER membranes. Regulation could also fine-tune ER network morphology according to cellular demand. Consistent with this, overexpression of disinhibited mutant variants of ATL2-1 or an alternate hyperactive splice isoform, ATL2-2, led to an abnormal ER collapse phenotype in COS-7 cells consistent with overfusion, at least at the light-microscopy level.
While the existence of an activator for ATL2-1 is implied by our results, the nature of the activation mechanism is unknown. Nevertheless, two general types of mechanisms for the relief of autoinhibition, one in cis and the other in trans, could be considered. In cis, a yet-to-be-identified posttranslational modification on ATL2-1 would occur, whereas in trans an ATL-interacting protein would be required. In either case, the activation mechanism would likely be readily reversible, as the ATL2-1 protein purified from HEK cells is largely inactive. Another unknown is whether ATL1 would also use an activator. While the in vitro fusion activity of purified full-length ATL2-1 was negligible, ATL1 had activity comparable to that previously observed for DATL. Thus, ATL1, in principle, may not require an activator. On the other hand, removal of the ATL1 C-terminal extension further potentiated its fusion activity; therefore, an activator could be used to enhance activity. Additionally, if ATL1 were to use an activation mechanism, a shared activator between ATL1 and ATL2-1 is possible, because their C-terminal extensions were somewhat interchangeable. Conversely, distinct activators would enable differential regulation of the ATL1/2 paralogs.
It is intriguing that the more potently inhibited canonical ATL2 (ATL2-1) is the more widely expressed ATL paralog. ATL2-1 is found in most cell and tissue types, whereas ATL1 is predominantly in the nervous system and expressed at low or undetectable levels in most other tissues (Rismanchi et al., 2008). Whether tight regulation of ATL-mediated ER fusion is cell type dependent, and why, is unclear. Notably, the expression of the ATL2-2 splice isoform, which largely lacks C-terminal autoinhibition, is restricted to the brain (Tapial et al., 2017). Finally, our study provides no information on the fusion activity of ATL3, which, like ATL2, is abundantly and broadly expressed across cell and tissue types (Rismanchi et al., 2008).
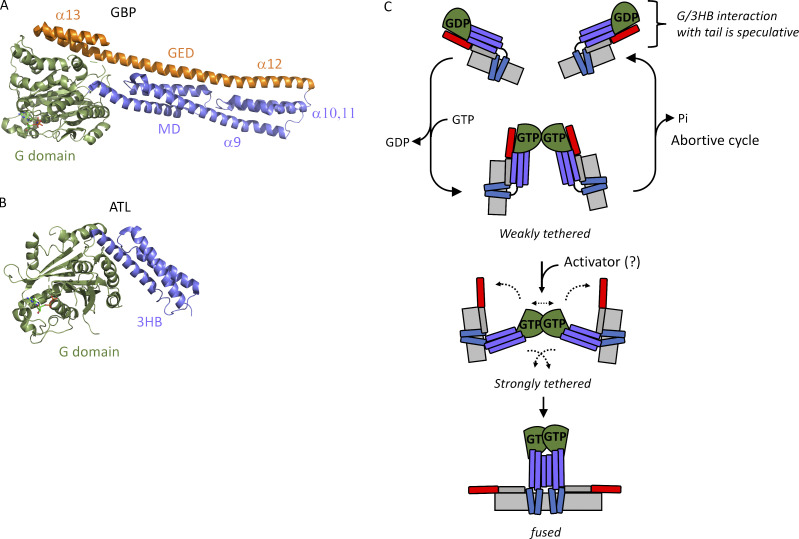
The mechanism by which the C-terminal extensions of ATL1/2 inhibit the fusion activity of the respective proteins remains unclear. A detailed understanding will likely depend on the structure determination of the full-length proteins, possibly in the context of the lipid bilayer. Still, we present here a working model (Fig. 10), admittedly highly speculative in the absence of structural information on full-length ATL. Our speculative model is inspired by another well-studied member of the dynamin GTPase superfamily, guanylate binding protein 1 (GBP1). Notably, GBP1 is the dynamin superfamily member most closely related to ATL (Praefcke and McMahon, 2004). Although the biological function of GBP1 is not yet well understood, and relevant differences between GBP1 and ATL exist (see below), a wealth of structural and biochemical data reveals a similar overall architecture (Prakash et al., 2000) and conservation of key catalytic residues (Ghosh et al., 2006), underscoring a close evolutionary relationship. Remarkably, the catalytic activity of GBP1 has recently been shown to undergo C-terminal autoinhibition (Ince et al., 2021).
Figure 10.
Speculative model for C-terminal autoinhibition of ATL2. (A and B) Crystal structures of GBP1 (Protein Data Bank accession no. 1F5N; A) and ATL1 (Protein Data Bank accession no. 3Q5E; B) rendered in cartoon in PyMOL. (C) Speculative model for C-terminal autoinhibition. GTP binding by ATL promotes weak G-domain dimerization in trans. In absence of a hypothetical activator, tethering is weak, and an abortive cycle results when GTP is hydrolyzed. If a hypothetical activator is present to overcome C-terminal autoinhibition, dimerization and tethering are strong, resulting in crossover formation and productive fusion. Note that the interactions depicted between the tail amphipathic helix (AH) and 3HB, as well as between the C terminus and the G domain, are speculative and have not been experimentally validated.
In brief, GBP1 has an N-terminal G domain followed by a purely α-helical domain, which is also predicted for ATL1/2, although structural information on the TM domain and tail of ATL is lacking (Fig. 10, A and B). For GBP1, the all α-helical domain has been subdivided into a middle domain (MD, α7–11) and an elongated C-terminal domain termed the GTPase effector domain (GED, α12–13; Prakash et al., 2000). Notably, α12-13 (GED) of GBP1 forms α-helices that span the entire length of the GBP1 molecule, making extensive intramolecular contacts to both the G domain and MD (Fig. 10 A). How do these contacts impact activity? Recent studies have shown that extensive contacts between α12–13 (GED) and the G/MD impose conformational constraints on the G domain, holding it in a relatively closed position. Importantly, the charge reversal of two key residues structurally implicated in the GED–G domain interaction (Vöpel et al., 2010) removes those constraints, freeing the G domain and enabling the molecule to shift into a more open conformation (Ince et al., 2017). For GBP, this opening has two major consequences. First, it allosterically stimulates the existing G domain dimerization–triggered catalytic activity of the GTPase; and second, it leads to the formation of new intermolecular α12–13-α12–13 contacts that add to G domain–G domain contacts formed earlier in the GBP1 reaction cycle (Ince et al., 2021).
Intriguingly, amino acid sequence alignment between GBPs and ATLs shows the location of α12–13 (GED) to correspond to the location of the C-terminal extension of ATL, although it should be noted that there is no sequence similarity between GBP and ATL in this region. The lack of sequence conservation toward the C-terminus can be attributed to the fact that GBP1 is a peripheral membrane protein that lacks a TM domain and associates reversibly with Golgi membranes using a farnesyl anchor at its C-terminus (Fres et al., 2010). Thus, although the two proteins share significant sequence homology in the G domain and through the beginning of the GBP1 MD, which aligns well with the ATL 3HB, the homology ends there. Nonetheless, it is tempting to speculate that, by analogy to α12–13 (GED), the C-terminal extension of ATL2-1 (and ATL1 to a lesser degree) might also span the length of ATL (as depicted in the model in Fig. 10 C). In this scenario, an analogous interaction between the C-terminus and G/3HB can be imagined constraining the G domain in a way that somehow prevents full G domain engagement in trans, productive tether formation, and fusion. In the absence of an activator to disrupt these interactions, GTP hydrolysis would ensue, leading to an abortive cycle driven by hydrolysis-triggered dimer disassembly and a return of the subunits to the monomer state (Fig. 10 C, top portion). Finally, the presence of a hypothetical activator to disrupt this interaction, either in cis or in trans, would enable strong tethering and completion of crossover dimerization for fusion (Fig. 10 C, bottom portion).
How might the speculated intramolecular association between the C-terminal extension and G/3HB of ATL2-1 impact the G domain dimer interface? One possibility is that the C-terminus, by its proximity to the membrane inserted amphipathic helix (Liu et al., 2012; Faust et al., 2015; McNew et al., 2013; Hu and Rapoport, 2016), could orient the G domain in a manner that hinders the trans dimer from forming (as suggested in Fig. 10 C, top portion). In another possibility, binding the C terminus to the back side of the G/3HB could allosterically regulate the dimer interface, somewhat akin to the situation in GBP1 (Ince et al., 2021). Indeed, indirect allosteric modulation of G domain functions has emerged as a common principle underlying the control of a wide range of biological functions. For instance, the catalytic activity of the dynamin fission GTPase is rendered assembly dependent by conformational changes that are propagated from the membrane inserted PH domain through the stalk and bundle signaling elements to the G domain active site (Ford and Chappie, 2019). In other examples, G protein–coupled receptor binding to trimeric G proteins at a distance from the active site promotes nucleotide exchange by favoring an internal structural rearrangement of the G domain that weakens its nucleotide affinity (Dror et al., 2015); in addition, membrane association of the N-terminal amphipathic helix of Arf GTPases promotes activation by inducing a structural rearrangement within the G domain core that relieves autoinhibition of GTP binding (Nawrotek et al., 2016). Future work will clarify the ATL regulatory mechanisms uncovered in this study, but the findings herein lay the necessary foundation.
Materials and methods
Reagents and constructs
All ATL1 and ATL2 constructs used for protein expression were tagged with both HA and 6xHis at the N-terminus in the pGW1-CMV vector. The following mutagenic oligonucleotide was used to insert the 6xHis tag into HA-tagged ATL1 and ATL2 constructs in pGW1-CMV: 5′-CGGGATAGGTACCTCCATCATCATCATCATCATGCGAGATCTAGAGTCG-3′. All amino acid–substituted constructs were generated using PCR mutagenesis mediated by PfuTurbo polymerase (Agilent Technologies) and fully sequence confirmed (Genewiz). All mutagenic oligonucleotides were from IDT. The ATL1_ATL2 chimera was produced by amplifying the C terminus of ATL2 with forward primer, 5′-CAAGGTACCTGAAACACTATGGGAACAGGTATTG-3′, and reverse primer, 5′-CGTCAATTGTCAGTCTGTCTTTAATCTGGCATGATGAGACAC-3′, and cloning the fragment into His-ATL1 cut with KpnI and MfeI. The ATL2_ATL1 tail chimera was produced by amplifying the C terminus of ATL1 with forward primer, 5′-TAATTGATCAGGTGGCTGCAGCTCTGTGG-3′, and reverse primer, 5′-GTTCTGATCACAACAATTGTCACATTTTTTTCTTTTCTGATTG-3′, and cloning into His-ATL2 cut with BclI. ATL2 isoform 2 was produced by gBlocks Gene Fragments (IDT) and cloned into ATL2 isoform 1 cut with BclI. All restriction enzymes were from New England Biolabs. GTP was purchased from Sigma-Aldrich; reconstituted to 100-mM stocks in 10 mM Tris, pH 8.0, and 1 mM EDTA; and stored at −80°C. Mant-labeled nucleotides were purchased from Jena Bioscience. Lipids were purchased from Avanti Polar Lipids.
Protein expression and purification
200 ml Expi293 cells were cultured at 37°C and 8% CO2 per manufacturer’s protocol, and transient transfections were done per manufacturer’s instructions (Thermo Fisher Scientific). 2 d after transfection, cells were harvested, washed once with cold PBS, and flash frozen. All purification steps were conducted on ice or at 4°C with chilled buffers. Cell pellets were resuspended in 20 ml lysis 1 (50 mM Tris, pH 8.0, 5 mM MgCl2, 300 mM NaCl, 10 mM imidazole, 10% glycerol, 0.5 mM PMSF, 1 µg/ml pepstatin, 1 µM leupeptin, and 2 mM 2-mercaptoethanol [2-ME]) until homogeneous. 5 ml of lysis 2 (50 mM Tris, pH 8.0, 5 mM MgCl2, 300 mM NaCl, 10 mM imidazole, 10% glycerol, 10% Triton X-100, 0.5 mM PMSF, 1 µg/ml pepstatin, 1 µg/ml leupeptin, and 2 mM 2-ME) was added, mixed, diluted 1:1 with lysis 1 for a final Triton X-100 concentration of 1%, and rotated for 30 min at 4°C. Samples were then centrifuged at 12,000 rpm in a F20-12 × 50 LEX rotor (Thermo Fisher Scientific) for 30 min. The supernatant was further centrifuged at 50,000 rpm in a Ti70 rotor (Beckman Coulter) for 1 h. The final supernatant was filtered through a 0.45-µm filter and mixed with 0.25 ml Ni+2-NTA agarose (Qiagen) overnight at 4°C. The next day, the beads were poured into a column support, washed with 30 ml of wash 1 (50 mM Tris, pH 8.0, 5 mM MgCl2, 100 mM NaCl, 20 mM imidazole, 10% glycerol, 1% Triton X-100, and 2 mM 2-ME) and 30 ml of wash 2 (50 mM Tris, pH 8.0, 5 mM MgCl2, 100 mM NaCl, 20 mM imidazole, 10% glycerol, 0.1% Anapoe X-100, and 2 mM 2-ME). Protein was eluted in 0.25-ml fractions with elution buffer (50 mM Tris, pH 8.0, 5 mM MgCl2, 100 mM NaCl, 250 mM imidazole, 10% glycerol, 0.1% Anapoe X-100, and 2 mM 2-ME). Fractions were flash-frozen and stored at −80°C. Samples of each fraction were resolved by SDS-PAGE and found to be >95% pure.
GTPase assay
GTPase activity was measured under steady-state conditions using the EnzChek Phosphate Assay Kit (Molecular Probes; Thermo Fisher Scientific) using a Spark plate reader (Tecan). A standard reaction involved mixing 1 U/ml purine nucleoside phosphorylase, 0.2 mM 2-amino-6-mercapto-7-methylpurine riboside, 50 mM Tris-HCl, pH 7.5, 100 mM NaCl, 2 mM MgCl2, and 2 mM 2-ME in a total volume of 0.2 ml at 37°C. The reaction was started with the addition of 0.6 µM ATL.
Preparation of liposomes, lipid-mixing fusion assay, and tethering
Lipids in chloroform were dried down by rotary evaporation for 1 h, hydrated by resuspension in A100 buffer (25 mM Hepes, pH 7.4, 100 mM KCl, 10% glycerol, 1 mM EDTA, and 2 mM 2-ME) at a final 10-mM lipid concentration, and subjected to 11 freeze–thaw cycles in a liquid N2 and 42°C water bath. Liposomes (100–300-nm diameter) were formed by extrusion 15 times through 100-nm polycarbonate filters using the LipoFast LF-50 extruder (Avestin) and checked for size by dynamic light scattering (Zen3600; Malvern Panalytical). Purified ATL was incorporated at a 1:1,000 protein/lipid ratio into labeled and unlabeled liposome populations at an effective detergent/lipid ratio of ∼0.7 by incubating protein and lipid at 4°C for 1 h followed by four 1-h detergent-removal incubations with SM-2 Bio-Beads (Bio-Rad) at 1 g beads per 70 mg Anapoe X-100. This was desalted over a 2.4-ml Sephadex G-25 column into A100 buffer, stored at 4°C, and used the same day or flash-frozen and stored at −80°C. Unlabeled liposomes consisted of 1-palmitoyl-2-oleoyl-sn-glycero-3-phosphocholine (PC) and 1,2-dioleoyl-sn-glycero-3-phospho-l-serine (PS) at an 85:15 molar ratio. Labeled liposomes consisted of PC:PS:1,3-dipalmitoyl-sn-glycero-3-phosphoethanolamine-N-(7-nitro-2-1,3-benzoxadiazol-4-yl) (NBD):1,2-dipalmitoyl-sn-glycero-3-phosphoethanolamine-N-(lissamine rhodamine B sulfonyl) at an 82:15:1.5:1.5 molar ratio. For the fusion assay, proteoliposomes (0.6 mM total lipids) were incubated in A100 buffer containing 5 mM MgCl2 at a 1:2 labeled/unlabeled ratio. Following a 5-min incubation at 37°C in a Spark plate reader (Tecan), 2 mM GTP or buffer was added via multichannel pipette, and fluorescence dequenching of NBD was monitored at 10-s intervals at 538 nm after excitation at 460 nm. After 60 min, 0.5% Anapoe X-100 was added for determination of the maximum possible dequenching signal. Data were plotted using the equation [(fluorescence observed − minimum fluorescence observed) / (maximum fluorescence − minimum fluorescence)] × 100. The slow loss of fluorescence due to photobleaching was accounted for by subtracting the −GTP value at each time from the +GTP value. For inner leaflet lipid mixing, the assay was set up as above except that the outer leaflet NBD was first reduced to the nonfluorescent derivative 7-amino-2,1,3-benzoxadiazol with the membrane-impermeable compound sodium dithionite. 2 mM dithionite was added twice until a flat NBD baseline fluorescence was obtained, after which 2 mM GTP was added, and inner leaflet NBD fluorescence dequenching was monitored at 10-s intervals. All lipid mixing was performed at a 1:1,000 protein/lipid ratio unless otherwise specified. All lipid mixing data were the average of two independent traces, typically collected from a single protein preparation. When key constructs were repeated with an independent protein preparation, the traces were similar, with only a 5–10% deviation in initial fusion rates. Tethering was performed under identical conditions as in the lipid-mixing assay except that absorbance at 405 nm was monitored. Absorbance at time 0 was subtracted from all values.
Mant-nucleotide binding assay
GTP-binding kinetics were assessed using mant-labeled nucleotide. 0.33 µM mant-GTP in A100 buffer was incubated for 5 min at 37°C. Emission at 425 nm after excitation at 295 nm was monitored in a Spark plate reader (Tecan) for 40 s for a fluorescence baseline. 0.16 µM ATL was added, and emission was monitored for 60 s with the first reading at 20 s. Data are plotted as F/F0, with the reading at time 0 as F0.
Dynamic light scattering
Proteoliposomes (0.6 mM total lipids) containing ATL at 1:1,000 protein/lipid ratio were incubated in A100 buffer containing 5 mM MgCl2 with no nucleotide or 2 mM GTP at 37°C. After 10 min, 50 µl was diluted to a final volume of 1 ml in A100 in a disposable polystyrene cuvette (Thermo Fisher Scientific). Measurements were acquired on a Malvern ZetaSizer Nano Series instrument (Zen3600). Parameters were set automatically by the instrument software (ZetaSizer v7.12). Where indicated, EDTA was added to samples after 10 min to a final concentration of 20 mM and incubated for an additional 10 min before measurements were acquired.
Cryo-EM grid preparation and cryo-tomographic data collection
Immediately before sample preparation, gold C-flat grids (C-flat CF-1.2/1.3-4Au-50; Protochips) were glow discharged in a Pelco easiGlow for 30 s with a current of 15 mA. Grid vitrification was performed on an EM GP (Leica) at 90% humidity and 4°C. Before sample application to the grid, 2 mM GTP (final concentration) was added to either FL ATL2(1–583) or ATL2(1–547) and allowed to incubate for 30 s. A volume of 3 µl of the sample was then applied to the grid, held for 5 s, blotted for 4 s, and plunged into liquid nitrogen–cooled ethane.
Tilt series were collected on a 200-kV Glacios transmission electron microscope (Thermo Fisher Scientific). Images were recorded using a K3 (Gatan; 18 frames per image) or a Falcon 4 (Thermo Fisher Scientific; 8 frames per image) direct detector operating in the electron counting mode. Tilt series were recorded using SerialEM (Mastronarde, 2005) software at a magnification corresponding to a pixel size of 2.37 Å as individual TIFF files per tilt. A grouped dose symmetric tilt scheme was implemented starting at 0°, followed by ±3–9, ±12–18, ±21–27, ±30–36, and ±39–48 with a tilt increment of 3° at −5 µm underfocus. The total electron dose was kept in the range of 80–90 e−/Å2.
Tomographic reconstruction
Tilt series TIFF files were gain-corrected, aligned, and dose-corrected using the graphical interface of AlignFrames from the IMOD software package (v4.12; Kremer et al., 1996). The corrected tilt images were further processed with Etomo in IMOD. Weighted back-projection with the simultaneous iterative reconstruction technique–like filter were used for the final reconstruction into 3D tomograms. Tomograms were trimmed to remove areas without liposomes when appropriate.
Immunofluorescence
COS-7 cells were cultured on 12-mm glass coverslips in a 24-well plate in DMEM + 10% FBS + 1% penicillin-streptomycin. Transfections of HA-tagged WT or E555K, E556K, or R559E ATL2-1 in pGW1-CMV vector were performed using 1.5 µl Lipofectamine 2000 (Thermo Fisher Scientific) and the indicated amounts of DNA, following manufacturer’s instructions. 2 d after transfection, cells were fixed in 3% paraformaldehyde and costained with HA antibody Ab18181 (Abcam) at 1:500 and calnexin antibody (Abcam) at 1:200 using FBS as blocking agent. Secondary antibodies were Alexa Fluor 568–conjugated goat anti-mouse and FITC-conjugated goat anti-rabbit (Thermo Fisher Scientific). Images were obtained using a spinning-disk confocal scanhead (Yokagawa; PerkinElmer) mounted on an Axiovert 200 microscope (Zeiss) with a 100× 1.4-NA objective (Zeiss) and acquired using a 12-bit ORCA-ER camera (Hamamatsu Photonics). Maximal value projections of two to four sections at 0.2-µm spacing were acquired using Micromanager open-source software (University of California, San Francisco) and merged after adjustment using GIMP open-source software (University of California, Berkeley).
RT-PCR
Human liver and brain total RNA (Takara Bio) were used to make cDNA using qScript cDNA SuperMix (Quanta BioDesign) according to manufacturer’s instructions. GAPDH primers were forward primer (5′-GCAGACCACAGTCCATGCCATCACTGC-3′) and reverse (5′-GAGGTCCACCACCCTGTTGCTGTAGCC-3′). A common 5′ primer (5′-GAACAGGTATGTGGAGGGGACAAGCCTTAC-3′) and specific 3′ primers for each ATL2 isoform (ATL2, isoform 1, 5′-ATGAGACACCTGGTCAGTCAGGCCTGC-3′; ATL2, isoform 2, (5′-AAGAGCACGGTGAACCATTCGACGTCTAGT-3′) were used.
Mass spectrometry
Protein elution buffer was exchanged using 3.5-kD Amicon filter (Millipore) to 8 M urea and 50 mM ammonium bicarbonate buffer. While in the filter, proteins were reduced with 5 mM Tris(2-carboxyethyl)phosphine at 30°C for 60 min and subsequently alkylated with 15 mM iodoacetamide in the dark at RT for 30 min. The buffer was then exchanged again to 1 M urea and 50 mM ammonium bicarbonate, the sample was recovered from the Amicon tube into a new microfuge tube, and the protein concentration was determined using a bicinchoninic acid protein assay (Thermo Fisher Scientific). Proteins were subjected to overnight digestion with mass spectrometry grade Trypsin/Lys-C mix (1:25 enzyme/substrate ratio). Digested peptides were desalted in the Bravo platform using AssayMap C18 cartridges and dried down in a SpeedVac concentrator. Dried peptides were reconstituted with 2% acetonitrile, 0.1% formic acid (FA) and analyzed by LC-MS/MS using a Proxeon EASY-nanoLC system (Thermo Fisher Scientific) coupled to a Q-Exactive Plus mass spectrometer (Thermo Fisher Scientific). Peptides were separated using an analytical C18 Aurora column (75 µm × 250 mm, 1.6-µm particles; IonOpticks) at a flow rate of 300 nl/min (60°C) using a 120-min gradient: 1–5% B in 1 min, 6–23% B in 72 min, 23–34% B in 45 min, and 34–48% B in 2 min (A, FA 0.1%; B, 80% acetonitrile/0.1% FA). The mass spectrometer was operated in positive data-dependent acquisition mode. MS1 spectra were measured in the Orbitrap in m/z 350–1,700 with a resolution of 70,000 at m/z 400. The automatic gain control target was set to 1 × 10⁶, with a maximum injection time of 100 ms. Up to 12 MS2 spectra per duty cycle were triggered, fragmented by higher-energy C-trap dissociation and acquired with a resolution of 17,500, an AGC target of 5 × 10⁴, an isolation window of 1.6 m/z, and a normalized collision energy of 25. The dynamic exclusion was set to 25 s with a 10-ppm mass tolerance around the precursor.
Analysis of mass spectra
All mass spectra were analyzed with MaxQuant software v1.6.11.0. MS/MS spectra were searched against the Homo sapiens Uniprot protein sequence database (downloaded in January 2020) and GPM cRAP sequences (commonly known protein contaminants). Precursor mass tolerance was set to 20 ppm for the first search, where initial mass recalibration was completed, and 4.5 ppm for the main search. Product ions were searched with a mass tolerance 0.5 D. The maximum precursor ion charge state used for searching was 7. Carbamidomethylation of cysteine was searched as a fixed modification, while oxidation of methionine, acetylation of protein N terminus, and phosphorylation of serine, threonine, and tyrosine were searched as variable modifications. The enzyme was set to trypsin in a specific mode, and a maximum of two missed cleavages was allowed for searching. The target/decoy–based false discovery rate filter for spectrum and protein identification was set to 1%.
Single-turnover kinetics
G domain dimerization and crossover formation were assayed using fluorescence resonance energy transfer (FRET) and parallel immersed finite element (PIFE), respectively (Winsor et al., 2018). For G-domain FRET, cyt-ATL2(1–467), cyt-ATL1(1–446), or cyt-DATL(1–415) was labeled with Alexa Fluor 488 (donor) or 647 (acceptor) maleimide on an engineered G-domain cysteine S308C (also C59A, C143A, C395N, and C441A), N281C, or S270C, respectively. For crossover PIFE, cyt-ATL2, cyt-ATL1, or cyt-DATL was labeled with Cy3 maleimide on an engineered 3HB cysteine H462C (also C59A, C143A, C395N, and C441A), H435C, or H410C, respectively. For labeling, each engineered protein was desalted over a 4-ml Sephadex G-25 column in SEC buffer (25 mM Tris, pH 7, 100 mM NaCl, 5 mM MgCl2, 2 mM EGTA, and 1 mM imidazole) supplemented with 500 µM Tris(2-carboxyethyl)phosphine. Dye was added at a 1:1 protein/dye molar ratio and incubated for 2 h (for Cy3) or 30 min (for Alexa Fluor) at RT before being centrifuged at 100,000 rpm in a TLA100 rotor for 10 min at 4°C to remove any precipitate. Labeled protein was then desalted twice to remove free dye. For all single-turnover assays, labeled 30 µM cyt-ATL (at a 1:2 donor/acceptor ratio for FRET) was mixed 1:1 with 15 µM GTP in SEC buffer, or buffer only, at 25°C using a stopped flow accessory mounted on a PTI QuantaMaster-400 fluorimeter (Horiba Instruments). For FRET, both donor (520-nm) and acceptor (670-nm) fluorescence were monitored at 50-ms intervals after 490-nm donor excitation (only acceptor data are shown). For PIFE, 570-nm fluorescence was monitored at 100-ms intervals after 540-nm excitation. Before analysis, fluorescence values obtained in runs in the absence of GTP were subtracted from those obtained in the presence of GTP. Data were then plotted in Excel as normalized F/F0 using the equation (fluorescence − initial fluorescence) / (maximum fluorescence observed − initial fluorescence). For both FRET and PIFE, the data shown are the average of three to five runs.
Online supplemental material
Fig. S1 shows that phosphorylation of S22 and S23 detected by mass spectrometric analysis does not account for the reconstituted ATL1 fusion activity; it also shows the increased fusion activity of DATL purified from HEK cells. Fig. S2 reports the observed initial fusion rates of all ATL variants tested in this study. Fig. S3 shows all the ATL1 and ATL2 variant proteins used in this study by SDS-PAGE. Fig. S4 compares the single-turnover kinetics of the cytoplasmic domains of ATL2, ATL1, and DATL dimerization and crossover. Video 1 shows a tomogram depicting tight zipper tethering by FL ATL2. Video 2 shows a tomogram depicting both tight zipper and diffuse tethering by ATL2(1–547).
Video 1.
FL ATL2 tomogram depicting tight tethering. Reconstruction corresponding to Fig. 6 B, top left.
Video 2.
ATL2(1–547) tomogram depicting both tight and diffuse tethering. Reconstruction corresponding to Fig. 6 B, bottom left.
Supplementary Material
Acknowledgments
The authors thank A. Rosa Campos (Director, Proteomics Core, Sanford Burnham Prebys Medical Discovery Institute, La Jolla, CA) for mass spectrometric analysis and A. Linstedt for helpful suggestions throughout. J.E. Hinshaw, M.R. Mikolaj, and S.B. Nyenhuis also thank Y. Cui and U. Baxa for help with generating the cryoET tilt series.
J.E. Hinshaw, M.R. Mikolaj, and S.B. Nyenhuis were supported by the National Institute of Diabetes and Digestive and Kidney Diseases, National Institutes of Health Intramural Research Program. This work used the Multi-Institute CryoEM Facility, National Institutes of Health, and the Cryo-Electron Microscopy Core, National Institute of Diabetes and Digestive and Kidney Diseases, National Institutes of Health, for CryoET data acquisition. This work was supported by a grant from the National Institute of General Medical Sciences, National Institutes of Health (R01GM107285 to T.H Lee).
The authors declare no competing financial interests.
Author contributions: D. Crosby and T.H Lee conceived and designed the experiments. D. Crosby performed most of the experiments and analyzed the data. M.R. Mikolaj and S.B. Nyenhuis performed the cryo-ET and analysis with guidance from J.E. Hinshaw. S. Bryce performed the serial truncation analysis of ATL1. D. Crosby and T.H Lee wrote the paper. All authors reviewed and edited the manuscript.
Data availability
The datasets generated during and/or analyzed during the current study are available from the corresponding author on reasonable request.
References
- Anwar, K., Klemm R.W., Condon A., Severin K.N., Zhang M., Ghirlando R., Hu J., Rapoport T.A., and Prinz W.A.. 2012. The dynamin-like GTPase Sey1p mediates homotypic ER fusion in S. cerevisiae. J. Cell Biol. 197:209–217. 10.1083/jcb.201111115 [DOI] [PMC free article] [PubMed] [Google Scholar]
- Betancourt-Solis, M.A., Desai T., and McNew J.A.. 2018. The atlastin membrane anchor forms an intramembrane hairpin that does not span the phospholipid bilayer. J. Biol. Chem. 293:18514–18524. 10.1074/jbc.RA118.003812 [DOI] [PMC free article] [PubMed] [Google Scholar]
- Bian, X., Klemm R.W., Liu T.Y., Zhang M., Sun S., Sui X., Liu X., Rapoport T.A., and Hu J.. 2011. Structures of the atlastin GTPase provide insight into homotypic fusion of endoplasmic reticulum membranes. Proc. Natl. Acad. Sci. USA. 108:3976–3981. 10.1073/pnas.1101643108 [DOI] [PMC free article] [PubMed] [Google Scholar]
- Blackstone, C. 2012. Cellular pathways of hereditary spastic paraplegia. Annu. Rev. Neurosci. 35:25–47. 10.1146/annurev-neuro-062111-150400 [DOI] [PMC free article] [PubMed] [Google Scholar]
- Byrnes, L.J., and Sondermann H.. 2011. Structural basis for the nucleotide-dependent dimerization of the large G protein atlastin-1/SPG3A. Proc. Natl. Acad. Sci. USA. 108:2216–2221. 10.1073/pnas.1012792108 [DOI] [PMC free article] [PubMed] [Google Scholar]
- Byrnes, L.J., Singh A., Szeto K., Benvin N.M., O’Donnell J.P., Zipfel W.R., and Sondermann H.. 2013. Structural basis for conformational switching and GTP loading of the large G protein atlastin. EMBO J. 32:369–384. 10.1038/emboj.2012.353 [DOI] [PMC free article] [PubMed] [Google Scholar]
- Chang, J., Lee S., and Blackstone C.. 2013. Protrudin binds atlastins and endoplasmic reticulum-shaping proteins and regulates network formation. PNAS. 110:14954–14959. 10.1073/pnas.1307391110 [DOI] [PMC free article] [PubMed] [Google Scholar]
- Chernomordik, L.V., and Kozlov M.M.. 2008. Mechanics of membrane fusion. Nat. Struct. Mol. Biol. 15:675–683. 10.1038/nsmb.1455 [DOI] [PMC free article] [PubMed] [Google Scholar]
- Cuff, J.A., Clamp M.E., Siddiqui A.S., Finlay M., and Barton G.J.. 1998. JPred: a consensus secondary structure prediction server. Bioinformatics. 14:892–893. 10.1093/bioinformatics/14.10.892 [DOI] [PubMed] [Google Scholar]
- Deluca, G.C., Ebers G.C., and Esiri M.M.. 2004. The extent of axonal loss in the long tracts in hereditary spastic paraplegia. Neuropathol. Appl. Neurobiol. 30:576–584. 10.1111/j.1365-2990.2004.00587.x [DOI] [PubMed] [Google Scholar]
- Dror, R.O., Mildorf T.J., Hilger D., Manglik A., Borhani D.W., Arlow D.H., Philippsen A., Villanueva N., Yang Z., Lerch M.T., et al. 2015. SIGNAL TRANSDUCTION. Structural basis for nucleotide exchange in heterotrimeric G proteins. Science. 348:1361–1365. 10.1126/science.aaa5264 [DOI] [PMC free article] [PubMed] [Google Scholar]
- Evans, K., Keller C., Pavur K., Glasgow K., Conn B., and Lauring B.. 2006. Interaction of two hereditary spastic paraplegia gene products, spastin and atlastin, suggests a common pathway for axonal maintenance. Proc. Natl. Acad. Sci. USA. 103:10666–10671. 10.1073/pnas.0510863103 [DOI] [PMC free article] [PubMed] [Google Scholar]
- Fang, X.T., Sehlin D., Lannfelt L., Syvänen S., and Hultqvist G.. 2017. Efficient and inexpensive transient expression of multispecific multivalent antibodies in Expi293 cells. Biol. Proced. Online. 19:11. 10.1186/s12575-017-0060-7 [DOI] [PMC free article] [PubMed] [Google Scholar]
- Faust, J.E., Desai T., Verma A., Ulengin I., Sun T.L., Moss T.J., Betancourt-Solis M.A., Huang H.W., Lee T., and McNew J.A.. 2015. The Atlastin C-terminal tail is an amphipathic helix that perturbs the bilayer structure during endoplasmic reticulum homotypic fusion. J. Biol. Chem. 290:4772–4783. 10.1074/jbc.M114.601823 [DOI] [PMC free article] [PubMed] [Google Scholar]
- Fink, J.K. 2006. Hereditary spastic paraplegia. Curr. Neurol. Neurosci. Rep. 6:65–76. 10.1007/s11910-996-0011-1 [DOI] [PubMed] [Google Scholar]
- Ford, Marijn G J, and Chappie Joshua S. 2019. The structural biology of the dynamin-related proteins: New insights into a diverse, multitalented family. Traffic. 20(10):717–740. . 10.1111/tra.12676 [DOI] [PMC free article] [PubMed] [Google Scholar]
- Fres, J.M., Müller S., and Praefcke G.J.K.. 2010. Purification of the CaaX-modified, dynamin-related large GTPase hGBP1 by coexpression with farnesyltransferase. J. Lipid Res. 51:2454–2459. 10.1194/jlr.D005397 [DOI] [PMC free article] [PubMed] [Google Scholar]
- Gasper, R., Meyer S., Gotthardt K., Sirajuddin M., and Wittinghofer A.. 2009. It takes two to tango: regulation of G proteins by dimerization. Nat. Rev. Mol. Cell Biol. 10:423–429. 10.1038/nrm2689 [DOI] [PubMed] [Google Scholar]
- Ghosh, A., Praefcke G.J., Renault L., Wittinghofer A., and Herrmann C.. 2006. How guanylate-binding proteins achieve assembly-stimulated processive cleavage of GTP to GMP. Nature. 440:101–104. 10.1038/nature04510 [DOI] [PubMed] [Google Scholar]
- Guelly, C., Zhu P.P., Leonardis L., Papić L., Zidar J., Schabhüttl M., Strohmaier H., Weis J., Strom T.M., Baets J., et al. 2011. Targeted high-throughput sequencing identifies mutations in atlastin-1 as a cause of hereditary sensory neuropathy type I. Am. J. Hum. Genet. 88:99–105. 10.1016/j.ajhg.2010.12.003 [DOI] [PMC free article] [PubMed] [Google Scholar]
- Hu, J., and Rapoport T.A.. 2016. Fusion of the endoplasmic reticulum by membrane-bound GTPases. Semin. Cell Dev. Biol. 60:105–111. 10.1016/j.semcdb.2016.06.001 [DOI] [PubMed] [Google Scholar]
- Hu, J., Shibata Y., Zhu P.P., Voss C., Rismanchi N., Prinz W.A., Rapoport T.A., and Blackstone C.. 2009. A class of dynamin-like GTPases involved in the generation of the tubular ER network. Cell. 138:549–561. 10.1016/j.cell.2009.05.025 [DOI] [PMC free article] [PubMed] [Google Scholar]
- Hu, X., Wu F., Sun S., Yu W., and Hu J.. 2015. Human atlastin GTPases mediate differentiated fusion of endoplasmic reticulum membranes. Protein Cell. 6:307–311. 10.1007/s13238-015-0139-3 [DOI] [PMC free article] [PubMed] [Google Scholar]
- Ince, S., Kutsch M., Shydlovskyi S., and Herrmann C.. 2017. The human guanylate-binding proteins hGBP-1 and hGBP-5 cycle between monomers and dimers only. FEBS J. 284:2284–2301. 10.1111/febs.14126 [DOI] [PubMed] [Google Scholar]
- Ince, S., Zhang P., Kutsch M., Krenczyk O., Shydlovskyi S., and Herrmann C.. 2021. Catalytic activity of human guanylate-binding protein 1 coupled to the release of structural restraints imposed by the C-terminal domain. FEBS J. 288:582–599. 10.1111/febs.15348 [DOI] [PubMed] [Google Scholar]
- Jumper, J., Evans R., Pritzel A., Green T., Figurnov M., Ronneberger O., Tunyasuvunakool K., Bates R., Žídek A., Potapenko A., et al. 2021. Highly accurate protein structure prediction with AlphaFold. Nature. 596:583–589. 10.1038/s41586-021-03819-2 [DOI] [PMC free article] [PubMed] [Google Scholar]
- Kremer, J.R., Mastronarde D.N., and McIntosh J.R.. 1996. Computer visualization of three-dimensional image data using IMOD. J. Struct. Biol. 116:71–76. 10.1006/jsbi.1996.0013 [DOI] [PubMed] [Google Scholar]
- Lee, C., and Chen L.B.. 1988. Dynamic behavior of endoplasmic reticulum in living cells. Cell. 54:37–46. 10.1016/0092-8674(88)90177-8 [DOI] [PubMed] [Google Scholar]
- Liu, T.Y., Bian X., Sun S., Hu X., Klemm R.W., Prinz W.A., Rapoport T.A., and Hu J.. 2012. Lipid interaction of the C terminus and association of the transmembrane segments facilitate atlastin-mediated homotypic endoplasmic reticulum fusion. Proc. Natl. Acad. Sci. USA. 109:E2146–E2154. 10.1073/pnas.1208385109 [DOI] [PMC free article] [PubMed] [Google Scholar]
- Liu, T.Y., Bian X., Romano F.B., Shemesh T., Rapoport T.A., and Hu J.. 2015. Cis and trans interactions between atlastin molecules during membrane fusion. Proc. Natl. Acad. Sci. USA. 112:E1851–E1860. 10.1073/pnas.1504368112 [DOI] [PMC free article] [PubMed] [Google Scholar]
- MacDonald, C., Munson M., and Bryant N.J.. 2010. Autoinhibition of SNARE complex assembly by a conformational switch represents a conserved feature of syntaxins. Biochem. Soc. Trans. 38:209–212. 10.1042/BST0380209 [DOI] [PMC free article] [PubMed] [Google Scholar]
- Mastronarde, D.N. 2005. Automated electron microscope tomography using robust prediction of specimen movements. J. Struct. Biol. 152:36–51. 10.1016/j.jsb.2005.07.007 [DOI] [PubMed] [Google Scholar]
- McNew, J.A., Sondermann H., Lee T., Stern M., and Brandizzi F.. 2013. GTP-dependent membrane fusion. Annu. Rev. Cell Dev. Biol. 29:529–550. 10.1146/annurev-cellbio-101512-122328 [DOI] [PubMed] [Google Scholar]
- Meers, P., Ali S., Erukulla R., and Janoff A.S.. 2000. Novel inner monolayer fusion assays reveal differential monolayer mixing associated with cation-dependent membrane fusion. Biochim. Biophys. Acta. 1467:227–243. 10.1016/S0005-2736(00)00224-8 [DOI] [PubMed] [Google Scholar]
- Moore, K.J., Webb M.R., and Eccleston J.F.. 1993. Mechanism of GTP hydrolysis by p21N-ras catalyzed by GAP: studies with a fluorescent GTP analogue. Biochemistry. 32:7451–7459. 10.1021/bi00080a016 [DOI] [PubMed] [Google Scholar]
- Morin-Leisk, J., Saini S.G., Meng X., Makhov A.M., Zhang P., and Lee T.H.. 2011. An intramolecular salt bridge drives the soluble domain of GTP-bound atlastin into the postfusion conformation. J. Cell Biol. 195:605–615. 10.1083/jcb.201105006 [DOI] [PMC free article] [PubMed] [Google Scholar]
- Namekawa, M., Ribai P., Nelson I., Forlani S., Fellmann F., Goizet C., Depienne C., Stevanin G., Ruberg M., Dürr A., and Brice A.. 2006. SPG3A is the most frequent cause of hereditary spastic paraplegia with onset before age 10 years. Neurology. 66:112–114. 10.1212/01.wnl.0000191390.20564.8e [DOI] [PubMed] [Google Scholar]
- Nawrotek, A., Zeghouf M., and Cherfils J.. 2016. Allosteric regulation of Arf GTPases and their GEFs at the membrane interface. Small GTPases. 7:283–296. 10.1080/21541248.2016.1215778 [DOI] [PMC free article] [PubMed] [Google Scholar]
- Orso, G., Pendin D., Liu S., Tosetto J., Moss T.J., Faust J.E., Micaroni M., Egorova A., Martinuzzi A., McNew J.A., et al. 2009. Homotypic fusion of ER membranes requires the dynamin-like GTPase atlastin. Nature. 460:978–983. 10.1038/nature08280 [DOI] [PubMed] [Google Scholar]
- Park, S.H., Zhu P.P., Parker R.L., and Blackstone C.. 2010. Hereditary spastic paraplegia proteins REEP1, spastin, and atlastin-1 coordinate microtubule interactions with the tubular ER network. J. Clin. Invest. 120:1097–1110. 10.1172/JCI40979 [DOI] [PMC free article] [PubMed] [Google Scholar]
- Praefcke, G.J., and McMahon H.T.. 2004. The dynamin superfamily: universal membrane tubulation and fission molecules? Nat. Rev. Mol. Cell Biol. 5:133–147. 10.1038/nrm1313 [DOI] [PubMed] [Google Scholar]
- Prakash, B., Praefcke G.J., Renault L., Wittinghofer A., and Herrmann C.. 2000. Structure of human guanylate-binding protein 1 representing a unique class of GTP-binding proteins. Nature. 403:567–571. 10.1038/35000617 [DOI] [PubMed] [Google Scholar]
- Rismanchi, N., Soderblom C., Stadler J., Zhu P.P., and Blackstone C.. 2008. Atlastin GTPases are required for Golgi apparatus and ER morphogenesis. Hum. Mol. Genet. 17:1591–1604. 10.1093/hmg/ddn046 [DOI] [PMC free article] [PubMed] [Google Scholar]
- Saini, S.G., Liu C., Zhang P., and Lee T.H.. 2014. Membrane tethering by the atlastin GTPase depends on GTP hydrolysis but not on forming the cross-over configuration. Mol. Biol. Cell. 25:3942–3953. 10.1091/mbc.E14-08-1284 [DOI] [PMC free article] [PubMed] [Google Scholar]
- Skehel, J.J., and Wiley D.C.. 2000. Receptor binding and membrane fusion in virus entry: the influenza hemagglutinin. Annu. Rev. Biochem. 69:531–569. 10.1146/annurev.biochem.69.1.531 [DOI] [PubMed] [Google Scholar]
- Tapial, J., Ha K.C.H., Sterne-Weiler T., Gohr A., Braunschweig U., Hermoso-Pulido A., Quesnel-Vallières M., Permanyer J., Sodaei R., Marquez Y., et al. 2017. An atlas of alternative splicing profiles and functional associations reveals new regulatory programs and genes that simultaneously express multiple major isoforms. Genome Res. 27:1759–1768. 10.1101/gr.220962.117 [DOI] [PMC free article] [PubMed] [Google Scholar]
- Ueda, H., Yokota E., Kuwata K., Kutsuna N., Mano S., Shimada T., Tamura K., Stefano G., Fukao Y., Brandizzi F., et al. 2016. Phosphorylation of the C Terminus of RHD3 Has a Critical Role in Homotypic ER Membrane Fusion in Arabidopsis. Plant Physiol. 170:867–880. 10.1104/pp.15.01172 [DOI] [PMC free article] [PubMed] [Google Scholar]
- Ulengin, I., Park J.J., and Lee T.H.. 2015. ER network formation and membrane fusion by atlastin1/SPG3A disease variants. Mol. Biol. Cell. 26:1616–1628. 10.1091/mbc.E14-10-1447 [DOI] [PMC free article] [PubMed] [Google Scholar]
- Vöpel, T., Syguda A., Britzen-Laurent N., Kunzelmann S., Lüdemann M.B., Dovengerds C., Stürzl M., and Herrmann C.. 2010. Mechanism of GTPase-activity-induced self-assembly of human guanylate binding protein 1. J. Mol. Biol. 400:63–70. 10.1016/j.jmb.2010.04.053 [DOI] [PubMed] [Google Scholar]
- Winsor, J., Hackney D.D., and Lee T.H.. 2017. The crossover conformational shift of the GTPase atlastin provides the energy driving ER fusion. J. Cell Biol. 216:1321–1335. 10.1083/jcb.201609071 [DOI] [PMC free article] [PubMed] [Google Scholar]
- Winsor, J., Machi U., Han Q., Hackney D.D., and Lee T.H.. 2018. GTP hydrolysis promotes disassembly of the atlastin crossover dimer during ER fusion. J. Cell Biol. 217:4184–4198. 10.1083/jcb.201805039 [DOI] [PMC free article] [PubMed] [Google Scholar]
- Wisesa, S., Yamamoto Y., and Sakisaka T.. 2019. TMCC3 localizes at the three-way junctions for the proper tubular network of the endoplasmic reticulum. Biochem. J. 476:3241–3260. 10.1042/BCJ20190359 [DOI] [PubMed] [Google Scholar]
- Wu, F., Hu X., Bian X., Liu X., and Hu J.. 2015. Comparison of human and Drosophila atlastin GTPases. Protein Cell. 6:139–146. 10.1007/s13238-014-0118-0 [DOI] [PMC free article] [PubMed] [Google Scholar]
- Yamamoto, Y., Yoshida A., Miyazaki N., Iwasaki K., and Sakisaka T.. 2014. Arl6IP1 has the ability to shape the mammalian ER membrane in a reticulon-like fashion. Biochem. J. 458:69–79. 10.1042/BJ20131186 [DOI] [PubMed] [Google Scholar]
- Zhang, M., Wu F., Shi J., Zhu Y., Zhu Z., Gong Q., and Hu J.. 2013. ROOT HAIR DEFECTIVE3 family of dynamin-like GTPases mediates homotypic endoplasmic reticulum fusion and is essential for Arabidopsis development. Plant Physiol. 163:713–720. 10.1104/pp.113.224501 [DOI] [PMC free article] [PubMed] [Google Scholar]
- Zhao, X., Alvarado D., Rainier S., Lemons R., Hedera P., Weber C.H., Tukel T., Apak M., Heiman-Patterson T., Ming L., et al. 2001. Mutations in a newly identified GTPase gene cause autosomal dominant hereditary spastic paraplegia. Nat. Genet. 29:326–331. 10.1038/ng758 [DOI] [PubMed] [Google Scholar]
Associated Data
This section collects any data citations, data availability statements, or supplementary materials included in this article.
Supplementary Materials
Data Availability Statement
The datasets generated during and/or analyzed during the current study are available from the corresponding author on reasonable request.


