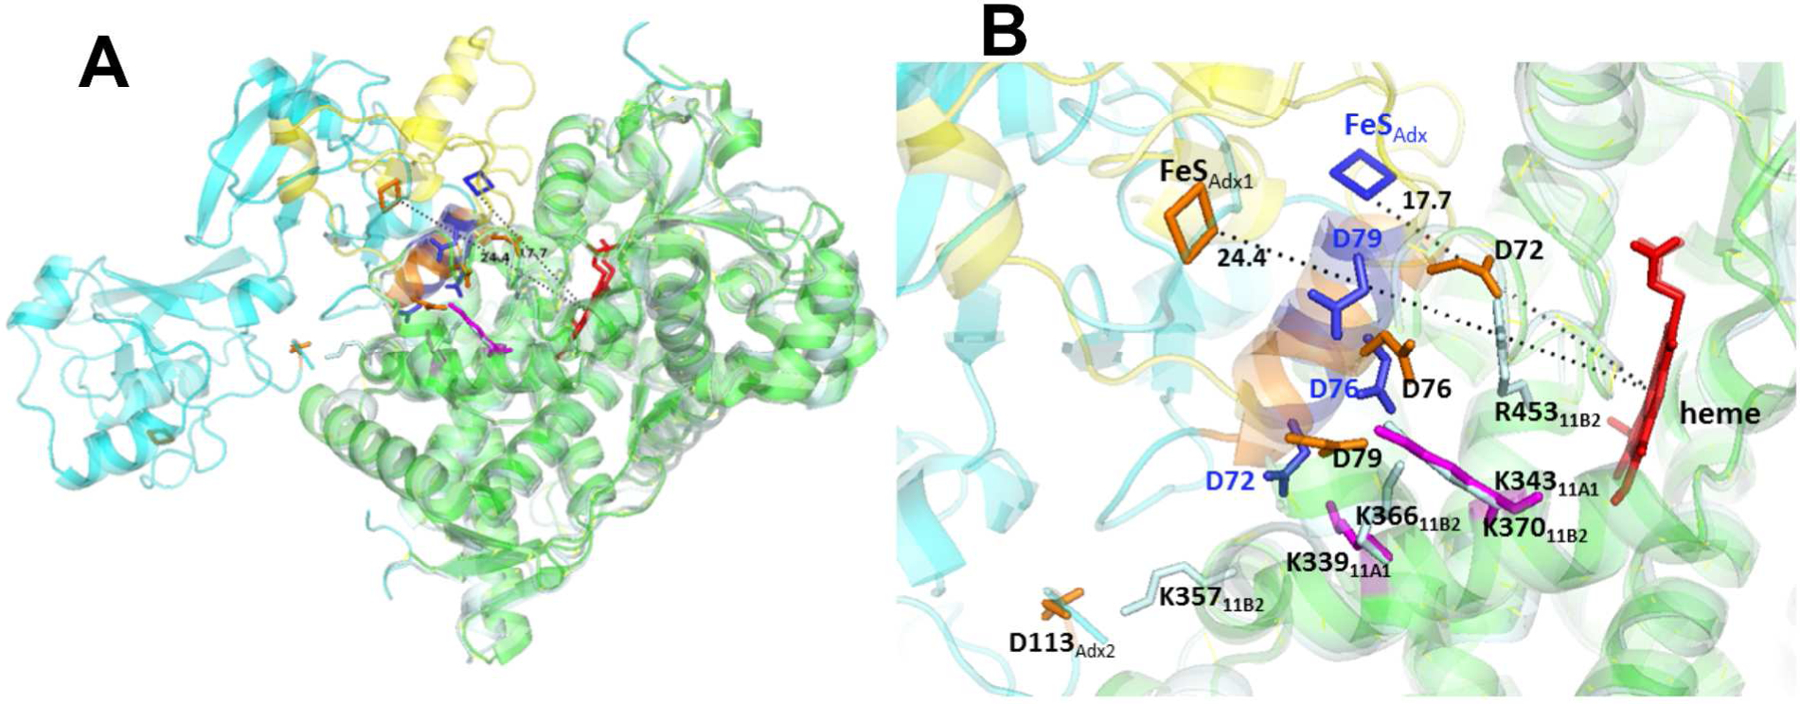
Figure 6.

Comparison of P450 11B2-R366K•Adx2 model and P450 11A1-Adx (3N9Y) fusion protein structure. The superposition of heme moieties was performed using the PyMOL molecular graphics program. (A) Superposition of the P450 11B2-R366K•Adx2 model (pale cyan-cyan) onto the 2.1 Å P450 11A1-Adx structure (green-yellow). (B) Close-up comparison of the P450-Adx interfaces. The heme is shown in red, and important residues are labeled and shown as sticks on P450 11B2 in pale cyan, P450 11A1 in magenta, Adx2 dimer in orange, and fused Adx (3N9Y) in blue. Distances between metal centers are indicated.
