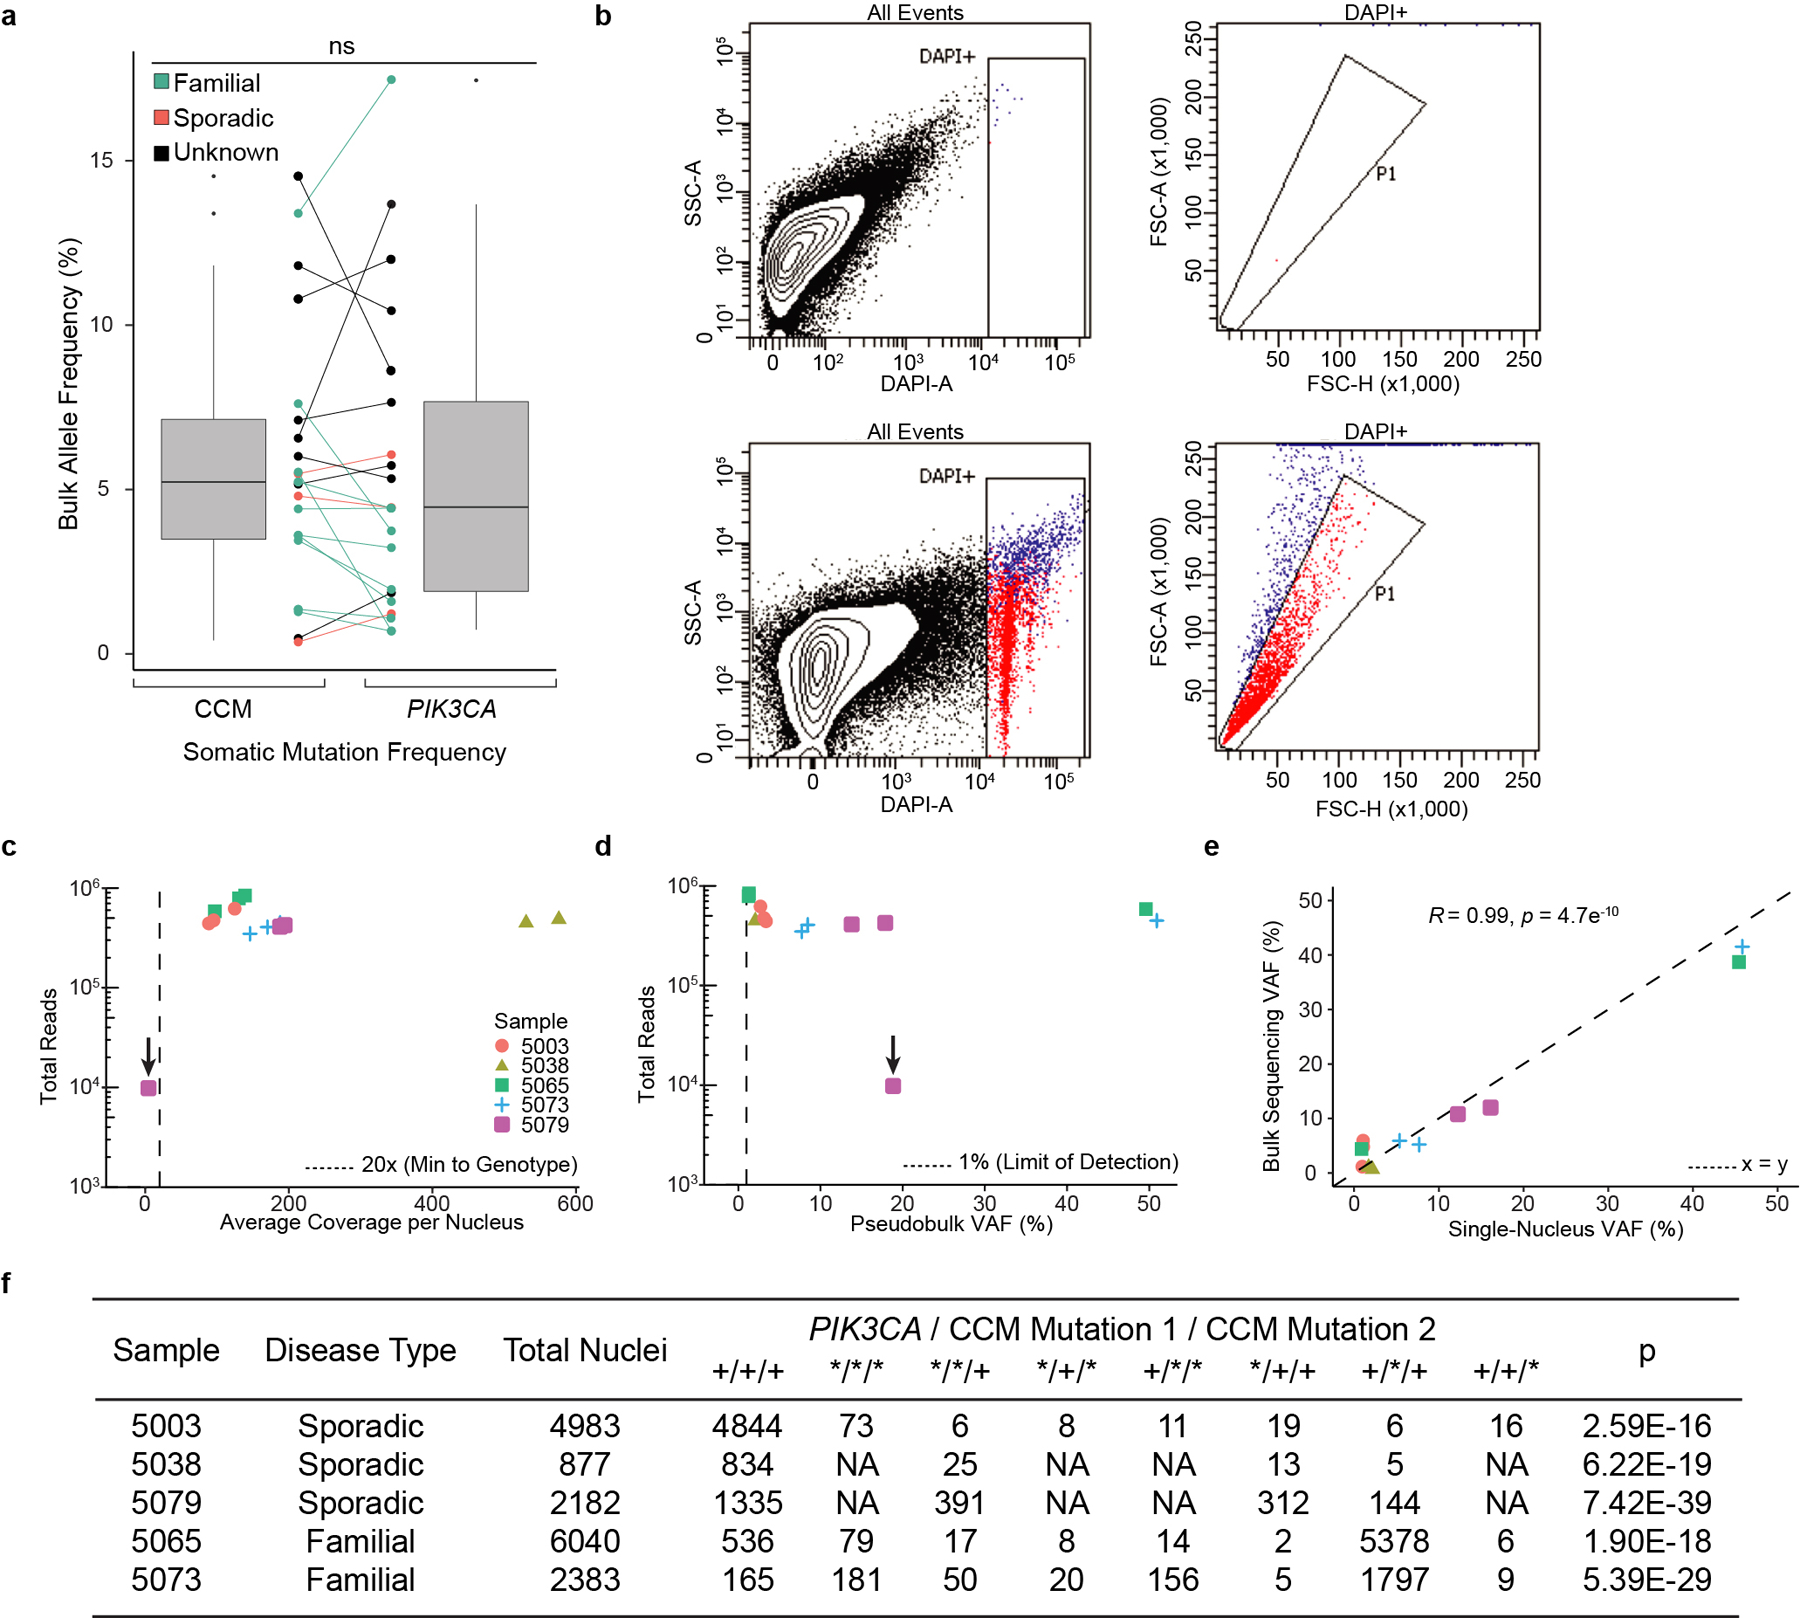
Extended Data Figure 7. Characterization of single-nucleus DNA sequencing of human CCM samples.

a, The relationship between somatic PIK3CA and CCM mutations detected in bulk sequencing is graphed. Points indicate individual mutations in either a CCM gene or PIK3CA. Lines connect the CCM gene and PIK3CA gene mutations present in a single sample. Box plots show the aggregate frequencies of PIK3CA and CCM mutations. Center lines show the medians; box limits indicate the 25th and 75th percentiles; whiskers extend 1.5 times the interquartile range from the 25th to 75th percentiles, outliers are represented by dots. n = 21 sample points for both plots. b, Representative FANS plots of unstained (top row) and DAPI stained (bottom row) CCM homogenate. Doublet discrimination by forward scatter profile for DAPI stained sample. Plots consist of 100,000 events. The unstained sample contains 1 event (0%) in the DAPI+ singlet gate. The DAPI stained samples contains 2,414 events (2.4%) in the DAPI+ singlet gate. c, Total reads and average coverage per nucleus from snDNAseq for each mutation detected by bulk sequencing. Dotted line shows 20x coverage, the minimum cutoff used for establishing genotype. d, Pseudobulk allele frequency from snDNA-seq for each mutation detected by bulk sequencing. Dotted line shows 1% allele frequency. Note the data point with the arrow in c-d shows a mutation in sample 5079 detected in bulk sequencing which, due to poor amplification during snDNA-seq, received insufficient coverage per nucleus (4.5x) to establish nuclear genotypes however is clearly present in pseudobulk reads (1849/9814). e, Comparison of mutation allele frequency as detected by bulk and snDNA-seq. As nuclei are diploid for the relevant autosomes, the x-axis is equal to the fraction of mutant nuclei divided by two. Dotted line shows perfect correlation at x=y. R and p were calculated by Pearson’s correlation coefficient. f, A summary of snDNA-seq results for 3 sporadic and 2 familial CCMs analyzed is shown. The number of nuclei with each possible genotype are listed. + indicates a wild-type allele; * indicates a mutant allele. Note that only 1 somatic CCM mutation was identified in samples 5038 and 5079. P values were determined by two-tailed chi-squared test between the observed and expected triple mutant nuclei (or double mutant for lesions 5038 and 5079) determined by Poisson distribution (see Methods).
