

Abstract
Background
Gastrointestinal (GI) cancers were responsible for 26.3% of cancer cases and 35.4% of deaths worldwide in 2018. This study aimed to analyze the global incidence, mortality, prevalence, and contributing risk factors of the 6 major GI cancer entities [esophageal cancer (EC), gastric cancer (GC), liver cancer (LC), pancreatic cancer (PC), colon cancer, and rectal cancer].
Methods
Using the Global Cancer Observatory and the Global Health Observatory databases, we reviewed the current GI cancer incidence, prevalence, and mortality, analyzed the association of GI cancer prevalence with national human development indices (HDIs), identified the contributing risk factors, and estimated developing age‐ and sex‐specific trends in incidence and mortality.
Results
In 2020, the trend in age‐standardized rate of incidence of GI cancers closely mirrored that of mortality, with the highest rates of LC, EC, and GC in Asia and of colorectal cancer (CRC) and PC mainly in Europe. Incidence and mortality were positively, but the mortality‐to‐incidence ratio (MIR) was inversely correlated with the national HDI levels. High MIRs in developing countries likely reflected the lack of preventive strategies and effective treatments. GI cancer prevalence was highest in Europe and was also positively correlated with HDIs and lifestyle‐associated risk factors, such as alcohol consumption, smoking, obesity, insufficient physical activity, and high blood cholesterol level, but negatively correlated with hypertension and diabetes. Incidences of EC were consistently and those of GC mostly decreasing, whereas incidences of CRC were increasing in most countries/regions, especially in the younger populations. Incidences of LC and PC were also increasing in all age‐gender populations except for younger males. Mortalities were decreasing for EC, GC, and CRC in most countries/regions, and age‐specific trends were observed in PC and LC with a decrease in the younger but an increase in the older population.
Conclusions
On the global scale, higher GI cancer burden was accompanied, for the most part, by factors associated with the so‐called Western lifestyle reflected by high and very high national HDI levels. In countries/regions with very high HDI levels, patients survived longer, and increasing GI cancer cases were observed with increasing national HDI levels. Optimizing GI cancer prevention and improving therapies, especially for patients with comorbid metabolic diseases, are thus urgently recommended.
Keywords: annual percentage change (APC), diabetes, gastrointestinal (GI) cancer, high blood cholesterol, human development indices (HDI), hypertension, incidence, lifestyle, mortality, prevalence
Prevalence of gastrointestinal cancers was positively correlated with national human development index levels, but negatively with hypertension and diabetes rates. Age‐specific trends were observed in stomach cancer and esophagus cancer for incidence and in liver cancer and pancreatic cancer for mortality, as well as sex‐specific trends for stomach cancer and pancreatic cancer in the elder.These findings suggest that future research has to focus on the specific etiology of gastrointestinal cancers behind these epidemiologic transitions and improve therapeutic strategies for patients with comorbid metabolic diseases.
Abbreviations
- APC
annual percent changes
- ASR
age‐standardized rate
- CC
colon cancer
- CI5
Cancer Incidence in Five continents
- CRC
colorectal cancer
- EC
esophageal cancer
- GC
gastric cancer
- GCO
Global Cancer Observatory
- GHO
Global Health Observatory
- GI
gastrointestinal
- HDI
human development indices
- LC
liver cancer
- MIR
mortality‐to‐incidence ratio
- PC
pancreatic cancer
- RC
rectal cancer
1. BACKGROUND
Cancers located in the main gastrointestinal (GI) tract include esophageal cancer (EC), gastric cancer (GC), colon cancer (CC), rectal cancer (RC), liver cancer (LC), and pancreatic cancer (PC). The entirety of these tumors in 2018 made up 26.3% of cancer cases and accounted for 35.4% of cancer deaths worldwide [1]. The most frequent GI cancer is colorectal cancer (CRC), which accounted for 38.8% of GI cancer cases and 26.0% of GI cancer‐related deaths, followed by GC (21.7% of cases and 23.2% of deaths), LC (17.9% / 23.2%), EC (12.2% / 15.0%), and PC (9.5% / 12.7%) [1, 2].
Distribution of these 6 GI cancer types differed largely depending on world region and human development indices (HDIs). EC, GC, and LC were more common in Asia; CRC and PC more frequently occurred in Europe and Northern America, while a larger proportion of PC cases occurred in countries with very high HDI [1, 3, 4]. Differences were attributable to genetic and environmental factors, especially dietary habits and lifestyle, as well as multi‐causal combinations like obesity combined with smoking and alcohol consumption [3, 5, 6]. These risk factors seemed to be shared by all GI cancers [7, 8, 9]. While the risks of GI cancers increase with exposure time, the individual contribution to a given cancer hazard varies among different GI organs [9, 10].
In addition, age and gender have a significant influence on both the incidence and mortality of GI tract cancers [11, 12]. Generally, male gender and older age are associated with higher incidence and mortality compared to female gender and younger age [13]. Besides, Siegel et al. [14] recently reported a rapid and significant increase of CRC incidence and mortality in younger persons in 19 of the 36 included countries but a significant decline in only 3 of the 36 countries. This surprising finding highlights the necessity to globally analyze and compare the current epidemiologic profiles, GI cancer‐relevant risk factors, and temporal trends of GI cancers. Population‐based, multi‐national data are crucial for optimizing preventive strategies and diminishing the growing gap between countries with different HDI levels.
On the basis of a recent report [1] and with the support of global databases [Global Cancer Observatory (GCO) and Global Health Observatory (GHO)], we analyzed the incidence, mortality, and mortality‐to‐incidence ratio (MIR), stratified by HDI level to overview the global burden of GI cancers. Further, we analyzed the associations of HDI, lifestyle‐related risk factors, and metabolic factors with 5‐year prevalence on a country level to determine risk factors for these 6 GI cancers. Finally, we calculated age‐ and gender‐specific annual percent changes (APCs) in incidence and mortality to estimate their recent trends.
2. POPULATION AND METHODS
2.1. Source of data
The incidence and mortality in 2020 as well as 5‐year prevalence of 6 GI cancer entities were calculated respectively using the datum visualization tools in the “Cancer Today” section of the World Health Organization (WHO) GCO database (https://gco.iarc.fr/today) [2]. The data of trends in incidence during the recent 15 years were extracted from the Cancer Incidence in the Five Continents (CI5) series (https://ci5.iarc.fr/CI5plus/Pages/online.aspx) [15] (Supplementary Table S1). The data of trends in mortality of GI cancers for various countries/regions from 1998 to the recent update were obtained from the WHO database in the “Cancer Over Time” section (https://www‐dep.iarc.fr/WHOdb/WHOdb.htm) [16] (Supplementary Table S1).
For further assessment of the national risk factors associated with the prevalences of the 6 main GI cancers, we extracted the most recent age‐adjusted prevalence data for risk factors, such as obesity in 2016, alcohol drinking in 2015, insufficient physical activity in 2015, raised blood pressure (hypertension) in 2015, high blood glucose (diabetes) in 2014, high total cholesterol in 2008, and smoking in 2018, from the WHO GHO database (https://www.who.int/data/gho/data/indicators) [17].
2.2. Study population
The sites of 6 major GI cancers were identified using the International Classification of Disease (ICD, 10th revision) codes: esophagus (C15), stomach (C16), colon (C18), rectum and anus (C19‐21), liver and intrahepatic bile ducts (C22), and pancreas (C25). We included the data of 185 countries/regions for incidence, mortality, and 5‐year prevalence analyses. According to the validity of data from GCO and GHO, we included the data of 172 countries/regions and analyzed the associations of HDI and risk factors with GI cancers. Moreover, the data of 34 countries/regions were included for analyzing the trends in incidence, but only 30 countries/regions for the trends in mortality since the data of annual percent changes (APCs) in mortality of GI cancers were not available for Belarus, India, the Netherlands, and Turkey.
2.3. Outcomes and variables
Incidence, mortality, and 5‐year prevalence of GI cancers were analyzed at a country level. The trends of incidence and mortality of GI cancers were stratified according to age and gender (age < 50 years, male; age < 50 years, female; age ≥ 50 years, male; age ≥ 50 years, female) [3, 12, 14].
The HDI data in GCO were divided into four categories: HDI ≥ 0.80, very high; 0.8 > HDI ≥ 0.7, high; 0.7 > HDI ≥ 0.55, medium; and HDI < 0.55, low. The cutoffs were selected based on the Human Development Report 2020 recommendations released at http://hdr.undp.org/en/content/download‐data.
Related risk factors were assessed using the following variables: obesity [body mass index (BMI) ≥ 30 kg/m2]; alcohol drinking (volume of pure alcohol per person per year); insufficient physical exercise (≤ 150 min/week of moderate intensity; ≤ 75 min/week of vigorous‐intensity exercise); hypertension (systolic blood pressure ≥ 140 mmHg or diastolic blood pressure ≥ 90 mmHg); diabetes (fasting glucose ≥ 7.0 mmol/L, diabetes history, or use of insulin or oral hypoglycemic drugs); raised total cholesterol (total cholesterol ≥ 5.0 mmol/L); and smoking (any form of tobacco smoking on a daily or occasional basis).
2.4. Statistical analyses
Incidence and mortality are presented as age‐standardized rates (ASRs, per 100,000 persons) [18, 19, 20]. The 5‐year prevalence represents the proportion of persons who had a cancer diagnosis within the past 5 years and is given as a proportion of the population per 100,000 persons. The magnitude of trend changes for incidence and mortality are presented as APCs of ASRs. APCs were calculated by fitting a simple regression model to the log of the ASR [15]. The correlations between HDI in 2020 and risk factors, and the 5‐year prevalence of GI cancers were evaluated using the Spearman's correlation analyses and are presented by the correlation coefficient (r). To define the risk factors, we divided the entity of all countries/regions into two groups (high‐ vs. low‐prevalence countries) according to the median value of 5‐year prevalence for each of the 6 GI cancers; then, we analyzed the associations of individual risk factors with the prevalence of GI cancers on a country level using the logistic regression analyses and presented data as odds ratios (ORs) and 95% confidence intervals (CIs). Further, to predict the risk of GI cancers, the prediction probabilities of investigated variables were calculated by using logistic regression models and analyzed using the receiver operating characteristic (ROC) curve, and the data are presented as the area under the curves (AUCs) and 95% CIs.
Statistical analyses were performed using the SPSS Statistics software, version 20.0 (IBM, NY, USA), and statistical differences were considered significant at P ≤ 0.05.
3. RESULTS
3.1. HDI and GI cancers in 2020
In 2020, the mean global incidence of GI cancers was 50.8/100,000. It ranged from 145.7/100,000 in Mongolia to 12.1/100,000 in Eswatini (Figure 1A). The mortality pattern of GI cancer closely mirrored the incidence. The mean global mortality was 35.3/100,000. Mongolia had the highest mortality of 129.8/100,000 (Figure 1B). In addition, the highest incidence and mortality of LC, EC, and GC were consistently seen in Asia; those of CRC and PC mainly in Europe (Figure 1C).
FIGURE 1.
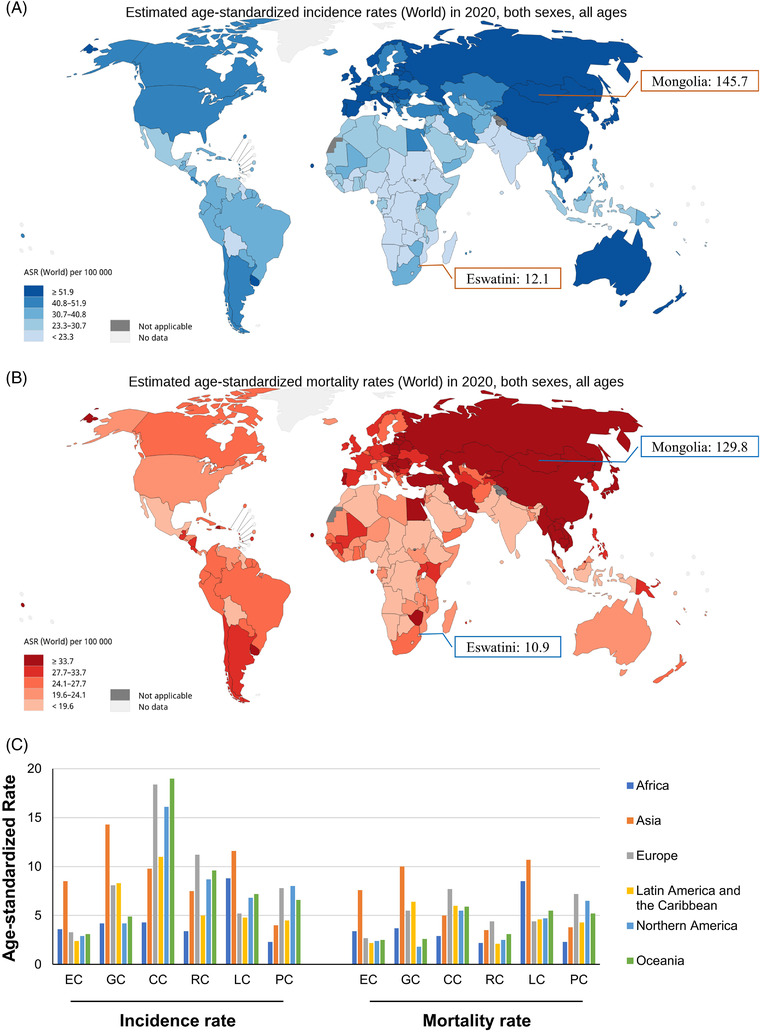
Epidemiologic profiles of GI cancers in 2020. (A) The global age‐standardized rates of incidence of GI cancers (data source from GLOBOCAN 2020: https://gco.iarc.fr/today); (B) The global age‐standardized rates of mortality of GI cancers (data source from GLOBOCAN 2020: https://gco.iarc.fr/today); (C) The global age‐standardized rates of incidence and mortality of 6 GI cancers stratified by world area. Abbreviations: GI, gastrointestinal; EC, esophageal cancer; GC, gastric cancer; LC, liver cancer; PC, pancreatic cancer; CC, colon cancer; RC, rectal cancer
Stratified by HDI, the incidence and mortality of CC, RC, and PC were consistently higher in countries/regions with high and very high HDI than in those with medium and low HDI (Figure 2A and 2B). However, the MIR was consistently lowest in countries/regions with very high HDI, and gradually rose with decreasing HDI levels (Figure 2C). Considering the advanced medical levels in countries/regions with high HDI, one can presume higher numbers of GI cancer survivors. Thus, we further analyzed the association between the 5‐year prevalence of the 6 GI cancers and national HDI levels. The highest 5‐year prevalence of GI cancer was found in Europe (261.8/100,000), followed by North America (189.8/100,000) and Oceania (182.0/100,000) (Figure 3A). As predicted, the prevalence of the entirety of 6 GI cancers was positively correlated with national HDI levels (all P < 0.001); with the strongest correlation seen in CC (r = 0.915, P < 0.001) followed by RC (r = 0.884, P < 0.001) (Figure 3B).
FIGURE 2.
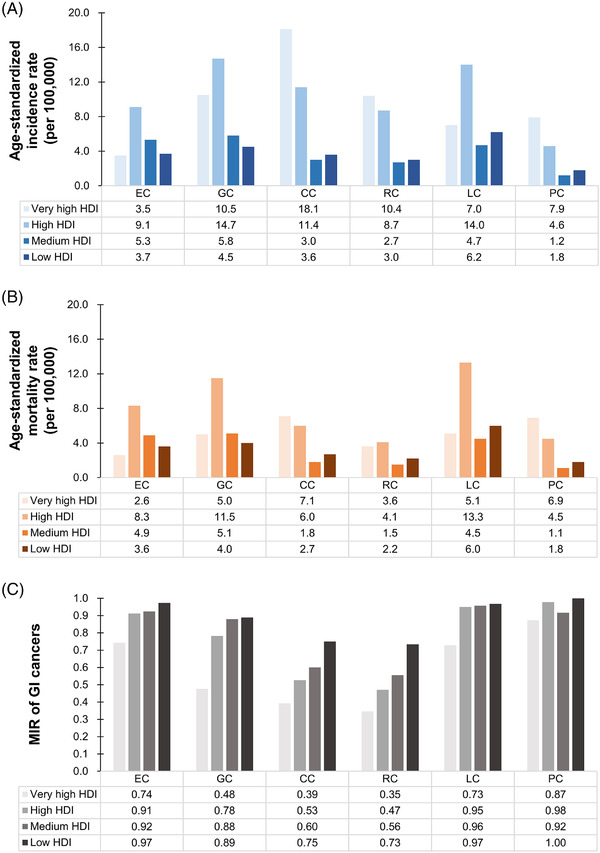
Epidemiologic profiles of 6 GI cancers stratified by national HDI levels. (A) Age‐standardized rates of incidence of 6 GI cancers stratified by HDI; (B) Age‐standardized rates of mortality of 6 GI cancers stratified by HDI; (C) MIR of 6 GI cancers stratified by HDI. Abbreviations: GI, gastrointestinal; HDI, human development indices; MIR, mortality‐to‐incidence ratio; EC, esophageal cancer; GC, gastric cancer; LC, liver cancer; PC, pancreatic cancer; CC, colon cancer; RC, rectal cancer
FIGURE 3.
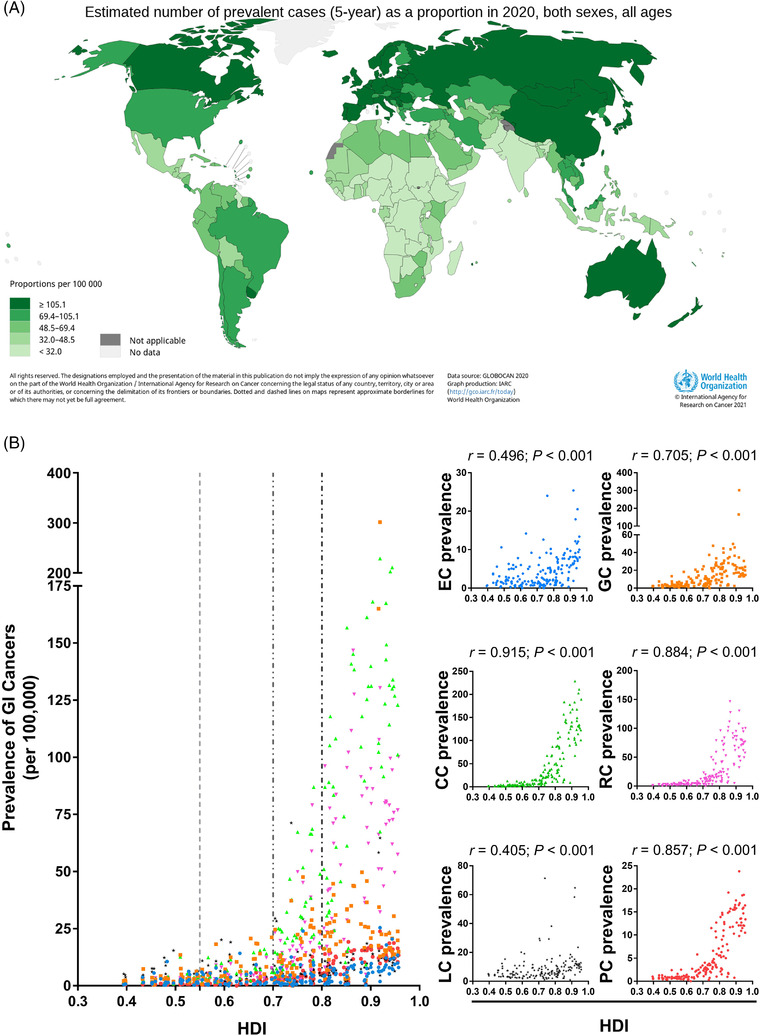
Prevalences of 6 GI cancers in 2020 and their correlations with national HDI levels. (A) Global 5‐year prevalence of 6 GI cancers (data source from GLOBOCAN 2020: https://gco.iarc.fr/today); (B) Correlation analyses between GI cancers’ prevalence and national HDI. Abbreviations: GI, gastrointestinal; HDI, human development indices; EC, esophageal cancer; GC, gastric cancer; LC, liver cancer; PC, pancreatic cancer; CC, colon cancer; RC, rectal cancer
3.2. Risk factors and GI cancers
Next, we analyzed the correlation of classical risk factors with national GI cancer prevalence. EC prevalence was positively correlated with alcohol consumption (r = 0.483, P < 0.001), high cholesterol (r = 0.433, P < 0.001), and smoking (r = 0.310, P < 0.001). Contrary to that and surprisingly, diabetes had a significant inverse correlation with EC prevalence (r = ‐0.389, P < 0.001) (Figure 4A). Afterwards, all countries/regions were divided into two groups (high‐ vs. low‐prevalence countries) based on the median value of EC prevalence (2.60/100,000) to define the contributing factors to high prevalence. High cholesterol (OR = 1.129, P = 0.001) and diabetes (OR = 0.749, P = 0.035) remained significant in multivariate analysis, even with a significant predictive ability for high EC prevalence (AUC = 0.890, P < 0.001) (Figure 5A).
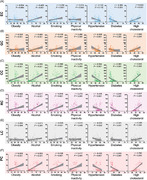
FIGURE 4.
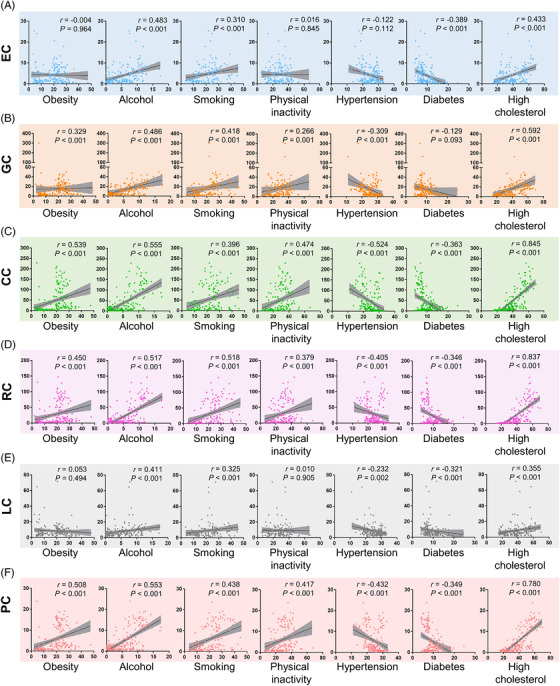
Correlation analyses between 5‐year prevalences of (A) EC, (B) GC, (C) CC, (D) RC, (E) LC and (F) PC and risk factors on the country level. Abbreviations: EC, esophageal cancer; GC, gastric cancer; LC, liver cancer; PC, pancreatic cancer; CC, colon cancer; RC, rectal cancer
FIGURE 5.
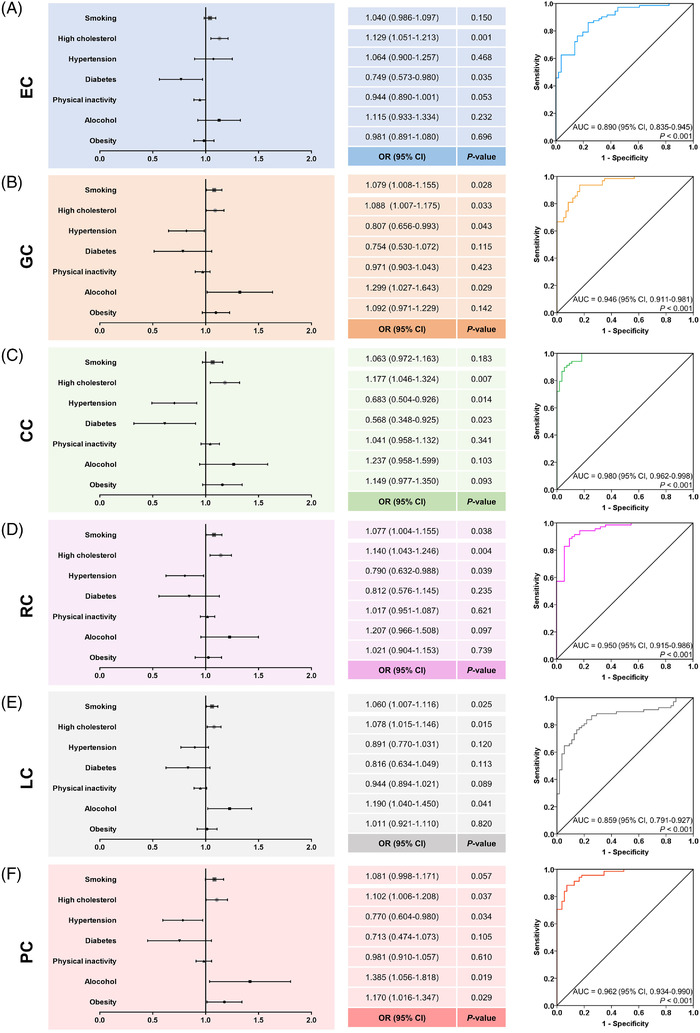
Determination of risk factors for (A) EC, (B) GC, (C) CC, (D) RC, (E) LC and (F) PC on the country level. Abbreviations: EC, esophageal cancer; GC, gastric cancer; LC, liver cancer; PC, pancreatic cancer; CC, colon cancer; RC, rectal cancer; ORs, odds ratios; CIs, confidence intervals; AUCs, area under the curves
GC prevalence was positively correlated with alcohol consumption (r = 0.486, P < 0.001), obesity (r = 0.329, P < 0.001), insufficient physical activity (r = 0.266, P = 0.001), high cholesterol (r = 0.592, P < 0.001), and smoking (r = 0.418, P < 0.001), but inversely with hypertension (r = ‐0.309, P < 0.001) (Figure 4B). In multivariate analysis, countries/regions were divided into two groups according to the median value of GC prevalence (10.55/100,000), smoking (OR = 1.079, P = 0.028), high cholesterol (OR = 1.088, P = 0.033) and alcohol (OR = 1.299, P = 0.029) were confirmed as positive correlates, and hypertension (OR = 0.807, P = 0.043) as negative correlate with high GC prevalence (Figure 5B). Combining these risk factors allowed accurate prediction of high GC prevalence (AUC = 0.946, P < 0.001) (Figure 5B).
Very similar results were obtained for CC prevalence which was positively related to alcohol (r = 0.555, P < 0.001), obesity (r = 0.539, P < 0.001), physical inactivity (r = 0.474, P < 0.001), high cholesterol (r = 0.845, P < 0.001), and smoking (r = 0.396, P < 0.001), as well as negatively to hypertension (r = ‐0.524, P < 0.001) and diabetes (r = ‐0.363, P < 0.001) (Figure 4C). High cholesterol (OR = 1.177, P = 0.007) maintained positive, while hypertension (OR = 0.683, P = 0.014) and diabetes (OR = 0.568, P = 0.023) maintained inverse correlations with high CC prevalence (≥ 16.55/100,000) in multivariate analysis and thus allowed very accurate high CC prevalence prediction (AUC = 0.980, P < 0.001) (Figure 5C).
RC prevalence was again correlated positively with alcohol (r = 0.517, P < 0.001), obesity (r = 0.450, P < 0.001), insufficient physical activity (r = 0.379, P < 0.001), high cholesterol (r = 0.837, P < 0.001), and smoking (r = 0.518, P < 0.001), and negatively with hypertension (r = ‐0.405, P < 0.001) and diabetes (r = ‐0.346, P < 0.001) (Figure 4D). For high RC prevalence (≥ 9.30/100,000), high cholesterol (OR = 1.140, P = 0.004) and smoking (OR = 1.077, P = 0.038) were still positively and hypertension (OR = 0.790, P = 0.039) was negatively associated with a high combined prediction probability in multivariate analysis (AUC = 0.950, P < 0.001) (Figure 5D).
Risk factors positively correlated with LC prevalence were alcohol (r = 0.411, P < 0.001), high cholesterol (r = 0.355, P < 0.001), and smoking (r = 0.325, P < 0.001), whereas hypertension (r = ‐0.232, P = 0.002) and diabetes (r = ‐0.321, P < 0.001) were correlated inversely with LC prevalence (Figure 4E). Smoking (OR = 1.060, P = 0.025), alcohol (OR = 1.190, P = 0.041), and high cholesterol (OR = 1.078, P = 0.015) retained significance in multivariate testing with a combined AUC of 0.859 (P < 0.001) for high LC prevalence (≥ 6.40/100,000) (Figure 5E).
For PC prevalence, positive correlations were found with alcohol (r = 0.553, P < 0.001), obesity (r = 0.508, P < 0.001), insufficient physical activity (r = 0.417, P < 0.001), high cholesterol (r = 0.780, P < 0.001), and smoking (r = 0.438, P < 0.001); again negative correlations were found with hypertension (r = ‐0.432, P < 0.001) and diabetes (r = ‐0.349, P < 0.001) (Figure 4F). In multivariate analysis, high cholesterol (OR = 1.102, P = 0.037), alcohol (OR = 1.385, P = 0.019), and obesity (OR = 1.170, P = 0.029) remained as positive predictors and hypertension (OR = 0.770, P = 0.034) as a negative predictor for high PC prevalence (≥ 2.65/100,000); their combination reached a very high predictive capacity (AUC = 0.962, P < 0.001) (Figure 5F).
Also, 1‐MIR of GI cancers was positively correlated with obesity, alcohol, smoking, insufficient physical activity, and high cholesterol, but negatively with hypertension and diabetes (Figure 6 and Supplementary Table S2). All risk factors but hypertension and diabetes were strongly correlated with the HDI levels (Supplementary Figure S1).
FIGURE 6.
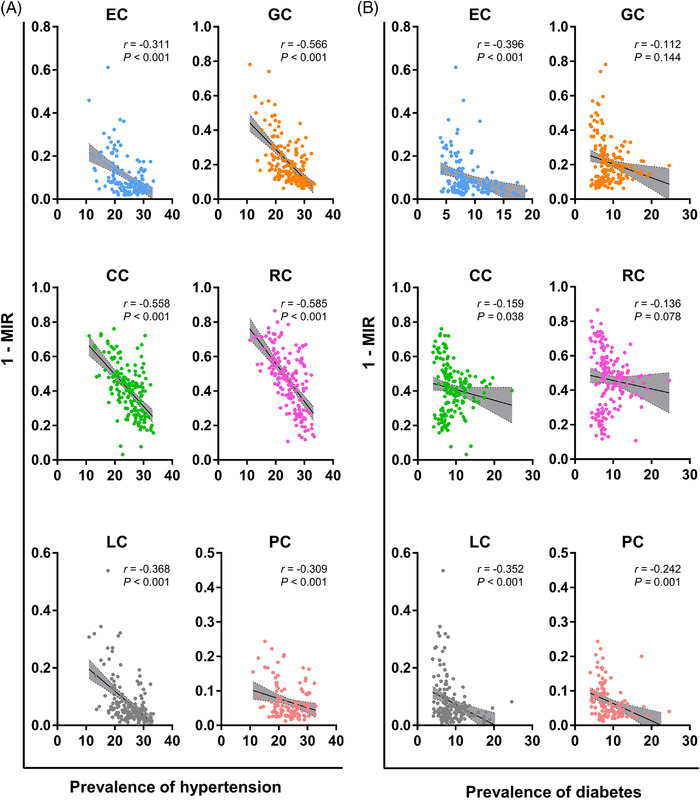
Correlations of 1‐MIR of GI cancers with (A) hypertension and (B) diabetes on the country level. Abbreviations: GI, gastrointestinal; MIR, mortality‐to‐incidence ratio; EC, esophageal cancer; GC, gastric cancer; LC, liver cancer; PC, pancreatic cancer; CC, colon cancer; RC, rectal cancer.
3.3. Trends in incidence stratified by age and gender
We next compared the APCs of incidence of 6 major GI cancers in 34 countries/regions stratified by gender and age (< 50 vs. ≥ 50 years) to identify recent trends in global incidence (Figure 7 and Supplementary Figures S2‐5).
FIGURE 7.
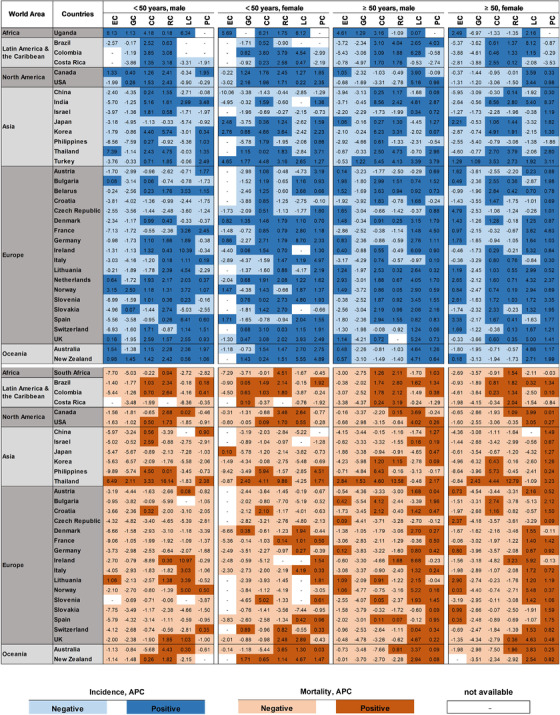
Heat map of APCs in incidence and mortality of 6 GI cancers. Abbreviations: GI, gastrointestinal; EC, esophageal cancer; GC, gastric cancer; LC, liver cancer; PC, pancreatic cancer; CC, colon cancer; RC, rectal cancer; APCs, annual percent changes
For older males (Figure 7 and Supplementary Figure S2), GC incidence was decreased in 32 countries/regions, while only Turkey (APC = 1.22) and Uganda (APC = 1.29) had rising incidences. EC incidence was decreased in 18 countries/regions, and RC incidence was decreased in 15 countries/regions. CC incidence was mainly increased in 24 countries/regions, with the highest increase in India (APC = 8.56). LC incidence was increased in 25 countries/regions; that of Colombia was the highest (APC = 6.28). PC incidence was the most increased in 28 countries/regions; France had the highest APC (4.50).
Very similar data were obtained for older females (Figure 7 and Supplementary Figure S3). GC incidence was decreased in 33 countries/regions, with the sole exception of Turkey (APC = 1.09). EC incidence went down in 18 countries/regions; the Czech Republic had the highest APC (4.79). Incidence was increased for CC in 21, for RC in 19, for LC in 22, and for PC in 29 countries/regions.
In younger males (Figure 7 and Supplementary Figure S4), GC and EC were also mostly decreasing in the vast majority of countries/regions. EC incidence was increased in 9 countries/regions, with the greatest increase occurring in Uganda (APC = 8.13). GC incidence was increased in only 6 countries/regions. LC increased in 16 countries/regions; the highest APC (10.39) was seen in Ireland. Incidence increased for PC in 17, CC in 25, and RC in 26 countries/regions (Figure 7 and Supplementary Figure S4).
The analysis of the younger females revealed mostly rising numbers (Figure 7 and Supplementary Figure S5). This was most pronounced for CC with positive APCs in 29 countries/regions, followed by PC in 26, RC in 22, and LC in 20 countries/regions. GC and EC incidence were decreased in 20 and 11 countries/regions, respectively.
The most striking finding of this analysis was the difference between younger and older females with overall more positive APC values for GC, CC, and RC in younger females (Figure 7 and Supplementary Figures S3 and S5).
3.4. Trends in mortality stratified by age and gender
Robustly decreasing mortality trends were seen for EC, GC, CC, and RC in most countries/regions and for all age and gender groups. Differences could be observed for PC and LC with decreases in males and females of < 50 years but increases in the elder groups (Figure 7). Detailed information is depicted in Supplementary Figures S6‐9.
A significantly decreasing mortality was seen in 29 of 30 countries/regions for GC, in 26 of 28 for EC, in 21 of 30 for CC, and in 17 of 29 for RC in younger males (Figure 7 and Supplementary Figure S6). In older males, mortality decreased in 29 of 30 for GC, in 24 of 30 for EC, in 18 of 30 for CC, and in 20 of 30 countries/regions for RC (Figure 7 and Supplementary Figure S7).
For PC and LC, differences between age groups became evident. LC mortality declined only in 13 of 30 countries/regions in elder male patients but declined in 19 of 27 countries/regions in younger males (Figure 7, Supplementary Figures S6 and S7). This difference was even more pronounced for PC mortality with negative APCs in 23 of 29 countries/regions for younger males, but only in 6 of 30 countries/regions for older males (Figure 7 and Supplementary Figures S6 and S7).
GI mortality trends in females were mostly similar to those in males. In younger females, decreases in EC, GC, CC, RC, and LC mortality were observed in 16 of 17, 23 of 30, 22 of 30, 17 of 28, and 15 of 25 countries/regions, respectively (Figure 7 and Supplementary Figure S8). For elder females, EC, GC, CC, RC, and LC mortalities were decreased in 22 of 29, 29 of 30, 23 of 30, 21 of 30, and 13 of 29 countries/regions, respectively (Figure 7 and Supplementary Figure S9). In striking contrast to the very similar positive development in the before‐mentioned GI cancers in females, an age‐specific difference became apparent for PC. PC mortality was decreased in 17 of 29 countries/regions in younger females, but not in elder ones (only 4 of 30 countries/regions with negative APCs) (Figure 7 and Supplementary Figures S8 and S9).
4. DISCUSSION
The present study comprehensively analyzed the global epidemiological pattern of GI cancers. Incidence and mortality of LC, EC, and GC were overall highest in Asia, and those of CRC and PC were highest in Europe.
We observed a positive correlation of incidence with national HDI levels. Incidence differed mostly for CRC with up to 5‐fold higher values in countries/regions with very high compared to low HDI, supporting previous data [21]. Since a similar pattern was also observed for mortality and high HDI has been related to the prevalence of lifestyle‐related risk factors including high diet intake [22] and BMI [23, 24], our data further linked GI cancer incidence and mortality to the western lifestyle [25].
Moreover, for CC, RC, and GC, high MIRs were consistently seen for countries/regions with low HDI, in comparison to those with very high HDI, again confirming previous data [26, 27]. When analyzing prevalence, we could verify that patients from the USA and UK had the highest chances to survive GI cancers [28]. These findings likely reflected the lack of efficient preventive strategies and insufficient treatment schedules in developing countries [29].
A habit with a proven role in cancer development is alcohol consumption [9], which we also found positively correlated with GI cancers’ 5‐year prevalence. Bagnardi et al. [30] observed a strong association of heavy drinking with GI cancer, especially for squamous cell EC.
Several studies reported a link between smoking and the development of GC [8, 31], CRC [7], and LC [32, 33] on the individual level as well as for PC [3] and EC [34] on a national level. We confirmed these findings and identified smoking as a risk factor for the 5‐year prevalence of GC, RC, and LC on the country level.
A previous report described a dose‐dependent relationship between physical activity and PC [35]. In the present study, physical inactivity was correlated positively with the 5‐year prevalence of GC, CC, RC, and PC in univariate but not in multivariate analysis. Considering though the strong correlation of obesity with PC prevalence in multivariate analysis and the established strong correlation between insufficient physical activity and high BMI [35, 36], it seems justified to conclude that physical inactivity‐linked obesity is indeed a very important risk factor for PC development.
Of note, such unhealthy habits could be modified. Therefore, current preventive strategies need to be amended in countries/regions with high prevalence of GI cancers. Routine screening with a focus on high‐risk populations and geographical areas is advisable as a primary preventive measure. Simultaneously, raising and increasing health awareness by public health education, publicity, and even medical interventions must be considered [37].
Very similar and for the most part attributable to unhealthy eating habits, total cholesterol was also strongly associated with GI cancers’ prevalence. A diet high in fat but low in carbohydrates, fruits, and vegetables increased the risk of CRC [38], and GC [39]. Others found a correlation between high cholesterol and CC, but not with GC [40]. This inconsistency might arise from the opposite effects of low‐ and high‐density lipoproteins, with the latter being a positive prognosticator, since for example an inverse association with type‐2 diabetes cancer risk has been observed [41].
Interestingly, we found an inverse correlation between hypertension and diabetes with the national 5‐year prevalence of all 6 GI cancers. One possible explanation may come from the fact that both co‐morbidities increase GI cancer mortality on the national [42, 43], regional [44], and individual levels [45, 46, 47]; decreases in cancer prevalence thus might reflect fewer surviving co‐morbid patients (Figure 6). However, the paradoxical better patient survival in countries with Western lifestyles can be best explained by their high HDI levels, enabling advanced treatment options.
Based on a 15‐year trend for incidence and mortality, EC and GC were decreasing in most countries, even in historically high‐risk Asia [4, 48, 49]. This might be due to improved treatment options [50] and positive effects of urban endoscopic screening [48, 49]. Additionally, reducing traditionally pickled and salty foods lowered GC incidence as observed when comparing Asian American and Native Asian populations [51].
However, the downside of this change towards Western diet and lifestyle is the worldwide increases of CC and RC, again especially pronounced for the younger generations [14, 52, 53], which we also observed.
Moreover, PC incidence and mortality were increasing in many countries/regions in all age‐gender groups except for younger males; this has been attributed to increased obesity, metabolic syndrome within aging populations, as well as age‐related hormonal changes [54, 55].
An increase in LC could also generally be observed for the elder. It has been previously reported that the mean onset age of LC has shifted from 58.2 years in 1990 to 62.5 years in 2017 [56]. Relevant etiologies for elder patients were hepatitis C, alcohol abuse, and non‐alcoholic steatohepatitis [56]. Most pronounced increases were generally observed in countries with high HDI, including the Netherlands, UK, and the USA. This strongly hinted at the necessity to establish more specific prevention strategies in these countries to stop continuous LC increase.
Despite the fact that the epidemiological data used were from the most comprehensive global cancer databases, this study has several limitations. National differences in incidence and mortality were possibly biased by differing screening standards and data quality. For several countries, epidemiological data originated exclusively from bigger cities and were thus not representative. Further, more recent data and high‐quality cancer registries from some low‐ and middle‐income countries were missing [14, 57]. Albeit the fact that data in epidemiological registries come from individual patients, the data quality is inferior to that from clinical studies, and comparisons might thus be biased. The lack of data on different sites and histological subtypes in the GLOBOCAN database clearly represents a further limitation. Finally, readers should always keep in mind that correlation does not mean association or even causality.
5. CONCLUSIONS
When overviewing the complete data set, it becomes evident that GI cancer burden was mostly associated with risk factors reflecting the so‐called Western lifestyle; this included high cholesterol, obesity, alcohol, and smoking. The MIRs for GC, CRC and PC were inversely correlated with increasing national HDI levels, what can best be explained by higher numbers of GI cancer survivors and advanced medical levels in countries/regions with higher HDI. Recent age‐ and gender‐specific trends were diverse. The detailed results of a given country or region could help guide preventive actions by identifying the most relevant factors modifying GI cancer risks, including age and gender. Future research should focus on the specific etiology of GI cancers behind epidemiologic transitions and on improving therapeutic strategies, especially for GI cancer patients with combined chronic metabolic diseases.
DECLARATIONS
CONFLICT OF INTEREST
The authors have no conflicts of interest to disclose.
ETHICS APPROVAL
Not applicable.
PATIENT CONSENT
Not applicable.
AUTHOR CONTRIBUTIONS
ML, CS, SZ and LL designed this research study; LL performed the analysis of data and wrote the first draft of manuscript; ML and CM contributed to the data analysis and interpretation; ML, CM, CS and SZ reviewed and revised the manuscript. All authors approved the final version of manuscript.
Supporting information
Supporting information.
Supplementary Table S1. Database source of 6 major GI cancers.
Supplementary Table S2. Spearman correlation analyses between 1‐MIR of GI cancers and lifestyle‐related risk factors
Supporting information.
Supplementary Figure S1. Correlation analyses between HDI levels of countries/regions and lifestyle‐associated risk factors. Abbreviations: HDI, human development indices.
Supplementary Figure S2. APCs of incidence of 6 GI cancers among males of ≥ 50 years. *, countries/regions registered from 1998 to 2011; &, 1998‐2010; #, 1999‐2012. Abbreviations: GI, gastrointestinal; EC, esophageal cancer; GC, gastric cancer; LC, liver cancer; PC, pancreatic cancer; CC, colon cancer; RC, rectal cancer; APCs, annual percent changes.
Supplementary Figure S3. APCs of incidence of 6 GI cancers among females of ≥ 50 years, female. *, countries/regions registered from 1998 to 2011; &, 1998‐2010; #, 1999‐2012. Abbreviations: GI, gastrointestinal; EC, esophageal cancer; GC, gastric cancer; LC, liver cancer; PC, pancreatic cancer; CC, colon cancer; RC, rectal cancer; APCs, annual percent changes.
Supplementary Figure S4. APCs of incidence of 6 GI cancers among males of <50 years. *, countries/regions registered from 1998 to 2011; &, 1998‐2010; #, 1999‐2012. Abbreviations: GI, gastrointestinal; EC, esophageal cancer; GC, gastric cancer; LC, liver cancer; PC, pancreatic cancer; CC, colon cancer; RC, rectal cancer; APCs, annual percent changes.
Supplementary Figure S5. APCs of incidence of 6 GI cancers among females of < 50 years. *, countries/regions registered from 1998 to 2011; &, 1998‐2010; #, 1999‐2012. Abbreviations: GI, gastrointestinal; EC, esophageal cancer; GC, gastric cancer; LC, liver cancer; PC, pancreatic cancer; CC, colon cancer; RC, rectal cancer; APCs, annual percent changes.
Supplementary Figure S6. APCs of mortality of 6 GI cancers among males of < 50 years. Abbreviations: GI, gastrointestinal; EC, esophageal cancer; GC, gastric cancer; LC, liver cancer; PC, pancreatic cancer; CC, colon cancer; RC, rectal cancer; APCs, annual percent changes.
Supplementary Figure S7. APCs of mortality of 6 GI cancers among males of ≥ 50 years. Abbreviations: GI, gastrointestinal; EC, esophageal cancer; GC, gastric cancer; LC, liver cancer; PC, pancreatic cancer; CC, colon cancer; RC, rectal cancer; APCs, annual percent changes.
Supplementary Figure S8. APCs of mortality of 6 GI cancers among females of < 50 years. Abbreviations: GI, gastrointestinal; EC, esophageal cancer; GC, gastric cancer; LC, liver cancer; PC, pancreatic cancer; CC, colon cancer; RC, rectal cancer; APCs, annual percent changes.
Supplementary Figure S9. APCs of mortality of 6 GI cancers among females of ≥ 50 years. Abbreviations: GI, gastrointestinal; EC, esophageal cancer; GC, gastric cancer; LC, liver cancer; PC, pancreatic cancer; CC, colon cancer; RC, rectal cancer; APCs, annual percent changes.
ACKNOWLEDGMENTS
We sincerely thank the Global Cancer Observatory and Global Health Observatory program for providing the global cancer data and world health data, respectively. Lili Lu was supported by the China Scholarship Council (grant number: 201908080127).
Lu L, Mullins CS, Schafmayer C, Zeißig S, Linnebacher M. A global assessment of recent trends in gastrointestinal cancer and lifestyle‐associated risk factors. Cancer Commun. 2021;41:1137–1151. 10.1002/cac2.12220
Contributor Information
Lili Lu, Email: lililu_92@hotmail.com.
Christina S. Mullins, Email: christina.mullins@med.uni-rostock.de.
Clemens Schafmayer, Email: Clemens.Schafmayer@med.uni-rostock.de.
Sebastian Zeißig, Email: sebastian.zeissig1@tu-dresden.de.
Michael Linnebacher, Email: michael.linnebacher@med.uni-rostock.de.
DATA AVAILABILITY STATEMENT
All data generated or analyzed during this study are available in the Global cancer observatory for the year 2020 (http://gco.iarc.fr/) and Global health observatory (https://apps.who.int/gho/data/node.main).
REFERENCES
- 1. Arnold M, Abnet CC, Neale RE, Vignat J, Giovannucci EL, McGlynn KA, et al. Global Burden of 5 Major Types Of Gastrointestinal Cancer. Gastroenterology. 2020;159(1):335‐49. [DOI] [PMC free article] [PubMed] [Google Scholar]
- 2. Ferlay J, Ervik M, Lam F, Colombet M, Mery L, Piñeros M, et al. Global Cancer Observatory: Cancer Today. Lyon, France: International Agency for Research on Cancer (2020). Available from: https://gco.iarc.fr/today, accessed 01 July 2021.
- 3. Huang J, Lok V, Ngai CH, Zhang L, Yuan J, Lao XQ, et al. Worldwide Burden of, Risk Factors for, and Trends in Pancreatic Cancer. Gastroenterology. 2021;160(3):744‐54. [DOI] [PubMed] [Google Scholar]
- 4. Li N, Wu P, Shen Y, Yang C, Zhang L, Chen Y, et al. Predictions of mortality related to four major cancers in China, 2020 to 2030. Cancer Commun (Lond). 2021;41(5):404‐13. [DOI] [PMC free article] [PubMed] [Google Scholar]
- 5. Al‐Ishaq RK, Overy AJ, Büsselberg D. Phytochemicals and Gastrointestinal Cancer: Cellular Mechanisms and Effects to Change Cancer Progression. Biomolecules. 2020;10(1):105. [DOI] [PMC free article] [PubMed] [Google Scholar]
- 6. Hensrud DD, Heimburger DC. Diet, nutrients, and gastrointestinal cancer. Gastroenterol Clin North Am. 1998;27(2):325‐46. [DOI] [PubMed] [Google Scholar]
- 7. Gausman V, Dornblaser D, Anand S, Hayes RB, O'Connell K, Du M, et al. Risk Factors Associated With Early‐Onset Colorectal Cancer. Clin Gastroenterol Hepatol. 2020;18(12):2752‐9.e2. [DOI] [PMC free article] [PubMed] [Google Scholar]
- 8. Guo Y, Li ZX, Zhang JY, Ma JL, Zhang L, Zhang Y, et al. Association Between Lifestyle Factors, Vitamin and Garlic Supplementation, and Gastric Cancer Outcomes: A Secondary Analysis of a Randomized Clinical Trial. JAMA Netw Open. 2020;3(6):e206628. [DOI] [PMC free article] [PubMed] [Google Scholar]
- 9. Scherübl H. Alcohol Use and Gastrointestinal Cancer Risk. Visc Med. 2020;36(3):175‐81. [DOI] [PMC free article] [PubMed] [Google Scholar]
- 10. LoConte NK, Brewster AM, Kaur JS, Merrill JK, Alberg AJ. Alcohol and Cancer: A Statement of the American Society of Clinical Oncology. J Clin Oncol. 2018;36(1):83‐93. [DOI] [PubMed] [Google Scholar]
- 11. Gupta S, Harper A, Ruan Y, Barr R, Frazier AL, Ferlay J, et al. International Trends in the Incidence of Cancer Among Adolescents and Young Adults. J Natl Cancer Inst. 2020;112(11):1105‐17. [DOI] [PMC free article] [PubMed] [Google Scholar]
- 12. Wong MCS, Huang J, Lok V, Wang J, Fung F, Ding H, et al. Differences in Incidence and Mortality Trends of Colorectal Cancer Worldwide Based on Sex, Age, and Anatomic Location. Clin Gastroenterol Hepatol. 2021;19(5):955‐66.e61. [DOI] [PubMed] [Google Scholar]
- 13. Bray F, Ferlay J, Soerjomataram I, Siegel RL, Torre LA, Jemal A. Global cancer statistics 2018: GLOBOCAN estimates of incidence and mortality worldwide for 36 cancers in 185 countries. CA Cancer J Clin. 2018;68(6):394‐424. [DOI] [PubMed] [Google Scholar]
- 14. Siegel RL, Torre LA, Soerjomataram I, Hayes RB, Bray F, Weber TK, et al. Global patterns and trends in colorectal cancer incidence in young adults. Gut. 2019;68(12):2179‐85. [DOI] [PubMed] [Google Scholar]
- 15. Ferlay J, Colombet M, Bray F. Cancer Incidence in Five Continents, CI5plus: IARC CancerBase No. 9 [Internet]. Lyon, France: International Agency for Research on Cancer; 2018. Available from: http://ci5.iarc.fr.
- 16. World Health Organization, Department of Information, Evidence and Research, mortality database (accessed on 20/06/2019).
- 17. World Health Organization. Global Health Observatory data repository: https://apps.who.int/gho/data/node.main. Accessed 10 September 2020.
- 18. Segi, M . Cancer Mortality for Selected Sites in 24 Countries (1950‐57). Department of Public Health, Tohoku University of Medicine, Sendai, Japan; 1960. [Google Scholar]
- 19. Doll R, Payne P, Waterhouse JAH eds. Cancer Incidence in Five Continents, Vol. I. Union Internationale Contre le Cancer, Geneva; 1966. [Google Scholar]
- 20. International Agency for Research on Cancer, WHO . Data visualization tools for exploring the global cancer burden in 2018. Available at: https://gco.iarc.fr/today/home. Accessed 1st July 2021.
- 21. Fidler MM, Soerjomataram I, Bray F. A global view on cancer incidence and national levels of the human development index. Int J Cancer. 2016;139(11):2436‐46. [DOI] [PubMed] [Google Scholar]
- 22. Kunzmann AT, Coleman HG, Huang WY, Kitahara CM, Cantwell MM, Berndt SI. Dietary fiber intake and risk of colorectal cancer and incident and recurrent adenoma in the Prostate, Lung, Colorectal, and Ovarian Cancer Screening Trial. Am J Clin Nutr. 2015;102(4):881‐90. [DOI] [PMC free article] [PubMed] [Google Scholar]
- 23. Arnold M, Pandeya N, Byrnes G, Renehan PAG, Stevens GA, Ezzati PM, et al. Global burden of cancer attributable to high body‐mass index in 2012: a population‐based study. Lancet Oncol. 2015;16(1):36‐46. [DOI] [PMC free article] [PubMed] [Google Scholar]
- 24. Donohoe CL, Pidgeon GP, Lysaght J, Reynolds JV. Obesity and gastrointestinal cancer. Br J Surg. 2010;97(5):628‐42. [DOI] [PubMed] [Google Scholar]
- 25. Arnold M, Sierra MS, Laversanne M, Soerjomataram I, Jemal A, Bray F. Global patterns and trends in colorectal cancer incidence and mortality. Gut. 2017;66(4):683‐91. [DOI] [PubMed] [Google Scholar]
- 26. Ferlay J, Shin HR, Bray F, Forman D, Mathers C, Parkin DM. Estimates of worldwide burden of cancer in 2008: GLOBOCAN 2008. Int J Cancer. 2010; 127:2893‐917. [DOI] [PubMed] [Google Scholar]
- 27. Bray F, Jemal A, Grey N, Ferlay J, Forman D. Global cancer transitions according to the Human Development Index (2008‐2030): a population‐based study. Lancet Oncol. 2012;13(8):790‐801. [DOI] [PubMed] [Google Scholar]
- 28. Feng RM, Zong YN, Cao SM, Xu RH. Current cancer situation in China: good or bad news from the 2018 Global Cancer Statistics? Cancer Commun (Lond). 2019;39(1):22. [DOI] [PMC free article] [PubMed] [Google Scholar]
- 29. Sharma R. An examination of colorectal cancer burden by socioeconomic status: evidence from GLOBOCAN 2018. EPMA J. 2020;11(1):95‐117. [DOI] [PMC free article] [PubMed] [Google Scholar]
- 30. Bagnardi V, Rota M, Botteri E, Tramacere I, Islami F, Fedirko V, et al. Alcohol consumption and site‐specific cancer risk: a comprehensive dose‐response meta‐analysis. Br J Cancer. 2015;112(3):580‐93. [DOI] [PMC free article] [PubMed] [Google Scholar]
- 31. Chao A, Thun MJ, Henley SJ, Jacobs EJ, McCullough ML, Calle EE. Cigarette smoking, use of other tobacco products and stomach cancer mortality in US adults: The Cancer Prevention Study II. Int J Cancer. 2002;101(4):380‐9. [DOI] [PubMed] [Google Scholar]
- 32. Lee YC, Cohet C, Yang YC, Stayner L, Hashibe M, Straif K. Meta‐analysis of epidemiologic studies on cigarette smoking and liver cancer. Int J Epidemiol. 2009;38(6):1497‐511. [DOI] [PubMed] [Google Scholar]
- 33. Pang Q, Qu K, Zhang J, Xu X, Liu S, Song S, et al. Cigarette smoking increases the risk of mortality from liver cancer: A clinical‐based cohort and meta‐analysis. J Gastroenterol Hepatol. 2015;30(10):1450‐60. [DOI] [PubMed] [Google Scholar]
- 34. GBD 2017 Oesophageal Cancer Collaborators . The global, regional, and national burden of oesophageal cancer and its attributable risk factors in 195 countries and territories, 1990‐2017: a systematic analysis for the Global Burden of Disease Study 2017. Lancet Gastroenterol Hepatol. 2020. [DOI] [PMC free article] [PubMed] [Google Scholar]
- 35. Michaud DS, Giovannucci E, Willett WC, Colditz GA, Stampfer MJ, Fuchs CS. Physical activity, obesity, height, and the risk of pancreatic cancer. JAMA. 2001; 286(8):921‐9. [DOI] [PubMed] [Google Scholar]
- 36. Patel AV, Rodriguez C, Bernstein L, Chao A, Thun MJ, Calle EE. Obesity, recreational physical activity, and risk of pancreatic cancer in a large U.S. Cohort. Cancer Epidemiol Biomarkers Prev. 2005;14(2):459‐66. [DOI] [PubMed] [Google Scholar]
- 37. Massetti GM, Dietz WH, Richardson LC. Excessive Weight Gain, Obesity, and Cancer: Opportunities for Clinical Intervention. JAMA. 2017;318(20):1975‐6. [DOI] [PMC free article] [PubMed] [Google Scholar]
- 38. Mathew A, Peters U, Chatterjee N, Kulldorff M, Sinha R. Fat, fiber, fruits, vegetables, and risk of colorectal adenomas. Int J Cancer. 2004;108(2):287‐92. [DOI] [PubMed] [Google Scholar]
- 39. Hu J, La Vecchia C, Negri E, de Groh M, Morrison H, Mery L. Macronutrient intake and stomach cancer. Cancer Causes Control. 2015;26(6):839‐47. [DOI] [PubMed] [Google Scholar]
- 40. Kitahara CM, Berrington de González A, Freedman ND, Huxley R, Mok Y, Jee SH, et al. Total cholesterol and cancer risk in a large prospective study in Korea. J Clin Oncol. 2011;29(12):1592‐8. [DOI] [PMC free article] [PubMed] [Google Scholar]
- 41. Zhao W, Guan J, Horswell R, Li W, Wang Y, Wu X, et al. HDL cholesterol and cancer risk among patients with type 2 diabetes. Diabetes Care. 2014;37(12):3196‐203. [DOI] [PMC free article] [PubMed] [Google Scholar]
- 42. Ge XJ, Du YX, Zheng LM, Wang M, Jiang JY. Mortality trends of liver cancer among patients with type 2 diabetes at the global and national level. J Diabetes Complications. 2020;34(8):107612. [DOI] [PubMed] [Google Scholar]
- 43. Seo JH, Kim YD. Hypertension is associated with oral, laryngeal, and esophageal cancer: a nationwide population‐based study. Sci Rep. 2020;10(1):10291. [DOI] [PMC free article] [PubMed] [Google Scholar]
- 44. Christakoudi S, Kakourou A, Markozannes G, Tzoulaki I, Weiderpass E, Brennan P, et al. Blood pressure and risk of cancer in the European Prospective Investigation into Cancer and Nutrition. Int J Cancer. 2020;146(10):2680‐93. [DOI] [PMC free article] [PubMed] [Google Scholar]
- 45. Harding JL, Andes LJ, Gregg EW, Cheng YJ, Weir HK, Bullard KM, et al. Trends in cancer mortality among people with vs without diabetes in the USA, 1988‐2015. Diabetologia. 2020;63(1):75‐84. [DOI] [PubMed] [Google Scholar]
- 46. Chen KH, Shao YY, Lin ZZ, Yeh YC, Shau WY, Kuo RN, et al. Type 2 diabetes mellitus is associated with increased mortality in Chinese patients receiving curative surgery for colon cancer. Oncologist. 2014;19(9):951‐8. [DOI] [PMC free article] [PubMed] [Google Scholar]
- 47. Yao W, Meng Y, Lu M, Fan W, Huang J, Li J, et al. Impact of type 2 diabetes mellitus on short‐term and long‐term outcomes of patients with esophageal squamous cell cancer undergoing resection: a propensity score analysis. Cancer Commun (Lond). 2018;38(1):14. [DOI] [PMC free article] [PubMed] [Google Scholar]
- 48. Zhang N, Li Y, Chang X, Lei F, Ma H, Liu J, et al. Long‐term effectiveness of one‐time endoscopic screening for esophageal cancer: A community‐based study in rural China. Cancer. 2020;126(20):4511‐20. [DOI] [PubMed] [Google Scholar]
- 49. Gao K, Wu J. National trend of gastric cancer mortality in China (2003‐2015): a population‐based study. Cancer Commun (Lond). 2019;39(1):24. [DOI] [PMC free article] [PubMed] [Google Scholar]
- 50. He Y, Li D, Shan B, Liang D, Shi J, Chen W, et al. Incidence and mortality of esophagus cancer in China, 2008‐2012. Chin J Cancer Res. 2019;31(3):426‐34. [DOI] [PMC free article] [PubMed] [Google Scholar]
- 51. Kim Y, Park J, Nam BH, Ki M. Stomach cancer incidence rates among Americans, Asian Americans and Native Asians from 1988 to 2011. Epidemiol Health. 2015;37:e2015006. [DOI] [PMC free article] [PubMed] [Google Scholar]
- 52. Wong MC, Huang J, Lok V, Wang J, Fung F, Ding H, et al. Differences in Incidence and Mortality Trends of Colorectal Cancer, Worldwide, Based on Sex, Age, and Anatomic Location. Clin Gastroenterol Hepatol. 2021;19(5):955‐66. [DOI] [PubMed] [Google Scholar]
- 53. Stoffel EM, Murphy CC. Epidemiology and Mechanisms of the Increasing Incidence of Colon and Rectal Cancers in Young Adults. Gastroenterology. 2020;158(2):341‐53. [DOI] [PMC free article] [PubMed] [Google Scholar]
- 54. Wildman RP, Tepper PG, Crawford S, Finkelstein JS, Sutton‐Tyrrell K, Thurston RC, et al. Do changes in sex steroid hormones precede or follow increases in body weight during the menopause transition? Results from the Study of Women's Health Across the Nation. J Clin Endocrinol Metab. 2012;97(9):E1695‐704. [DOI] [PMC free article] [PubMed] [Google Scholar]
- 55. Lovejoy JC. The influence of sex hormones on obesity across the female life span. J Womens Health. 1998;7(10):1247‐56. [DOI] [PubMed] [Google Scholar]
- 56. Lin L, Yan L, Liu Y, Qu C, Ni J, Li H. The Burden and Trends of Primary Liver Cancer Caused by Specific Etiologies from 1990 to 2017 at the Global, Regional, National, Age, and Sex Level Results from the Global Burden of Disease Study 2017. Liver Cancer. 2020;9(5):563‐82. [DOI] [PMC free article] [PubMed] [Google Scholar]
- 57. Gupta S, Harper A, Ruan Y, Barr R, Frazier AL, Ferlay J, et al. International trends in the incidence of cancer among adolescents and young adults. J Natl Cancer Inst. 2020;112(11):1105‐17. [DOI] [PMC free article] [PubMed] [Google Scholar]
Associated Data
This section collects any data citations, data availability statements, or supplementary materials included in this article.
Supplementary Materials
Supporting information.
Supplementary Table S1. Database source of 6 major GI cancers.
Supplementary Table S2. Spearman correlation analyses between 1‐MIR of GI cancers and lifestyle‐related risk factors
Supporting information.
Supplementary Figure S1. Correlation analyses between HDI levels of countries/regions and lifestyle‐associated risk factors. Abbreviations: HDI, human development indices.
Supplementary Figure S2. APCs of incidence of 6 GI cancers among males of ≥ 50 years. *, countries/regions registered from 1998 to 2011; &, 1998‐2010; #, 1999‐2012. Abbreviations: GI, gastrointestinal; EC, esophageal cancer; GC, gastric cancer; LC, liver cancer; PC, pancreatic cancer; CC, colon cancer; RC, rectal cancer; APCs, annual percent changes.
Supplementary Figure S3. APCs of incidence of 6 GI cancers among females of ≥ 50 years, female. *, countries/regions registered from 1998 to 2011; &, 1998‐2010; #, 1999‐2012. Abbreviations: GI, gastrointestinal; EC, esophageal cancer; GC, gastric cancer; LC, liver cancer; PC, pancreatic cancer; CC, colon cancer; RC, rectal cancer; APCs, annual percent changes.
Supplementary Figure S4. APCs of incidence of 6 GI cancers among males of <50 years. *, countries/regions registered from 1998 to 2011; &, 1998‐2010; #, 1999‐2012. Abbreviations: GI, gastrointestinal; EC, esophageal cancer; GC, gastric cancer; LC, liver cancer; PC, pancreatic cancer; CC, colon cancer; RC, rectal cancer; APCs, annual percent changes.
Supplementary Figure S5. APCs of incidence of 6 GI cancers among females of < 50 years. *, countries/regions registered from 1998 to 2011; &, 1998‐2010; #, 1999‐2012. Abbreviations: GI, gastrointestinal; EC, esophageal cancer; GC, gastric cancer; LC, liver cancer; PC, pancreatic cancer; CC, colon cancer; RC, rectal cancer; APCs, annual percent changes.
Supplementary Figure S6. APCs of mortality of 6 GI cancers among males of < 50 years. Abbreviations: GI, gastrointestinal; EC, esophageal cancer; GC, gastric cancer; LC, liver cancer; PC, pancreatic cancer; CC, colon cancer; RC, rectal cancer; APCs, annual percent changes.
Supplementary Figure S7. APCs of mortality of 6 GI cancers among males of ≥ 50 years. Abbreviations: GI, gastrointestinal; EC, esophageal cancer; GC, gastric cancer; LC, liver cancer; PC, pancreatic cancer; CC, colon cancer; RC, rectal cancer; APCs, annual percent changes.
Supplementary Figure S8. APCs of mortality of 6 GI cancers among females of < 50 years. Abbreviations: GI, gastrointestinal; EC, esophageal cancer; GC, gastric cancer; LC, liver cancer; PC, pancreatic cancer; CC, colon cancer; RC, rectal cancer; APCs, annual percent changes.
Supplementary Figure S9. APCs of mortality of 6 GI cancers among females of ≥ 50 years. Abbreviations: GI, gastrointestinal; EC, esophageal cancer; GC, gastric cancer; LC, liver cancer; PC, pancreatic cancer; CC, colon cancer; RC, rectal cancer; APCs, annual percent changes.
Data Availability Statement
All data generated or analyzed during this study are available in the Global cancer observatory for the year 2020 (http://gco.iarc.fr/) and Global health observatory (https://apps.who.int/gho/data/node.main).