

Abstract
Caveolin‐1(cav‐1) is overexpressed in prostate cancer (PC) and is associated with progression of the disease. We investigated the effects of CAV1‐T29107A and endothelial nitric oxide synthase (eNOS) G894T polymorphisms on the serum levels of testosterone, NO and prostate‐specific antigen (PSA) in patients with PC. We genotyped cav‐1 and eNOS genes in 112 PC patients and 150 healthy controls by PCR‐RFLP. Serum levels of and were measured using spectrophotometry, and serum levels of testosterone and PSA were measured by ELISA. The frequencies of CAV1 genotypes A/T vs. A/A according to the dominant model AT + TT vs. AA genotype and T allele were significantly higher in PC patients in comparison with the control group and considerably increased the risk of disease by 2.19‐, 1.44‐ and 1.6‐fold, respectively. AT + TT genotypes were associated significantly with the increased risk of PC in those with smoking or diabetes by 3.08‐fold (P = .004). Individuals carrying concurrently the T allele of CAV1 A29107T and the T allele of eNOS G894T genes had a significantly increased risk of PC by 2.52‐fold (P = .009). We did not find any significant relationship between eNOS G894T genotypes and alleles with susceptibility to PC. Our results highlighted the significance of CAV1‐T29107A SNP but not (eNOS) G894T in the susceptibility to PC in our the population that we have studied.
Keywords: caveolin‐1, diabetes, eNOS, prostate cancer, PSA, smoking, testosterone
1. INTRODUCTION
Prostate cancer (PC) is a multifactorial age‐related and slowly developing cancer of the male genitourinary system. 1 Several factors including genetic, demographic and race have been linked to the pathology of the disease. 1 , 2 During the past two decades, studies with the aim of investigating the role of genetics in the pathology of PC highlighted several susceptibility genes including HPC1 (1q24‐25), PCAP (1q42‐43), CAPB (1p36) and 20q13 (HPC20). 3 , 4 Caveolin‐1 (Cav‐1), (21 kDa) structurally is a component of (50‐80 nm bulb‐like invaginations in the plasma membrane that act as platforms for signal transduction 5 ) membrane domains. Cav‐1 gene maps to 7q31.1 which is a site reported to be deleted in some types of prostate tumours. 6 Cav‐1 participates in physiologic and pathologic processes such as lipid transport, membrane trafficking, gene regulation and tumorigenesis. 7 Interestingly, although Cav‐1 is mainly localized in caveolae structure, however, it also exists in non‐caveolar, cellular or extracellular forms. 8 Non‐caveolar Cav‐1 may modulate the expression of VEGF‐A in PC cells through which it may induce lymphatic endothelial cell migration, proliferation and tube formation. 8 Induction of lymphangiogenesis is a major mechanism in the progression and metastasis of PC. 8 In endothelial cells (ECs), Cav‐1 mediates the regulation of eNOS signalling by controlling its activation. 9 Therefore Cav‐1 probably plays a role in the activation of VEGF and eNOS in NO‐mediated angiogenesis. 10 Interestingly, hypermethylation of the Cav‐1 promoter which occurs at CpG sites at the 5′ promoter region of the gene has been reported in PC and may support the possibility of cav‐1 function as a tumour suppressor gene. 6
Although several papers highlighted the significance of genetic variants in the cav‐1 gene with susceptibility to cancers, 11 , 12 , 13 , 14 only a few studies have aimed to determine the role of cav‐1 gene SNPs in the susceptibility to PC. 15 , 16 Sugie and colleagues investigated the CAV1 T29107A (rs7804372) in a Japanese population and reported a reduced risk of PC in individuals with AA genotype. 15 CAV‐1 scaffolding domain regulates signal transduction to endothelial nitric oxide synthase (eNOS). This domain mediates the CAV‐1 binding to eNOS through which CAV‐1 regulates the production of NO. The eNOS‐produced NO has different biofunctions including participation in angiogenesis and vascular remodelling. 17 NO causes DNA damage and mutation and plays a role in carcinogenesis. 18 The eNOS expression has been well documented in endothelial or epithelial cells and a variety of tumours. 19 In humans, the eNOS encoding gene contains 26 exons and is located on chromosome 7q36. 19 The G894T SNP (rs1799983), located in exon 7, may have a regulatory role in NO synthesis 20 and recently has gained attention in tumour biology and susceptibility to cancers. 18 The significance of this SNP has been reported in the development of acute toxicity in individuals suffering from breast cancer patients with radiotherapy treatment 21 and colorectal cancer. 22
Considering the role of Cav‐1 in PC and its effect on the regulation of eNOS, we aimed to investigate the association of CAV1 T29107A and eNOS G894T polymorphisms with PC susceptibility in a population from west of Iran. Additionally, we assessed the effect of the above mentioned polymorphisms on serum concentration of testosterone, NO and PSA. We also studied the association between mentioned polymorphisms with the risk of developing PC in individuals with diabetes or cigarette smoking.
2. MATERIALS AND METHOD
2.1. History and including/excluding criteria
In this case‐control study, 112 individuals with PC (mean age of 63.3 ± 12.4 years) and 150 healthy controls with a mean age of 63.9 ± 12.9 years from the clinic of Kermanshah University of Medical Sciences were included. A complete medical history was taken from each participant and all of them were physically examined by an expert urologist. Data regarding the age, history of smoking, history of diabetes, height, weight and testosterone levels were collected. PSA levels of all individuals were measured. Patients with PC were selected by histopathology confirmation and a biopsy including six parts was taken using transrectal ultrasound‐guidance (TRUS) from patients with abnormal digital rectal examination (DRE). Similar to our previous study after biopsy procedures, patients were classified into five groups according to Gleason score: Gleason ≤ 6: grade group 1, Gleason 3 + 4 = 7: grade group 2, Gleason 4 + 3 = 7: grade group 3, Gleason 4 + 4 = 8, 3 + 5 = 8, 5 + 3 = 8: grade group 4 and Gleason 9‐10: grade group 5. 23 Most of the patients in the present study were in groups 1, 2 and 3 and under radiotherapy and hormone therapy. We recruited those patients with high‐grade PC (8‐10) after radical prostatectomy (RP). Control subjects with PSA serum levels > 2.5 ng/mL and the ratio of free PSA to total PSA (fPSA/PSA) ≤ 0.1 or positive digital rectal examination (DRE) were excluded. Individuals in control group with a history of cancer (of any type) or family history of PC were excluded from the study. The ethnic background of patients and controls was western Iranian Kurdish.
2.2. DNA extraction
Five millilitres of peripheral blood samples was collected from all participants, and genomic DNA was extracted from blood leukocytes using the phenol‐chloroform method. 24 The extracted DNA was stored at −20°C before analysis.
2.3. Genotyping
For genotyping of the Cav‐1 gene we used the Molecular online software (Primer 1) and designed four inner or outer forward or reverse primers for Tetra‐arms (TARMS) protocol as following: FI 5′‐AGC AGC TGT GCT TTG ATT GAT GTG AAT‐3′, RI 5′‐TTG GTC TTT GT A TTT AAG GGA GTT CAG GGT‐3′, FO 5′‐GTG ATG ACA GCA AGC AGT AGT GGA AGAG‐3′, RO 5′‐GTT TAT GAG AAA TGT CCT TTC CAC GGTG‐3′. 15 The specificity of these primers was confirmed in the NCBI primer blast (http://primer1.soton.ac.uk/primer1.html). TARMS‐PCR amplification was carried out in a final volume of 25 μL which consisted of initial denaturation at 94°C for 4 minutes, followed by 40 cycles at 94°Ϲ for 30 seconds as denaturation, 65°Ϲ for 30 minutes as annealing, 72°Ϲ for 1 minute as the extension and a final extension for 5 minutes at 72°Ϲ. Genotyping was conducted using PCR‐RFLP. We used the following primers to determine eNOS G894T genotypes: forward: 5′‐AAG GCA GGA GAC AGT GGA TGG A‐3′ and reverse: 5′‐CCC AGT CAA TCC CTT TGG TGC TCA‐3′. The PCR process was performed according to the following steps: DNA preincubation at 94°C for 4 minutes followed by 40 cycles at 94°Ϲ for 30 seconds, 65°Ϲ for 30 minutes and 72°Ϲ for 1 minute; then, cycles completed by a final extension for 5 minutes at 72°Ϲ. The PCR product was digested using the restriction enzyme MboI. The RFLP product has been electrophoresed in 2.5% agarose gel. 25
2.4. DNA sequencing
To confirm the detection of mutations from both polymorphisms of eNOS (G894T) and cav‐1 (A29107T), three PCR product samples of each genotype including wild‐type, heterozygote and homozygous mutant were sent for sequencing to Macrogen company.
2.5. Measurement of serum levels of / and testosterone
Serum concentrations of / were measured by Miranda spectrophotometry method. Moreover, serum levels of testosterone were measured by the ELISA method (commercial Mono‐bind kit, CA‐USA/ Elisa reader Stat Fax 2100, Awareness co, USA).
2.6. Statistical analysis
Quantitative results are expressed as mean ± SD. Hardy–Weinberg equilibrium (HWE) was tested by chi‐square test. Also, the frequencies of genotypes were determined in the patient and control group with chi‐square test. The OR [95% confidence interval] was calculated as an indicator of eNOS and Cav‐1 genotypes association with PC. Mann‐Whitney test was used in quantitative parameters without normal distribution. The comparison of two continuous variables with normal distribution was performed using independent t‐test. The chi‐square analysis was applied to compare variables and was used for quantitative analysis from the ANOVA test. In all analyses, SPSS16 software (IBM) was used for analysing data at a significance level of P < .05.
3. RESULTS
In genotyping of Cav‐1 gene SNP, the outer primers produced a 403‐bp fragment in all genotypes. For the inner primers, the exclusive A allele created a 249‐bp fragment and the specific primer T allele produced a 211‐bp fragment. These fragments of the DNA were separated by electrophoresis on 2.5% agarose gel (Figure 1). Moreover, in genotyping eNOS G894T gene SNP, the wild‐type GG genotype showed a 248‐bp product, whereas homozygous mutant TT genotype showed two fragments (158 and 90 bp) and heterozygous GT genotype showed three fragments (248, 163 and 85 bp) (Figure 2). The results of sequencing are presented in (Figure 3).
FIGURE 1.

The 2.5% agarose gel electrophoresis patterns for genotypes of CavA29107T SNP after amplification by TARMS PCR. Lane A is heterozygous mutant (A/T); Lanes C, wild genotype (A/A); Lane B, homozygous mutant (T/T); and the first lane demonstrates the 50‐bp DNA ladder
FIGURE 2.

The 2.5% agarose gel electrophoresis patterns for eNOS G894T gene polymorphism alleles analysed by PCR–RFLP. Lane 1: 50‐bp DNA Ladder; Lanes 2 and 7: TT homozygous genotype; Lanes 3 and 5: GT heterozygous genotype; Lane 6: GG homozygous genotype
FIGURE 3.
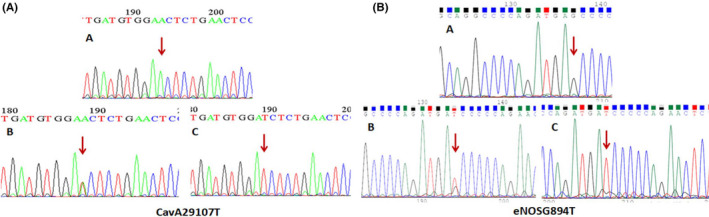
(a) The sequencing results of CavA29107T polymorphism: (A) wild genotype (AA); (B) heterozygote genotype (AT); (C) homozygous mutant genotype (TT), (b) sequencing results of eNOS G894T polymorphism: (A) wild genotype (GG); (B) heterozygote genotype (GT); (C) homozygous mutant genotype (TT)
The demographic features of the studied groups are shown in Table 1. The serum concentrations of PSA (61 vs. 0.7, P < .001) and fPSA (8.6 vs. 0.3, P < .001) were significantly higher in patients compared with the control group. Besides, the concentrations of testosterone (2.9 vs. 0.6, P < .001), and NO (49.1 vs. 5.4, P < .001) were significantly higher in control group compared with the test group (Table 1). Besides, a significant positive association was found between smoking and risk of PC (P < .001), and T2DM had a trend to increase the risk of PC but this association was not significant (P = .074).
TABLE 1.
The demographic characteristic and distribution of risk factors in prostatic cancer patients and control subjects
| Parameters | Case group (N = 112) | Control group (N = 150) | P values |
|---|---|---|---|
| Age | 63.3 ± 12.4 | 63.9 ± 12.9 | .82 |
| Testosterone (µmol/L) | 0.6 (0.1‐2.18) | 2.9 (2.2‐4.03) | <.001 |
| NO | 5.4 (3.6‐8.6) | 49.1 (42.2‐82.1) | <.001 |
| PSA (mg/dL) | 61 (18‐102.2) | 0.7 (0.3‐1.4) | <.001 |
| fPSA (mg/dL) | 8.6 (1.7‐20) | 0.3 (0.1‐0.6) | <.001 |
| fPSA/PSA | 0.19 (0.1‐0.27) | 0.42 (0.22‐0.67) | <.001 |
| Diabetes | |||
| No | 85 (75.9%) | 127 (84.7%) | (χ2 = 3.2, df = 1, P = .074) |
| Yes | 27 (24.1%) | 23 (15.3%) | |
| Smoking | |||
| No | 53 (47.3%) | 109 (72.2%) | (χ2 = 17.4, df = 1, P < .001) |
| Yes | 59 (52.7%) | 41 (27.3%) | |
Cav1 A29107T: The odds ratio (95% confidential interval) and frequency of CAV1 A29107T genotypes and alleles in patients with PC and control subjects are presented in Table 2. The overall distribution of CAV1 A29107T genotypes in PC patients was significantly different from that of the control group (P = .012). The frequencies of A/T (47.3% vs. 30%, P = .003) according to dominant model A/T + T/T vs. AA (54.5% vs. 36.7%, P = .004) genotypes and T allele (30.5% vs. 21.7%, P = .015) were significantly higher in PC patients when compared with the control group and increased the risk of the disease 2.19‐, 1.44‐ and 1.6‐fold, respectively. The results are shown in Table 2.
TABLE 2.
Odds ratio (95% confidential interval) and distribution of caveolin 1 (CAV1) genotypes and alleles in PC patients and control subjects
| Genotypes and alleles | PCa patients (n = 112) | Control subjects (n = 150) |
|---|---|---|
| CAV1 genotypes | ||
| A/A | 51 (45.5%) | 95 (63.3%) |
| A/T | 53 (47.3%) | 45 (30%) |
|
(χ2 = 8.7, df = 1, P = .003) 2.19 (1.3‐3.7, P = .003) | ||
| 8 (7.1%) (χ2 = 0.6, df = 1, P = .43) | ||
| T/T | 1.22 (0.74‐2, P = .43) | 10 (6.7%) |
| (χ2 = 8.8, df = 2, P = .012) | ||
| Dominant model of CAV1 genotypes | ||
| A/A | 51 (45.5%) | 95 (63.3%) |
| A/T + T/T | 61 (54.5%) | 55 (36.7%) |
|
(χ2 = 8.2, df = 1, P = .004) 1.44 (1.12‐1.8, P = .004) |
||
| CAV1 alleles | ||
| A | 155 (69.5) | 235 (78.3%) |
| T | 69 (30.5%) | 65 (21.7%) |
|
(χ2 = 6.1, df = 1, P = .015) 1.6 (1.03‐1.6, P = .026) |
||
In the single‐locus analysis, distribution of genotypes and frequency of alleles of eNOS G894T SNP did not show a significant difference between the test and control groups (Table 3).
TABLE 3.
Odds ratio (95% confidential interval) and distribution of eNOS genotypes and allele case and control groups
| Genotypes and alleles | Case group (n = 112) | Control group (n = 150) |
|---|---|---|
| eNOS genotypes | ||
| G/G | 58 (51.8%) | 85 (56.7%) |
| G/T | 50 (44.6%) | 60 (40%) |
|
(χ2 = 0.9, df = 1, P = .4) 1.22 (0.74‐2.1, P = .41) |
||
| T/T | 4(3.6%) | |
|
(χ2 = 0.1, df = 1, P = .84) 1.17 (0.5‐2.1, P = .84) |
5 (3.3%) | |
| (χ2 = 0.72, df = 2, P = .7) | ||
| Dominant model of eNOS genotypes | ||
| G/G | 58 (51.8%) | 85 (56.7%) |
| G/T + T/T | 54 (48.2%) | 65 (42.3%) |
|
(χ2 = 0.7, df = 1, P = .41) 1.22 (0.758‐2.1, P = .41) |
||
| eNOS alleles | ||
| G | 166 (74.1) | 230 (76.7%) |
| T | 58 (25.9%) | 70 (23.3%) |
| (χ2 = 0.5, df = 1, P = .49) 1.15 (0.9‐1.3, P = .49) |
The concentration of testosterone, PSA, fPSA, NO and fPSA/PSA was compared between the test and control groups regarding the dominant model of CAV1 genotypes (A/A, A/T + T/T) in Table 4. The significantly lower concentration of fPSA/PSA ratio (0.18 vs. 0.25, P = .04) was observed in PC patients carrying A/A genotypes with respect to the dominant model compared with those A/T + T/T genotypes. Interestingly, in the presence of A/A genotype, a significant higher concentration of fPSA/PSA ratio (0.9 vs. 0.5, P = .03) was observed in control subjects in comparison with carriers of A/T + T/T genotypes (Table 4).
TABLE 4.
The concentration of testosterone, PSA, fPSA, NO and fPSA/PSA between the case and control groups with respect to the dominant model of CAV1 genotypes (A/A, A/T + T/T)
| Parameters | Control subjects A/A n = 95 | Control group A/T + T/T n = 95 | P values |
|---|---|---|---|
| Testosterone (µmol/L) | 3.81 ± 1.58 | 3.19 ± 1.49 | .9 |
| NO | 53.99 ± 20.61 | 55.15 ± 22.72 | .78 |
| PSA (mg/dL) | 0.88 ± 0.71 | 0.965 ± 0.692 | .5 |
| fPSA (mg/dL) | 0.376 ± 0.387 | 0.464 ± 0.371 | .14 |
| fPSA/PSA | 0.939 ± 0.293 | 0.586 ± 0.544 | .037 |
| Parameters | Case group A/A n = 51 | Case group A/T + T/T n = 61 | P values |
|---|---|---|---|
| Testosterone (µmol/L) | 1.53 ± 1.95 | 1.43 ± 1.65 | .8 |
| NO | 6.63 ± 4.55 | 6.90 ± 4.85 | .78 |
| PSA (mg/dL) | 78.91 ± 74.33 | 74.45 ± 96.37 | .7 |
| fPSA (mg/dL) | 16.72 ± 22.65 | 12.48 ± 18.24 | .32 |
| fPSA/PSA | 0.18 ± 0.1 | 0.25 ± 0.23 | .048 |
The influence of diabetes or smoking and the dominant model of CAV1 A29107T genotypes on PC susceptibility has been shown in Table 5. In the presence of A/T + T/T genotypes according to the dominant model, the distribution of PC patients with diabetes or smoking was significantly higher (68.9%) compared with PC patients without it (41.8%) and significantly increased the risk of PC in those with smoking or diabetes by 3.08 time (P = .004) (Table 5).
TABLE 5.
Association between the presence of diabetes or smoking and the dominant model of CAV1 genotypes with the risk of prostate cancer
| A/A genotype of CAV1 | A/T + T/T genotype of CAV1 | |||
|---|---|---|---|---|
| Case | Control | Case | Control | |
| Diabetes or smoking | ||||
| Absence | 25 (49%) | 55 (57.9%) | 19 (31.1%) | 32 (58.2%) |
| Presence | 26 (52.9%) | 40 (42.1%) | 42 (68.9%) | 23 (41.8%) |
|
(χ2 = 1.1, df = 1, P = .3) 1.43 (0.72‐2.8, P = .3) |
(χ2 = 8.6, df = 1, P = .003) 3.08 (1.4‐6.6, P = .004) |
|||
The logistic regression analysis was used to investigate the interaction between CAV1 A29107T, and eNOS G894T, T alleles in case group compared with the healthy control group and results have shown in Table 6. We noticed that the concurrent presence of the T allele of CAV1 A29107T and T allele of eNOS G894T genes considerably increases the chances of PC development by 2.52‐fold (P = .008). Besides, there was a trend towards the increased risk of PC by 1.96 time in presence of T allele of CAV1 A29107T and lack of T allele of eNOS G894T genes (P = .054) (Table 6).
TABLE 6.
Odds ratios interaction between CAV1 T allele and eNOS T allele in case group compared with the control group
| CAV1 | eNOS | Case group | Control group | OR (95% CI) |
|---|---|---|---|---|
| T | T | |||
| − | − | n = 28 (25%) | n = 57 (38%) | References |
| + | − | n = 30 (26.8%) | n = 29 (19.3%) | 1.96 (0.98‐3.9, P = .057) (χ2 = 3.9, df = 1, P = .054) |
| − | + | n = 23 (20.5%) | n = 39 (26%) | 1.21 (0.6‐2.4, P = .6) (χ2 = 0.3, df = 1, P = .58) |
| + | + | n = 31 (27.7%) | n = 25 (16.7%) | 2.52 (1.17‐4.8, P = .009) (χ2 = 7, df = 1, P = .008) |
The DNA sequencing analysis for SNP rs7804372 from the Cav‐1 gene showed that (a) the T nucleotide in the homozygous mutant genotype is located at position 195 and is shown as a single green peak, (b) two T and A nucleotides in the heterozygote genotype are located at position 189 and are characterized by a combination of two red and green picks, and (c) the T nucleotide in homozygous mutant genotype was in position 190 and was observed as a single pick red. Additionally, the DNA sequencing analysis for SNP rs1799983 from the eNOS gene showed that (a) the T nucleotide in the homozygous mutant genotype is located at position 134 and is shown as a single red peak, (b) the nucleotide in the homozygous mutant genotype is located at position 137 and is shown as a single black peak, and (c) the nucleotide in the heterozygote mutant genotype is located at position 138 (shown as the red/black peak).
4. DISCUSSION
In this study, we used a genetic approach to investigate the effect of CAV1 A29107T and eNOS G894T polymorphisms and the serum levels of NO, PSA and testosterone on susceptibility to PC. New evidence suggests that the Cav‐1 molecular mechanism for tumorigenesis is based on the eNOS regulation, which may lead to the hypothesis that it can predict the progression of cancer. 26 The role of CAV1 T29107A SNP (rs7804372) in the predisposition to urothelial tract cancer has been studied by Chang et al They reported that 79.1% of individuals with upper urothelial tract cancer were carrying T allele while only 20.9% were found to carry A allele. 12 Wu et al investigated the association of rs7804372 SNP in the cav‐1 gene with the risk PC in a Taiwanese population. Their results showed that the T allele may be a risk factor in predisposition to PC. The percentages of each genotype of this SNP in the case group were reported as the following: TT (65.2%), AT (30.0%) and AA (4.8%) (P‐value = .0004). 27 Our results showed for the first time that A/T + T/T genotypes according to the dominant model and T allele of CAV1 A29107T polymorphism are considerably associated with increased risk of PC by 1.4 and 1.6 times, respectively, in the population from western Iran. Additionally, we identified that serum NO levels are significantly higher in control subjects comparing to the test group. Our findings were inconsistent with the results of Arsova‐Sarafinovska et al that reported elevated levels of / in individuals with PC. 28 The G894T SNP (rs1799983) is another SNP that gained attention in the predisposition to a variety of cancers including PC. Diler et al in their investigation showed that GT (P = .0001) and TT (P = .0001) genotypes of rs1799983 SNP were common in individuals with PC. Their results showed that the T allele (P = .0001) may act as the risk factor in PC in their included Turkish population. 29 Wu et al in their meta‐analysis showed that rs1799983 was in association with the risk of PC (P = .03). 30 Nikolić and colleagues found no association between minor allele T and the risk of PC (P = .77). They failed to find a link between rs1799983 genotypes with the susceptibility and progression of PC. 31 We did not find any significant association between eNOS G894T polymorphism with the risk of PC. Our results were consistent with Nikolić et al, and we report that neither eNOS G894T genotypes nor alleles were associated with PC. Finally, we studied the effect of these two SNPs in predisposition to PC in individuals with diabetes and smoking. Interestingly, individuals suffering from PC with diabetes or smoking carrying A/T + T/T genotype of CAV1 had a higher risk of developing PC by 3.08 times.
In the present study, we investigated the association of CAV1‐T29107A and eNOS G894T SNPs with the serum levels of testosterone, NO, PSA in patients with PC. Our results regarding CAV1‐T29107A SNP showed that AA genotype and T allele were significantly higher in PC patients in comparison with control group. Additionally, the results showed that the risk of PC development increases by 2.52‐fold when individuals concurrently carry mutant alleles of Cav‐1(T allele) and eNOS (T allele) genes. Therefore, these individuals need periodic monitoring of the PSA serum levels. We recommend including more patients and controls in future studies. One weakness of our study was that we did not report the serum levels of Cav‐1; therefore, we recommend to other groups to measure it when investigating the effects of Cav‐1 in a genotyping study. Moreover, investigation of other SNPs in Cav‐1 and eNOS genes and their association with PC pathology will help us to have a better insight into the role of Cav‐1 and eNOS in the pathology and prognosis of PC.
ETHICAL APPROVAL
This research was preapproved by the ethical committee of Kermanshah University of Medical Sciences (EC94430). The procedures of the study were approved by the Helsinki research ethics committee of the Iranian authority ministry of health according to the World Medical Association Declaration of Helsinki. All participants signed a consent letter.
CONFLICT OF INTEREST
The authors declare that they have no conflicts of interest.
ACKNOWLEDGEMENTS
This work was performed in partial fulfilment of the requirements for the biochemistry MSc thesis of Mahdieh Aliyari, in the School of Medicine, Kermanshah University of Medical Sciences, Kermanshah, Iran. The authors gratefully acknowledge the research council of Kermanshah University of Medical Sciences (grant number: 94430) for financial support.
Aliyari M, Elieh Ali Komi D, Kiani A, et al. The role of caveolin‐1 and endothelial nitric oxide synthase polymorphisms in susceptibility to prostate cancer. Int J Exp Path. 2021;102:260–267. 10.1111/iep.12394
Funding information
This study was funded by research council of Kermanshah University of Medical Sciences (Grant Number: 94430)
Contributor Information
Asad Vaisi‐Raygani, Email: asadvaisiraygani@kums.ac.ir.
Fariborz Bahrehmand, Email: fariborz.Bahrehmand@kums.ac.ir.
REFERENCES
- 1. Pudova EA, Lukyanova EN, Nyushko KM, et al. Differentially expressed genes associated with prognosis in locally advanced lymph node‐negative prostate cancer. Front Genet. 2019;10:730. [DOI] [PMC free article] [PubMed] [Google Scholar]
- 2. Rebbeck TR. Prostate cancer genetics: variation by race, ethnicity, and geography. Semin Radiat Oncol. 2017;27(1):3‐10. [DOI] [PMC free article] [PubMed] [Google Scholar]
- 3. Xu J, Zheng SL, Chang B, et al. Linkage of prostate cancer susceptibility loci to chromosome 1. Hum Genet. 2001;108(4):335‐345. [DOI] [PubMed] [Google Scholar]
- 4. Zheng SL, Xu J, Isaacs SD, et al. Evidence for a prostate cancer linkage to chromosome 20 in 159 hereditary prostate cancer families. Hum Genet. 2001;108(5):430‐435. [DOI] [PubMed] [Google Scholar]
- 5. Raja SA, Shah STA, Tariq A, et al. Caveolin‐1 and dynamin‐2 overexpression is associated with the progression of bladder cancer. Oncol Lett. 2019;18(1):219‐226. [DOI] [PMC free article] [PubMed] [Google Scholar]
- 6. Cui J, Rohr LR, Swanson G, Speights VO, Maxwell T, Brothman AR. Hypermethylation of the caveolin‐1 gene promoter in prostate cancer. Prostate. 2001;46(3):249‐256. [DOI] [PubMed] [Google Scholar]
- 7. Yang H, Guan L, Li S, et al. Mechanosensitive caveolin‐1 activation‐induced PI3K/Akt/mTOR signaling pathway promotes breast cancer motility, invadopodia formation and metastasis in vivo. Oncotarget. 2016;7(13):16227‐16247. [DOI] [PMC free article] [PubMed] [Google Scholar]
- 8. Nassar ZD, Hill MM, Parton RG, Francois M, Parat MO. Non‐caveolar caveolin‐1 expression in prostate cancer cells promotes lymphangiogenesis. Oncoscience. 2015;2(7):635‐645. [DOI] [PMC free article] [PubMed] [Google Scholar]
- 9. Kowalska K, Habrowska‐Górczyńska DE, Neumayer C, et al. Lower levels of Caveolin‐1 and higher levels of endothelial nitric oxide synthase are observed in abdominal aortic aneurysm patients treated with simvastatin. Acta Biochim Pol. 2018;65(1):111‐118. [DOI] [PubMed] [Google Scholar]
- 10. Pan YM, Yao YZ, Zhu ZH, Sun XT, Qiu YD, Ding YT. Caveolin‐1 is important for nitric oxide‐mediated angiogenesis in fibrin gels with human umbilical vein endothelial cells. Acta Pharmacol Sin. 2006;27(12):1567‐1574. [DOI] [PubMed] [Google Scholar]
- 11. Nwosu ZC, Ebert MP, Dooley S, Meyer C. Caveolin‐1 in the regulation of cell metabolism: a cancer perspective. Mol Cancer. 2016;15(1):71. [DOI] [PMC free article] [PubMed] [Google Scholar]
- 12. Chang WS, Lin SS, Li FJ, et al. Significant association of caveolin‐1 (CAV1) genotypes with upper urothelial tract cancer. Anticancer Res. 2013;33(11):4907‐4912. [PubMed] [Google Scholar]
- 13. Fang X, Li X, Yin Z, et al. Genetic variation at the microRNA binding site of CAV1 gene is associated with lung cancer susceptibility. Oncotarget. 2017;8(54):92943‐92954. [DOI] [PMC free article] [PubMed] [Google Scholar]
- 14. Mandal RK, Raish M, Jawed A, et al. Meta‐analysis reveals no correlation of caveolin‐1 G14713A (G>A) gene polymorphism with increased cancer risk in Taiwanese population. Int J Health Sci. 2018;12(3):3‐9. [PMC free article] [PubMed] [Google Scholar]
- 15. Sugie S, Tsukino H, Yamauchi T, et al. Functional polymorphism in the CAV1 T29107A gene and its association with prostate cancer risk among Japanese men. Anticancer Res. 2013;33(3):1023‐1027. [PubMed] [Google Scholar]
- 16. Haeusler J, Hoegel J, Bachmann N, et al. Association of a CAV‐1 haplotype to familial aggressive prostate cancer. Prostate. 2005;65(2):171‐177. [DOI] [PubMed] [Google Scholar]
- 17. Bucci M, Gratton JP, Rudic RD, et al. In vivo delivery of the caveolin‐1 scaffolding domain inhibits nitric oxide synthesis and reduces inflammation. Nat Med. 2000;6(12):1362‐1367. [DOI] [PubMed] [Google Scholar]
- 18. Medeiros R, Morais A, Vasconcelos A, et al. Endothelial nitric oxide synthase gene polymorphisms and genetic susceptibility to prostate cancer. Eur J Cancer Prev. 2002;11(4):343‐350. [DOI] [PubMed] [Google Scholar]
- 19. Wu X, Wang ZF, Xu Y, Ren R, Heng BL, Su ZX. Association between three eNOS polymorphisms and cancer risk: a meta‐analysis. Asian Pac J Cancer Prev. 2014;15(13):5317‐5324. [DOI] [PubMed] [Google Scholar]
- 20. Nassereddine S, Hassani Idrissi H, Habbal R, et al. The polymorphism G894 T of endothelial nitric oxide synthase (eNOS) gene is associated with susceptibility to essential hypertension (EH) in Morocco. BMC Med Genet. 2018;19(1):127. [DOI] [PMC free article] [PubMed] [Google Scholar]
- 21. Córdoba EE, Abba MC, Lacunza E, Fernánde E, Güerci AM. Polymorphic variants in oxidative stress genes and acute toxicity in breast cancer patients receiving radiotherapy. Cancer Res Treat. 2016;48(3):948‐954. [DOI] [PMC free article] [PubMed] [Google Scholar]
- 22. Chen Y, Li J, Guo Y, Guo XY. Nitric oxide synthase 3 gene variants and colorectal cancer: a meta‐analysis. Asian Pac J Cancer Prev. 2014;15(8):3811‐3815. [DOI] [PubMed] [Google Scholar]
- 23. Kiani A, Kamankesh M, Vaisi‐Raygani A, et al. Activities and polymorphisms of MMP‐2 and MMP‐9, smoking, diabetes and risk of prostate cancer. Mol Biol Rep. 2020;47(12):9373‐9383. [DOI] [PubMed] [Google Scholar]
- 24. Jafari Y, Rahimi Z, Vaisi‐Raygani A, Rezaei M. Interaction of eNOS polymorphism with MTHFR variants increase the risk of diabetic nephropathy and its progression in type 2 diabetes mellitus patients. Mol Cell Biochem. 2011;353(1‐2):23‐34. [DOI] [PubMed] [Google Scholar]
- 25. Mohammadi‐Noori E, Salehi N, Mozafari H, et al. Association of AHSG gene polymorphisms with serum Fetuin‐A levels in individuals with cardiovascular calcification in west of Iran. Mol Biol Rep. 2020;47(3):1809‐1820. [DOI] [PubMed] [Google Scholar]
- 26. Conde MC, Ramirez‐Lorca R, Lopez‐Jamar JM, et al. Genetic analysis of caveolin‐1 and eNOS genes in colorectal cancer. Oncol Rep. 2006;16(2):353‐359. [PubMed] [Google Scholar]
- 27. Wu HC, Chang CH, Tsou YA, Tsai CW, Lin CC, Bau DT. Significant association of caveolin‐1 (CAV1) genotypes with prostate cancer susceptibility in Taiwan. Anticancer Res. 2011;31(2):745‐749. [PubMed] [Google Scholar]
- 28. Arsova‐Sarafinovska Z, Eken A, Matevska N, et al. Increased oxidative/nitrosative stress and decreased antioxidant enzyme activities in prostate cancer. Clin Biochem. 2009;42(12):1228‐1235. [DOI] [PubMed] [Google Scholar]
- 29. Diler SB, Öden A. The T ‐786C, G894T, and intron 4 VNTR (4a/b) polymorphisms of the endothelial nitric oxide synthase gene in prostate cancer cases. Genetika. 2016;52(2):249‐254. [DOI] [PubMed] [Google Scholar]
- 30. Wu JH, Yang K, Ma HS, Xu Y. Association of endothelia nitric oxide synthase gene rs1799983 polymorphism with susceptibility to prostate cancer: a meta‐analysis. Tumour Biol. 2014;35(7):7057‐7062. [DOI] [PubMed] [Google Scholar]
- 31. Nikolić ZZ, Pavićević D, Romac SP, Brajušković GN. Genetic variants within endothelial nitric oxide synthase gene and prostate cancer: a meta‐analysis. Clin Transl Sci. 2015;8(1):23‐31. [DOI] [PMC free article] [PubMed] [Google Scholar]