

Abstract
Background
Optimal flow settings during high-flow nasal cannula (HFNC) therapy are unknown. We investigated the optimal flow settings during HFNC therapy based on breathing pattern and tidal inspiratory flows in patients with acute hypoxemic respiratory failure (AHRF).
Methods
We conducted a prospective clinical study in adult hypoxemic patients treated by HFNC with a fraction of inspired oxygen (FIO2) ≥ 0.4. Patient’s peak tidal inspiratory flow (PTIF) was measured and HFNC flows were set to match individual PTIF and then increased by 10 L/min every 5–10 min up to 60 L/min. FIO2 was titrated to maintain pulse oximetry (SpO2) of 90–97%. SpO2/FIO2, respiratory rate (RR), ROX index [(SpO2/FIO2)/RR], and patient comfort were recorded after 5–10 min on each setting. We also conducted an in vitro study to explore the relationship between the HFNC flows and the tracheal FIO2, peak inspiratory and expiratory pressures.
Results
Forty-nine patients aged 58.0 (SD 14.1) years were enrolled. At enrollment, HFNC flow was set at 45 (38, 50) L/min, with an FIO2 at 0.62 (0.16) to obtain an SpO2/FIO2 of 160 (40). Mean PTIF was 34 (9) L/min. An increase in HFNC flows up to two times of the individual patient’s PTIF, incrementally improved oxygenation but the ROX index plateaued with HFNC flows of 1.34–1.67 times the individual PTIF. In the in vitro study, when the HFNC flow was set higher than PTIF, tracheal peak inspiratory and expiratory pressures increased as HFNC flow increased but the FIO2 did not change.
Conclusion
Mean PTIF values in most patients with AHRF were between 30 and 40 L/min. We observed improvement in oxygenation with HFNC flows set above patient PTIF. Thus, a pragmatic approach to set optimal flows in patients with AHRF would be to initiate HFNC flow at 40 L/min and titrate the flow based on improvement in ROX index and patient tolerance.
Trial registration: ClinicalTrials.gov (NCT03738345). Registered on November 13th, 2018. https://clinicaltrials.gov/ct2/show/NCT03738345?term=NCT03738345&draw=2&rank=1
Supplementary Information
The online version contains supplementary material available at 10.1186/s13613-021-00949-8.
Keywords: High-flow nasal cannula, Flow setting, Peak inspiratory flow, Hypoxemia
Introduction
During high-flow nasal cannula (HFNC) therapy, oxygenation is improved by delivering supplemental oxygen at a flow that exceeds the patient’s peak inspiratory flow [1, 2]. Numerous randomized controlled trials and meta-analyses have shown that HFNC improves oxygenation and reduces the need for intubation in hypoxemic patients compared with conventional oxygen therapy [3–8]. Additionally, a recent clinical practice guideline provides a strong recommendation for use of HFNC in patients with acute hypoxemic respiratory failure (AHRF) [6].
Flow settings play a critical role when using HFNC, as the physiological effects of HFNC are flow-dependent. The higher the flow, the greater is the improvement in inspiratory effort and dynamic lung compliance [9–12]. This has led many clinicians to arbitrarily initiate HFNC at the higher flow settings, such as 60 L/min for adults; however, higher flows may not be well tolerated or associated with optimal oxygenation in all patients [13]. When the HFNC flow is set to match or exceed patient peak tidal inspiratory flow (PTIF), positive end-expiratory pressure (PEEP) begins to be generated [14], and a linear increase in PEEP occurs with an incremental increase in gas flow while breathing with the mouth closed [14–17]. In vitro studies have reported that the measured fraction of inspired oxygen (FIO2) at the nose level is lower than the set FIO2 when HFNC flow is set lower than PTIF [18].
The PTIF in adults varies greatly by disease and may be high in the presence of respiratory distress [17, 19–21]. HFNC flows used in many studies and real-life clinical practice also vary widely, from 20 to 60 L/min [22]. Moreover, breathing patterns, including PTIF, tidal volume (Vt), inspiratory time (Ti), and respiratory rate (RR), of patients with AHRF who are treated by HFNC have not been well characterized and there is little guidance on optimal HFNC flow settings based on patient’s breathing patterns.
Therefore, in this clinical study, we studied breathing patterns of patients with AHRF treated by HFNC and measured their PTIF. We also assessed patient clinical response and changes in comfort with different HFNC flows that matched or exceeded the measured PTIF. We hypothesized that patient oxygenation would improve as the ratio of HFNC gas flow to PTIF increased. Finally, we performed an in vitro study that used the breathing patterns acquired from the clinical study to analyze tracheal FIO2 and airway pressures changes that are associated with different HFNC flow settings.
Methods
Clinical study
This prospective observational study was approved by the ethics committee (Approval No. 18102503-IRB01) and implemented in adult ICUs at Rush University Medical Center. Due to the noninvasive features of the study, written consent was waived by the ethics committee, and verbal approval was acquired from patients. The study was registered with ClinicalTrials.gov (NCT03738345).
Study population
Adult patients aged 18–90 years who were receiving HFNC and required a minimum FIO2 of 0.4 to maintain pulse oximetry (SpO2) of 90–97% were included. Patients were excluded if they met any of the following criteria: pregnant, non-English speaking, unable to verbally communicate, or hemodynamically unstable. Patients who received inhaled pulmonary vasodilator via HFNC, were receiving extracorporeal membrane oxygenation (ECMO), or were unable to use a mask (facial trauma or claustrophobia) were also excluded.
Study procedures
Eligible patients were approached by study investigators to thoroughly explain the study, using a written information sheet. After giving verbal approval, patients were disconnected from HFNC and placed on a properly fitting full-face mask (Airlife mask, Carefusion, San Diego, USA), which was connected to a flow sensor and a Y-piece. The flow sensor was connected to a monitor (NICO2, Respironics, Murrysville, USA) to measure patient PTIF, Ti, RR, and Vt. The Y-piece was attached to two one-way valves, with one that allowed exhalation and the other enabled inhalation from a reservoir bag, which was connected to a back pressure compensated flowmeter from an oxygen-air blender (Additional file 1: Fig. S1). Blender gas flow was adjusted to maintain reservoir bag inflation of 1/2 to 3/4 full while patients were breathing, with FIO2 titrated to maintain SpO2 of 90–97%. This setup allowed patients to breathe fresh gas with a constant FIO2 during measurement to truly reflect their breathing profiles at a constant FIO2. Patients were instructed to breathe normally with the mask for at least 2 min. Breathing profiles were recorded when patient breathing appeared to be stable. A minimum of five breathing cycles were recorded and average values of PTIF, Ti, RR, and Vt were calculated.
Once breathing parameters were acquired, patients were returned to HFNC with the previous flow setting if it was lower than PTIF or with flow set at the PTIF level. Then the HFNC flow was progressively increased by 10 L/min every 5–10 min up to 60 L/min or the highest flow the patient could tolerate. At each flow setting, FIO2 was titrated to maintain SpO2 of 90–97%.
Outcome
The primary outcome was the SpO2/FIO2 at different HFNC flows above PTIF compared to the SpO2/FIO2 at HFNC flow that matched patient PTIF (defined as matching flow). The secondary outcome included RR, ROX index [(SpO2/FIO2)/RR] [23], and patient comfort scores at different flows. Comfort was self-reported by each patient using a visual numerical scale with a score of 0 as the least and 10 as the most comfort. [13, 21].
Sample size
This study was a single group pre–post comparison study designed to compare the change of SpO2/FIO2 ratio with changes in HFNC flow. Using a mean SpO2/FIO2 of 200, a standard deviation of 50 [11, 12] and SpO2/FIO2 increase of 10% to calculate the sample size, with confidence level (1 − α) of 95% and power (1 − ß) of 80%, the number of patients was 49.
In vitro study
Experiment setup
An adult manikin (Laerdal adult airway management trainer, Stavanger, Norway) with size-appropriate airway anatomy was attached to one chamber of a model lung (TTL, Michigan Instruments, Grand Rapids, USA), while the other chamber was connected to a critical care ventilator (Drager Evita XL, Drager, Lubeck, Germany) to simulate respiratory drive. The two chambers moved together via a rigid metal connector to simulate spontaneous breathing. Ventilator settings were adjusted to replicate the breathing patterns that were acquired from patients, along with their flow settings in the clinical study, and breathing patterns were confirmed by NICO2 monitor. Between the trachea and the model lung, a pressure manometer and an oxygen analyzer were connected via a T-piece to measure FIO2 and pressure, respectively (Additional file 1: Fig. S2). The manikin’s mouth was taped to simulate nose-breathing, and a nasal cannula of large-size was attached to the nose with dry gas administered from blender and flowmeter. Tracheal peak inspiratory and expiratory pressure and FIO2 were recorded after a minimum of 2 min at each flow setting.
Statistical analysis
The Kolmogorov–Smirnov test was used to test the normality of distribution for considered variables. Continuous variables among different flows were expressed as mean [standard deviation (SD)] or median [inter-quartile range (IQR)] based on the distribution of variables. Repeated measures ANOVA or Friedman test was used to compare the differences among continuous variables at different flows, while post hoc correction for all pair-wise multiple comparisons were performed using Bonferroni method. Pearson or Spearman correlation analysis was conducted to explore the correlation. p < 0.05 was considered statistically significant for all tests. Data analysis was conducted with SPSS software (SPSS 23.0; Chicago, IL).
Results
Clinical study
From December 26th, 2018, to March 30th, 2021, 49 hypoxemic patients treated by HFNC were recruited. Thirty-three (67%) patients had pulmonary etiology of AHRF. At the time of study enrollment, HFNC gas flow was set at 45 (38, 50) L/min, with FIO2 at 0.62 (0.16). SpO2/FIO2 was 160 (40) and ROX index was 7.65 (3.05) (Table 1).
Table 1.
Patients’ characteristics
| Overall | |
|---|---|
| No. of patients | 49 |
| Age, mean (SD), years | 58.0 (14.1) |
| Gender (male), n (%) | 27 (55%) |
| Height, mean (SD), cm | 167.7 (10.5) |
| Predicted body weight, mean (SD), kg | 61.9 (11.2) |
| Ethnicity, n (%) | |
| African American | 18 (37%) |
| Caucasian | 17 (35%) |
| Hispanic/Latino | 10 (20%) |
| Asian | 4 (8%) |
| Smoker, n (%) | 21 (43%) |
| Smoking package years | 20 (3.5, 39) |
| Cause of acute hypoxemic respiratory failure | |
| COVID-19 pneumonia | 25 (51%) |
| Postoperative respiratory failure | 10 (20%) |
| Non-COVID-19 pneumonia | 5 (10%) |
| Congestive heart failure | 5 (10%) |
| Lung cancer | 3 (6%) |
| Sickle cell anemia, acute chest | 1 (2%) |
| Comorbidity, n (%) | |
| Chronic lung disease | 8 (16%) |
| Chronic heart disease | 17 (35%) |
| Hypertension | 29 (59%) |
| Diabetes mellitus | 13 (27%) |
| Obesity (BMI ≥ 30 kg/m2) | 9 (18%) |
| Obstructive sleep apnea | 7 (14%) |
| Cancer | 15 (31%) |
| HFNC parameters at study enrollment | |
| FIO2, mean (SD) | 0.62 (0.16) |
| SpO2, median (IQR), % | 94 (93, 95) |
| SpO2/FIO2, mean (SD) | 160 (40) |
| ROX index, mean (SD) | 7.65 (3.05) |
| Gas flow, median (IQR), L/min | 45 (37.5, 50) |
| Breathing measurement | |
| Tidal volume, median (IQR), ml | 468 (399, 548) |
| RR, median (IQR), bpm | 21 (18, 26) |
| Ti, mean (SD), sec | 1.24 (0.41) |
| Peak tidal inspiratory flow, mean (SD), L/min | 34 (9) |
| Peak tidal inspiratory flow, median (IQR), L/min | 31 (27, 42) |
HFNC, high-flow nasal cannula; FIO2, fraction of inspired oxygen; SpO2, pulse oximetry; RR, respiratory rate; ROX, (SpO2/ FIO2)/RR; Ti, inspiratory time; BMI, body mass index; SD, standard deviation; IQR, inter-quartile range
Breathing patterns
Breathing patterns for the 49 patients were: Vt of 468 (399–548) mL, RR of 21 (18–26) breaths/min, Ti of 1.24 (0.41) second, and PTIF of 34 (9) L/min (Table 1). There was no observed correlation between PTIF and SpO2/FIO2 (r = 0.094, p = 0.52) or ROX index (r = − 0.174, p = 0.23).
Patient responses to flows above their matching flow
Among the 49 patients, PTIFs close to 20, 30, 40, and 50 L/min were recorded in 4 (8%), 27 (55%), 14 (29%) and 4 (8%) patients, respectively. All patients, except one whose matching flow was 30 L/min, tolerated the maximum gas flow of 60 L/min. As such, only 30 patients received HFNC flows of 10, 20, and 30 L/min above their matching flow. Among the 30 patients, compared to SpO2/FIO2 at the matching flow, SpO2/FIO2 was higher with HFNC flow set 10 L/min (p < 0.001) and 20 L/min (p < 0.001) higher than the matching flow (Additional file 1: Fig. S3 and Table 2), no further improvement was observed 30 L/min above matching flow. Similarly, ROX index was significantly improved at 10 L/min (p = 0.015) and 20 L/min (p < 0.001) above matching flow but there was no further increase at 30 L/min above matching flow. RR and comfort scores were not significantly different among different flows. Similar responses were also found among the 14 patients who had mean PTIF of 40 L/min and only received HFNC flows of 10 and 20 L/min above matching flow (Additional file 1: Fig. S4 and Table 2). In these patients a significant reduction of RR with 20 L/min above matching flow was also observed.
Table 2.
Patient responses to HFNC flows set above their matching flow
| PTIF | Parameters | At matching flow | At 10 L/min above matching flow | At 20 L/min above matching flow | At 30 L/min above matching flow | p |
|---|---|---|---|---|---|---|
| 20–30 L/min (n = 30) | SpO2, % | 93.8 (1.5) | 93.4 (1.6) | 93.5 (1.5) | 93.2 (1.8) | 0.151 |
| FIO2 | 0.63 (0.45, 0.82) | 0.60 (0.42, 0.71)*,† | 0.54 (0.40, 0.62)*,† | 0.49 (0.36, 0.60)*,†,& | < 0.001 | |
| SpO2/FIO2 | 161.3 (50.9) | 181.1 (61.2)* | 200.5 (66.9)*,† | 207.1 (69.7)*,† | < 0.001 | |
| No. of patients with SpO2/FIO2 improvement compared to the previous flow, % | NA | 27 (90%) | 26 (87%) | 17 (57%) | NA | |
| No. of patients whose SpO2/FIO2 improvement ≥ 20% compared to baseline, % | NA | 8 (27%) | 18 (60%) | 19 (63%) | NA | |
| RR, bpm | 23.4 (6.5) | 23.2 (6.5) | 22.2 (5.8) | 22.5 (5.6) | 0.093 | |
| ROX index | 7.5 (3.2) | 8.5 (4.0)* | 9.8 (4.7)*,† | 10.0 (4.7)*,† | < 0.001 | |
| Comfort | 8.0 (5.8, 9.6) | 8.0 (7.0, 9.5) | 8.0 (5.0, 9.3) | 8.0 (5.3, 10.0) | 0.712 | |
| 40 L/min (n = 14) | SpO2, % | 93.2 (2.0) | 93.1 (2.1) | 92.9 (2.0) | NA | 0.623 |
| FIO2 | 0.52(0.45, 0.64) | 0.48 (0.42, 0.60)* | 0.45 (0.40, 0.58)*,† | NA | < 0.001 | |
| SpO2/FIO2 | 172.0 (40.3) | 186.5 (44.2)* | 195.9 (41.7)*,† | NA | < 0.001 | |
| No. of patients with SpO2/FIO2 improvement compared to the previous flow, % | NA | 11 (79%) | 10 (71%) | NA | NA | |
| No. of patients whose SpO2/FIO2 improvement ≥ 20% compared to baseline, % | NA | 1 (7%) | 4 (29%) | NA | NA | |
| RR, bpm | 27.9 (10.8) | 26.3 (11.9) | 25.6 (10.5)* | NA | 0.016 | |
| ROX index | 6.9 (2.7) | 8.4 (3.7)* | 9.0 (4.2)* | NA | 0.006 | |
| Comfort | 8.0 (7.0, 8.3) | 8.0 (6.8, 9.6) | 7.5 (5.0, 9.0) | NA | 0.607 | |
| 50 L/min (n = 4) | SpO2, % | 93.0 (2.2) | 93.0 (1.4) | NA | NA | 0.713 |
| FIO2 | 0.64 (0.19) | 0.57 (0.16) | NA | NA | 0.066 | |
| SpO2/FIO2 | 152.7 (35.3) | 170.7 (39.6) | NA | NA | 0.068 | |
| No. of patients with SpO2/FIO2 improvement compared to the previous flow, % | NA | 4 (100%) | NA | NA | NA | |
| No. of patients whose SpO2/FIO2 improvement ≥ 20% compared to baseline, % | NA | 0 | NA | NA | NA | |
| RR, bpm | 23.8 (5.3) | 21.3 (4.6) | NA | NA | 0.461 | |
| ROX index | 6.5 (1.3) | 8.3 (3.0) | NA | NA | 0.068 | |
| Comfort | 7.8 (2.1) | 8.0 (1.6) | NA | NA | 0.317 |
PTIF, peak tidal inspiratory flow; SpO2, pulse oximetry; FIO2, fraction of inspired oxygen; RR, respiratory rate; ROX index = [(SpO2/FIO2)/RR]; comfort (0–10), 0 as the least and 10 as the most comfort; NA, not available
*p < 0.05 compared to baseline at matching flow
†p < 0.05 compared to 10 L/min above matching flow
&p < 0.05 compared to 20 L/min above matching flow
Using SpO2/FIO2 improvement ≥ 20% by increasing the flow above PTIF from the baseline to define responders, for the 30 patients whose PTIF was 20–30 L/min, only 8 (27%) patients had positive response with HFNC set 10 L/min above PTIF (meaning a set flow of 30–40 L/min), while 18 (60%) and 19 (63%) patients had positive response at 20 (meaning a set flow of 40–50 L/min) and 30 L/min (which represents a flow of 50–60 L/min) above PTIF, respectively. For the 14 patients whose PTIF was 40 L/min, only 1 (7%) and 4 (29%) patients met the positive response criteria with HFNC flow at 10 (set flow of 50 L/min) and 20 L/min (set flow of 60 L/min) above PTIF, respectively (Table 2).
Relationship between flow ratios and patient responses
The ratio of SpO2/FIO2, defined as the value of SpO2/FIO2 at different gas flows to their SpO2/FIO2 at matching flow, increased as the flow ratio (defined as different gas flows to matching flow) increased (Fig. 1). By dividing the measured SpO2/FIO2 ratios into the different quartiles of the calculated flow ratios (≤ 1, 1.01–1.33, 1.34–1.67, and ≥ 1.68), we found that the SpO2/FIO2 ratio increased as flow ratios increased. Similarly, ROX index ratio (defined as the ROX index at different gas flows to their ROX at matching flow) increased as flow ratios increased, but no further improvement was observed with flow ratios of ≥ 1.68. RR ratio (defined as the RR at different gas flows to their RR at matching flow) significantly decreased at the flow ratios of 1.34–1.67. No significant differences were found in comfort scores among different flow ratios (Fig. 2).
Fig. 1.
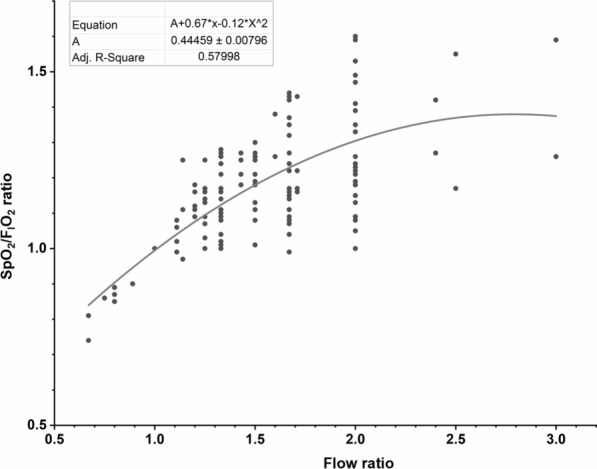
The correlation between SpO2/FIO2 ratio and flow ratio. The flow ratio of setting HFNC flow to the patient’s peak tidal inspiratory flow is shown on the X-axis. The ratio of patients’ SpO2/FIO2 at one flow setting to SpO2/FIO2 achieved when HFNC flow was set to match patient’s peak inspiratory flow during tidal breathing (matching flow) is shown on the Y-axis. The scatterplot shows significant correlation between the two ratios. SpO2, pulse oximetry; FIO2, fraction of inspired oxygen; HFNC, high-flow nasal cannula.
Fig. 2.

Patient response to different flow ratios. On the top 2 figures, X-axis is the flow ratio of setting HFNC flow to patients’ peak inspiratory flow during tidal breathing and the flow ratios are divided into four groups (≤ 1, 1.01–1.33, 1.34–1.67, and ≥ 1.68). On the Y-axis, the ratio of patients’ SpO2/FIO2 (left top) or ROX (right top) at the flow setting to SpO2/FIO2 or ROX at their matching flow are shown. As the flow ratio increased, the SpO2/FIO2 ratio increased. Similarly, compared to ROX ratio with flow ratios ≤ 1.33, ROX ratio was higher with flow ratios ≥ 1.34–1.67 and 1.68, but ROX ratio did not increase beyond flow ratios of 1.34–1.67. RR ratio was lower with flow ratios of 1.34–1.67 than with flow ratios ≤ 1 (left bottom). No significant differences of comfort score ratios were found at different flow ratios (right bottom). *p < 0.05 compared to flow ratios ≤ 1. #p < 0.05 compared to flow ratios of 1.01–1.33. &p < 0.05 compared to flow ratios of 1.34–1.67. SpO2, pulse oximetry; FIO2, fraction of inspired oxygen; RR, respiratory rate; ROX = (SpO2/FIO2)/RR
In vitro study
In the in vitro study, we replicated the breathing patterns and HFNC gas flow settings of the 49 subjects enrolled in the clinical study. We found a significant correlation between the ratio of HFNC flow to PTIF (flow ratio) and tracheal FIO2 (r = 0.511, p < 0.001), tracheal peak inspiratory pressure (r = 0.882, p < 0.001) and peak expiratory pressure (r = 0.591, p < 0.001). Tracheal peak inspiratory and expiratory pressures increased as flow ratio increased, while FIO2 stabilized with flow ratios ≥ 1 (Fig. 3).
Fig. 3.

The correlation between flow ratio and FIO2, peak inspiratory and expiratory pressure at trachea in the in vitro study. X-axis is the flow ratio of setting HFNC flow to peak tidal inspiratory flow, Y-axis is the trachea FIO2 (left), peak inspiratory (middle) and peak expiratory pressure (right). As the flow ratio increased, both peak inspiratory and expiratory pressure increased, while FIO2 stabilized when flow ratio was ≥ 1. FIO2, fraction of inspired oxygen
Discussion
This study is the first to report the breathing patterns of non-intubated patients with AHRF. Patient oxygenation improved as HFNC flow increased up to two times of their PTIF in all patients. Interestingly, the results of the in vitro study suggested that the oxygenation improvement observed above the PTIF was more likely due to the increase in the airway pressure as FIO2 remained unchanged.
Peak inspiratory flow during tidal breathing
Our findings showed that PTIF (34 [9] L/min) was higher in patients with AHRF compared to adult healthy volunteers (PTIF of 28 [9] L/min) [17] and was similar when compared to patients with tracheostomy (PTIF of 30 [27–32] L/min) [19]. Therefore, our findings align with the clinician assumption that patients with hypoxemia have higher PTIF than patients without hypoxemia [22]. However, we did not find a significant correlation between PTIF and the severity of hypoxemia.
In two recently published studies in intubated patients, PTIF varied from 25–65 L/min [20] to 40–80 L/min [21], values that were higher than PTIF in our patients. This might be explained by the need to overcome the resistance of an endotracheal tube. Butt and colleagues utilized the PTIF measured with intubation to guide HFNC flow settings after extubation. They found a significant correlation between the PTIF pre-extubation and the HFNC flow settings that patients had the greatest comfort after extubation [21]. Although PTIF measured during the spontaneous breathing trial while intubated slightly overestimated patient PTIF post-extubation, this strategy allows personalized flow titration immediately after extubation.
It should also be noted that, despite the obvious limitations in breathing pattern measurement, the breathing patterns described in the present study may provide a reference to establish settings for future in vitro studies that simulate spontaneous breathing of hypoxemic patients, such as studies on HFNC [15, 16, 18], noninvasive ventilation, or aerosol therapy [24].
Patient responses to different HFNC flows
We observed oxygenation improvement as HFNC flow increased, which agrees with others’ observations [10, 12]. When HFNC flow was increased from 30 to 60 L/min in the study by Mauri and colleagues [10] or from 20 to 60 L/min in the study by Delorme and coworkers [12], both groups found significant improvement in oxygenation, lung aeration, dynamic compliance, and work of breathing. Based on their results, both groups of investigators recommended HFNC flow of 60 L/min for adult patients with AHRF [10, 12]. However, it is worth noting that there was a high heterogeneity in patient’s response to different flows and, therefore, individualizing flow settings during HFNC therapy seems to be a reasonable approach. It was also hypothesized that the oxygenation improvement observed may be due to the increase of oxygen delivery. However, our in vitro study showed that when the flow ratio was ≥ 1, tracheal peak inspiratory and peak expiratory pressures increased as flow ratio increased with no additional increase in the FIO2. Thus, these results suggest that the oxygenation improvement observed with flow that exceed the PTIF could be, at least in part, explained by the increased airway pressure generated by these higher flows. [16–18].
Respiratory rate decreased significantly at HFNC flows set at 1.34–1.67 times of PTIF and no further improvements in ROX index were found when HFNC flows were set at ≥ 1.68 times of PTIF. Similarly, Basile and co-investigators [13] set HFNC flow based on patient predicted body weight (PBW) for 12 patients with AHRF. According to their protocol of 0.5, 1.0, and 1.5 L/min/kg of PBW, they utilized median flows of 35, 65, and 100 L/min. They found that HFNC flow at 1.5 L/min/kg of PBW was worse tolerated and did not improve homogeneity of ventilation or increase in end-expiratory lung volume (EELV) compared with HFNC flow at 1.0 L/min/kg of PBW. Moreover, the change in ROX measured at 30 L/min and 60 L/min has been correlated with a change in EELV [25]. Importantly, in 30% of the patients, the ROX index and EELV decreased after increasing the flow. These findings support our observation that an arbitrary or maximum flow setting, such as 60 L/min, might exceed the individual plateau level in some patients but might be insufficient for other patients who have high PTIF. It should be noted that the increase in EELV and lung homogeneity associated at certain flows may reduce the likelihood of patient self-inflicted lung injury (P-SILI) [26]. This is noteworthy, as P-SILI may be associated with HFNC failure and need for mechanical ventilation. Thus, like for an intubated patient, personalizing the flow settings to minimize the risk of P-SILI may be a strategy to potentially improve outcomes in AHRF patients treated with HFNC.
Currently, there is no commercially available device to measure patient PTIF, and different HFNC flows may alter PTIF given that RR and inspiratory effort are affected by the flows used [11]. Therefore, it is unlikely that baseline PTIF could be used to optimize flow settings at the bedside during HFNC therapy. The present study highlights the reality that one size (or HFNC flow, in this case) does not necessarily fit all. Thus, a pragmatic solution to set HFNC flow would be to initiate HFNC at a flow of 40 L/min then rapidly titrate upwards based on response in ROX index and respiratory rate, as well as patient tolerance/comfort. Specifically, when the improvement in ROX index begins to plateau, then optimal HFNC flow has been achieved. It is worth noting that during this titration process, FIO2 needs to be adjusted to maintain a SpO2 between the target range (preferably 90–97%) at different HFNC flow settings [27, 28].
This study has certain limitations. First, the maximum studied flow was 60 L/min, and not all patients received HFNC flows of 20 and 30 L/min above their PTIF. Therefore, in patients whose PTIF was 40 L/min or higher, whether their responses to higher flow were the same as patients whose PTIF was 30 L/min or lower is unknown. Second, this was a short-term non-randomized study that might not reveal any long-term effects. Future studies are needed to understand the long-term benefits of the individualized HFNC flow settings with more frequent measurements and flow titration. Third, breathing pattern measurements were done while the patients were not using the HFNC device. However, we maintained the same oxygenation levels during the measurement, minimizing the effect that hypoxemia may have on the respiratory pattern. Fourth, we only assessed oxygenation, respiratory rate and patient comfort at different flows, which might not reflect the lung homogeneity during tidal ventilation. Similarly, we did not measure inspiratory effort and, therefore, significant improvements in terms of reducing P-SILI might be possible with higher flows despite no associated oxygenation improvement. Indeed, better oxygenation may not be necessarily related with better outcomes. Fifthly, the in vitro study was performed with the mouth closed, and a large-size cannula, thus, the pressures achieved might not reflect the ones during daily clinical practice. Finally, the effects on oxygenation were assessed using SpO2/FIO2 instead of partial pressure of oxygen (PaO2)/FIO2. That said, many AHRF patients treated by HFNC are monitored non-invasively and SpO2/FIO2 has been shown to be a convenient, noninvasive, and practical substitute for PaO2/FIO2 [27, 28]. Therefore, this noninvasive assessment on oxygenation is clinically useful and represents what is currently done in daily clinical practice during treatment with HFNC.
Conclusion
Patients with AHRF present mean PTIF of 30–40 L/min, which did not increase with severity of hypoxemia. An increase in HFNC flows up to two times of the individual patient’s PTIF, incrementally improved oxygenation but the ROX index plateaued with HFNC flows of 1.34–1.67 times the individual PTIF. Oxygenation improvement observed with HFNC flow above the patient’s PTIF is largely due to the increase in airway pressures generated by higher flows. Thus, in patients with AHRF, setting the initial HFNC flow at 40 L/min with rapid incremental titration based on the improvement of oxygenation, respiratory rate, and patient tolerability, could be a pragmatic approach to optimize HFNC flows at the bedside.
Supplementary Information
Additional file 1: Figure S1. The setup of device to measure patient breathing patterns. Figure S2. The in vitro experiment setup. Figure S3. Individual patient responses to different flow settings for patients whose PTIF is 20-30 L/min. Figure S4. Individual patient responses to different flow settings for patients whose PTIF is 40 L/min.
Acknowledgements
We thank Tyler Weiss, Amnah A Alolaiwat and Dr. Ramandeep Kaur for their help during study implementation; we also thank Dr. Tommaso Mauri for his consultation in the study design and method.
Abbreviations
- HFNC
High-flow nasal cannula
- AHRF
Acute hypoxemic respiratory failure
- PTIF
Peak tidal inspiratory flow
- PEEP
Positive end-expiratory pressure
- FIO2
Fraction of inspired oxygen
- Vt
Tidal volume
- Ti
Inspiratory time
- RR
Respiratory rate
- SpO2
Pulse oximetry
- ECMO
Extracorporeal membrane oxygenation
- ROX index
(SpO2/FIO2)/RR
- SD
Standard deviation
- IQR
Inter-quartile range
- PBW
Predicted body weight
Authors’ contributions
JL conceived and designed the study, conducted the study, validated and analyzed the data, drafted and revised the manuscript; JBS designed the study, interpreted the data, revised the manuscript; JBF conceived and supervised the study, interpreted the data, revised the manuscript; BR designed and conducted the study, revised the manuscript; OR interpreted the data and revised the manuscript; RD conceived and supervised the study, interpreted the data, revised the manuscript. JL is the guarantor of the paper, taking responsibility for the integrity of the work as a whole, from inception to published article. All authors read and approved the final manuscript.
Funding
This study does not have funding/support.
Availability of data and materials
De-identified data will be available upon reasonable request made by researchers with approved protocol after publication.
Declarations
Ethics approval and consent to participate
The clinical study was approved by the ethic committee in Rush University Medical Center (Approval No. 18102503-IRB01). Written consent was waived by the ethic committee in Rush University Medical Center.
Consent for publication
Not applicable.
Competing interests
Dr. Li declares to receive research funding from Fisher & Paykel Healthcare Ltd, Aerogen Ltd, and Rice Foundation and lecture honorarium from American Association for Respiratory Care, Aerogen Ltd, Heyer Ltd, and Fisher & Paykel Healthcare Ltd outside the submitted work. Dr. Li is the section editor for respiratory care journal. Dr. Scott declares to receive research funding from Teleflex. Dr. Fink is Chief Science Officer for Aerogen Pharma Corp. Dr. Dhand reports remuneration from GSK Pharmaceuticals, Boehringer-Ingelheim, Bayer, Mylan, Teva, and Astra-Zeneca Pharmaceuticals outside the submitted work. Dr. Roca discloses a research grant from Hamilton Medical and speaker fees from Hamilton Medical, Ambu, Aerogen Ltd, and Fisher & Paykel, and non-financial research support from Timpel and Masimo Corporation. None of the companies/institutions had a role in the study design, data collection, analysis, preparation of the manuscript, or the decision to publish the findings. Ms. Reed has no conflicts to disclose.
Footnotes
Publisher's Note
Springer Nature remains neutral with regard to jurisdictional claims in published maps and institutional affiliations.
References
- 1.Li J, Jing GQ, Scott JB. Year in review 2019: High-flow nasal cannula (HFNC) oxygen therapy for adult patients. Respir Care. 2020;65(4):545–557. doi: 10.4187/respcare.07663. [DOI] [PubMed] [Google Scholar]
- 2.Liu K, Jing G, Scott JB, Li J. Postoperative management of hypoxemia. Respir Care. 2021;66(7):1136–1149. doi: 10.4187/respcare.08929. [DOI] [PubMed] [Google Scholar]
- 3.Lewis SR, Baker PE, Parker R, Smith AF. High-flow nasal cannulae for respiratory support in adult intensive care patients. Cochrane Database Syst Rev. 2021;3(3):CD010172. doi: 10.1002/14651858.CD010172.pub3. [DOI] [PMC free article] [PubMed] [Google Scholar]
- 4.Yasuda H, Okano H, Mayumi T, Narita C, Onodera Y, Nakane M, Shime N. Post-extubation oxygenation strategies in acute respiratory failure: a systematic review and network meta-analysis. Crit Care. 2021;25(1):135. doi: 10.1186/s13054-021-03550-4. [DOI] [PMC free article] [PubMed] [Google Scholar]
- 5.Chaudhuri D, Granton D, Wang DX, Burns KEA, Helviz Y, Einav S, et al. High-flow nasal cannula in the immediate postoperative period: a systematic review and meta-analysis. Chest. 2020;158(5):1934–1946. doi: 10.1016/j.chest.2020.06.038. [DOI] [PubMed] [Google Scholar]
- 6.Rochwerg B, Einav S, Chaudhuri D, Mancebo J, Mauri T, Helviz Y, et al. The role for high flow nasal cannula as a respiratory support strategy in adults: a clinical practice guideline. Intensive Care Med. 2020;46(12):2226–2237. doi: 10.1007/s00134-020-06312-y. [DOI] [PMC free article] [PubMed] [Google Scholar]
- 7.Rochwerg B, Granton D, Wang DX, Helviz Y, Einav S, Frat JP, et al. High flow nasal cannula compared with conventional oxygen therapy for acute hypoxemic respiratory failure: a systematic review and meta-analysis. Intensive Care Med. 2019;45(5):563–572. doi: 10.1007/s00134-019-05590-5. [DOI] [PubMed] [Google Scholar]
- 8.Frat JP, Thille AW, Mercat A, Girault C, Ragot S, Perbet S, et al. High-flow oxygen through nasal cannula in acute hypoxemic respiratory failure. N Engl J Med. 2015;372(23):2185–2196. doi: 10.1056/NEJMoa1503326. [DOI] [PubMed] [Google Scholar]
- 9.Okuda M, Tanaka N, Naito K, Kumada T, Fukuda K, Kato Y, et al. Evaluation by various methods of the physiological mechanism of a high-flow nasal cannula (HFNC) in healthy volunteers. BMJ Open Respir Res. 2017;4(1):e000200. doi: 10.1136/bmjresp-2017-000200. [DOI] [PMC free article] [PubMed] [Google Scholar]
- 10.Mauri T, Alban L, Turrini C, Cambiaghi B, Carlesso E, Taccone P, et al. Optimum support by high-flow nasal cannula in acute hypoxemic respiratory failure: effects of increasing flow rates. Intensive Care Med. 2017;43(10):1453–1463. doi: 10.1007/s00134-017-4890-1. [DOI] [PubMed] [Google Scholar]
- 11.Mauri T, Turrini C, Eronia N, Grasselli G, Volta CA, Bellani G, Pesenti A. Physiologic effects of high-flow nasal cannula in acute hypoxemic respiratory failure. Am J Respir Crit Care Med. 2017;195(9):1207–1215. doi: 10.1164/rccm.201605-0916OC. [DOI] [PubMed] [Google Scholar]
- 12.Delorme M, Bouchard PA, Simon M, Simard S, Lellouche F. Effects of high-flow nasal cannula on the work of breathing in patients recovering from acute respiratory failure. Crit Care Med. 2017;45(12):1981–1988. doi: 10.1097/CCM.0000000000002693. [DOI] [PubMed] [Google Scholar]
- 13.Basile MC, Mauri T, Spinelli E, Dalla Corte F, Montanari G, Marongiu I, et al. Nasal high flow higher than 60 L/min in patients with acute hypoxemic respiratory failure: a physiological study. Crit Care. 2020;24(1):654. doi: 10.1186/s13054-020-03344-0. [DOI] [PMC free article] [PubMed] [Google Scholar]
- 14.Nielsen KR, Ellington LE, Gray AJ, Stanberry LI, Smith LS, DiBlasi RM. Effect of high-flow nasal cannula on expiratory pressure and ventilation in infant, pediatric, and adult models. Respir Care. 2018;63(2):147–157. doi: 10.4187/respcare.05728. [DOI] [PubMed] [Google Scholar]
- 15.Parke RL, Eccleston ML, McGuinness SP. The effects of flow on airway pressure during nasal high-flow oxygen therapy. Respir Care. 2011;56(8):1151–1155. doi: 10.4187/respcare.01106. [DOI] [PubMed] [Google Scholar]
- 16.Luo JC, Lu MS, Zhao ZH, Jiang W, Xu B, Weng L, et al. Positive end-expiratory pressure effect of 3 high-flow nasal cannula devices. Respir Care. 2017;62(7):888–895. doi: 10.4187/respcare.05337. [DOI] [PubMed] [Google Scholar]
- 17.Ritchie JE, Williams AB, Gerard C, Hockey H. Evaluation of a humidified nasal high-flow oxygen system, using oxygraphy, capnography and measurement of upper airway pressures. Anaesth Intensive Care. 2011;39(6):1103–1110. doi: 10.1177/0310057X1103900620. [DOI] [PubMed] [Google Scholar]
- 18.Chikata Y, Onodera M, Oto J, Nishimura M. FIO2 in an adult model simulating high-flow nasal cannula therapy. Respir Care. 2017;62(2):193–198. doi: 10.4187/respcare.04963. [DOI] [PubMed] [Google Scholar]
- 19.Chanques G, Riboulet F, Molinari N, Carr J, Jung B, Prades A, et al. Comparison of three high flow oxygen therapy delivery devices: a clinical physiological cross-over study. Minerva Anestesiol. 2013;79(12):1344–1355. [PubMed] [Google Scholar]
- 20.Mauri T, Spinelli E, Dalla Corte F, Scotti E, Turrini C, Lazzeri M, et al. Noninvasive assessment of airflows by electrical impedance tomography in intubated hypoxemic patients: an exploratory study. Ann Intensive Care. 2019;9(1):83. doi: 10.1186/s13613-019-0560-5. [DOI] [PMC free article] [PubMed] [Google Scholar]
- 21.Butt S, Pistidda L, Floris L, Liperi C, Vasques F, Glover G, et al. Initial setting of high-flow nasal oxygen post extubation based on mean inspiratory flow during a spontaneous breathing trial. J Crit Care. 2021;63:40–44. doi: 10.1016/j.jcrc.2020.12.022. [DOI] [PubMed] [Google Scholar]
- 22.Li J, Tu M, Yang L, Jing G, Fink JB, Burtin C, et al. Worldwide clinical practice of high-flow nasal cannula and concomitant aerosol therapy in critical care practice. Respir Care. 2021;66(9):1416–1424. doi: 10.4187/respcare.08996. [DOI] [PubMed] [Google Scholar]
- 23.Roca O, Caralt B, Messika J, Samper M, Sztrymf B, Hernández G, et al. An index combining respiratory rate and oxygenation to predict outcome of nasal high-flow therapy. Am J Respir Crit Care Med. 2019;199(11):1368–1376. doi: 10.1164/rccm.201803-0589OC. [DOI] [PubMed] [Google Scholar]
- 24.Li J, Fink JB, MacLoughlin R, Dhand R. A narrative review on trans-nasal pulmonary aerosol delivery. Crit Care. 2020;24:506. doi: 10.1186/s13054-020-03206-9. [DOI] [PMC free article] [PubMed] [Google Scholar]
- 25.Mauri T, Carlesso E, Spinelli E, Turrini C, Corte FD, Russo R, et al. Increasing support by nasal high flow acutely modifies the ROX index in hypoxemic patients: A physiologic study. J Crit Care. 2019;53:183–185. doi: 10.1016/j.jcrc.2019.06.020. [DOI] [PubMed] [Google Scholar]
- 26.Grieco DL, Menga LS, Eleuteri D, Antonelli M. Patient self-inflicted lung injury: implications for acute hypoxemic respiratory failure and ARDS patients on non-invasive support. Minerva Anestesiol. 2019;85(9):1014–1023. doi: 10.23736/S0375-9393.19.13418-9. [DOI] [PubMed] [Google Scholar]
- 27.Chen W, Janz DR, Shaver CM, Bernard GR, Bastarache JA, Ware LB. Clinical characteristics and outcomes are similar in ARDS diagnosed by oxygen saturation/Fio2 ratio compared with Pao2/Fio2 ratio. Chest. 2015;148:1477–1483. doi: 10.1378/chest.15-0169. [DOI] [PMC free article] [PubMed] [Google Scholar]
- 28.Rice TW, Wheeler AP, Bernard GR, Hayden DL, Schoenfeld DA, Ware LB, et al. Comparison of the SpO2/FIO2 ratio and the PaO2/FIO2 ratio in patients with acute lung injury or ARDS. Chest. 2007;132:410–417. doi: 10.1378/chest.07-0617. [DOI] [PubMed] [Google Scholar]
Associated Data
This section collects any data citations, data availability statements, or supplementary materials included in this article.
Supplementary Materials
Additional file 1: Figure S1. The setup of device to measure patient breathing patterns. Figure S2. The in vitro experiment setup. Figure S3. Individual patient responses to different flow settings for patients whose PTIF is 20-30 L/min. Figure S4. Individual patient responses to different flow settings for patients whose PTIF is 40 L/min.
Data Availability Statement
De-identified data will be available upon reasonable request made by researchers with approved protocol after publication.